Data visualization. map
- 1. Data Visualization: Map Mr. Montree Lorlertsakul
- 2. WhatŌĆÖs in a map?? ÓĖ½ÓĖ▒ÓĖ¦ÓĖéÓ╣ēÓĖŁ ÓĖ¬ÓĖ▒ÓĖöÓĖ¬Ó╣łÓĖ¦ÓĖÖ (Scale) ÓĖŚÓĖ┤ÓĖ© ÓĖ¬ÓĖ▒ÓĖŹÓĖźÓĖ▒ÓĖüÓĖ®ÓĖōÓ╣ī (Legend)
- 4. Type of data visualization. ŌĆó 1D/Linear ŌĆó 2D/Planar ŌĆó 3D/Volumetric ŌĆó Temporal ŌĆó nD/Multidimensional ŌĆó Tree/Hierarchical ŌĆó Network https://guides.library.duke.edu/datavis/vis_types
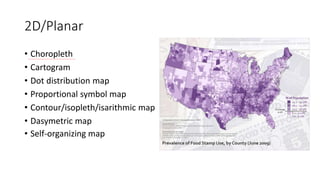
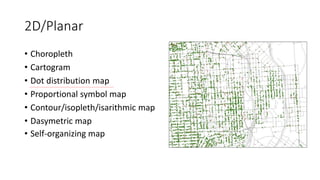
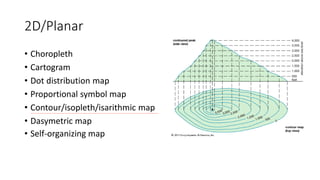
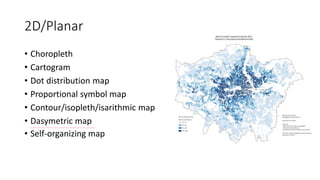
- 5. 2D/Planar ŌĆó Choropleth ŌĆó Cartogram ŌĆó Dot distribution map ŌĆó Proportional symbol map ŌĆó Contour/isopleth/isarithmic map ŌĆó Dasymetric map ŌĆó Self-organizing map
- 6. 2D/Planar ŌĆó Choropleth ŌĆó Cartogram ŌĆó Dot distribution map ŌĆó Proportional symbol map ŌĆó Contour/isopleth/isarithmic map ŌĆó Dasymetric map ŌĆó Self-organizing map
- 7. 2D/Planar ŌĆó Choropleth ŌĆó Cartogram ŌĆó Dot distribution map ŌĆó Proportional symbol map ŌĆó Contour/isopleth/isarithmic map ŌĆó Dasymetric map ŌĆó Self-organizing map
- 8. 2D/Planar ŌĆó Choropleth ŌĆó Cartogram ŌĆó Dot distribution map ŌĆó Proportional symbol map ŌĆó Contour/isopleth/isarithmic map ŌĆó Dasymetric map ŌĆó Self-organizing map
- 9. 2D/Planar ŌĆó Choropleth ŌĆó Cartogram ŌĆó Dot distribution map ŌĆó Proportional symbol map ŌĆó Contour/isopleth/isarithmic map ŌĆó Dasymetric map ŌĆó Self-organizing map
- 10. 2D/Planar ŌĆó Choropleth ŌĆó Cartogram ŌĆó Dot distribution map ŌĆó Proportional symbol map ŌĆó Contour/isopleth/isarithmic map ŌĆó Dasymetric map ŌĆó Self-organizing map
- 11. 2D/Planar ŌĆó Choropleth ŌĆó Cartogram ŌĆó Dot distribution map ŌĆó Proportional symbol map ŌĆó Contour/isopleth/isarithmic map ŌĆó Dasymetric map ŌĆó Self-organizing map
- 12. 2D/Planar ŌĆó Choropleth ŌĆó Cartogram ŌĆó Dot distribution map ŌĆó Proportional symbol map ŌĆó Contour/isopleth/isarithmic map ŌĆó Dasymetric map ŌĆó Self-organizing map
- 13. Type of data visualization. ŌĆó Noninteractive ŌĆó Interactive
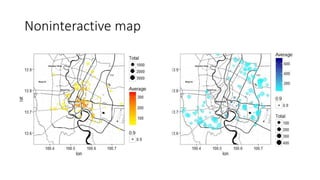
- 14. Noninteractive map Package = ggmap Map <- get_map(location = c(lon = 100.54, lat = 13.76), zoom = 11.5, maptype = 'toner', source = "google")
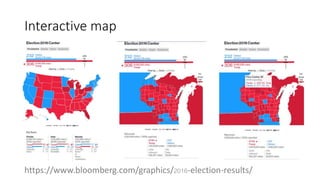
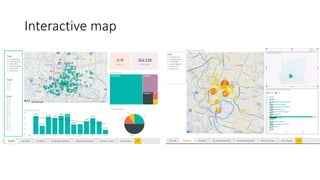
- 18. Interactive map
- 19. Spatial analysis ŌĆó Heatmap ŌĆó Vector Spatial Analysis (Buffers) ŌĆó Nearest Neighborhood Analysis ŌĆó Spatial Regression Analysis ŌĆó Etc.
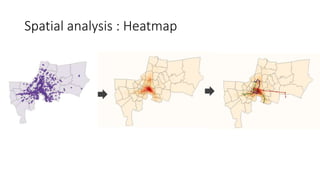
- 20. Spatial analysis : Heatmap
- 21. Spatial analysis : Buffers https://docs.qgis.org/2.8/en/docs/gentle_gis_introduction/vector_spatial_analysis_buffers.html
- 22. Spatial analysis : Nearest Neighborhood Analysis http://www.qgistutorials.com/en/docs/nearest_neighbor_analysis.html
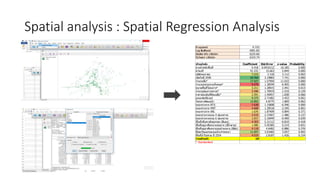
- 23. Spatial analysis : Spatial Regression Analysis 0.722 -3091.83 6225.66 6319.74 ÓĖĢÓĖ▒ÓĖ¦Ó╣üÓĖøÓĖŻÓĖĢÓ╣ēÓĖÖ Coefficient Std.Error z-value Probability ÓĖ¢Ó╣łÓĖ¦ÓĖćÓĖÖÓ╣ēÓĖ│ÓĖ½ÓĖÖÓĖ▒ÓĖüÓĖ×ÓĖĘÓ╣ēÓĖÖÓĖŚÓĖĄÓ╣ł 0.418 0.0410112 10.185 0.000 ÓĖäÓ╣łÓĖ│ÓĖäÓĖćÓĖŚÓĖĄÓ╣ł 91.532 15.663 5.844 0.000 ÓĖÜÓĖŻÓĖ┤ÓĖ®ÓĖ▒ÓĖŚÓĖĪÓĖ½ÓĖ│ÓĖŖÓĖÖ 7.215 2.318 3.112 0.002 Ó╣ĆÓĖøÓĖ┤ÓĖöÓ╣āÓĖÖÓĖøÓĖĄ 2558 24.764 3.19883 7.741 0.000 ÓĖłÓĖ│ÓĖÖÓĖ¦ÓĖÖÓĖŖÓĖ▒Ó╣ēÓĖÖ* 17.427 1.57959 11.033 0.000 ÓĖłÓĖ│ÓĖÖÓĖ¦ÓĖÖÓĖ½ÓĖÖÓ╣łÓĖ¦ÓĖóÓĖéÓĖ│ÓĖóÓĖŚÓĖ▒Ó╣ēÓĖćÓĖ½ÓĖĪÓĖö* 9.570- 1.38599 -6.905 0.000 ÓĖéÓĖÖÓĖ│ÓĖöÓĖ×ÓĖĘÓ╣ēÓĖÖÓĖŚÓĖĄÓ╣łÓ╣éÓĖäÓĖŻÓĖćÓĖüÓĖ│ÓĖŻ* 3.211 1.28915 2.491 0.013 ÓĖłÓĖ│ÓĖÖÓĖ¦ÓĖÖÓĖŖÓ╣łÓĖŁÓĖćÓĖüÓĖ│ÓĖŻÓĖłÓĖŻÓĖ│ÓĖłÓĖŻ* 2.596- 1.70919 -1.519 0.129 ÓĖŻÓĖ│ÓĖäÓĖ│ÓĖøÓĖŻÓĖ░Ó╣ĆÓĖĪÓĖ┤ÓĖÖÓĖŚÓĖĄÓ╣łÓĖöÓĖ┤ÓĖÖÓ╣ĆÓĖēÓĖźÓĖĄÓ╣łÓĖó* 2.591 1.40957 1.838 0.066 Ó╣üÓĖ¢ÓĖĪÓ╣ĆÓĖ¤ÓĖŁÓĖŻÓ╣īÓĖÖÓĖ┤Ó╣ĆÓĖłÓĖŁÓĖŻÓ╣ī 9.375 2.71482 3.453 0.001 Ó╣éÓĖäÓĖŻÓĖćÓĖüÓĖ│ÓĖŻÓĖĢÓĖ┤ÓĖöÓ╣üÓĖĪÓ╣łÓĖÖÓ╣ēÓĖ│ 12.852 6.8775 1.869 0.062 ÓĖŻÓĖ░ÓĖóÓĖ░ÓĖ½Ó╣łÓĖ│ÓĖćÓĖłÓĖ│ÓĖü BTS 7.638- 1.15808 -6.596 0.000 ÓĖŻÓĖ░ÓĖóÓĖ░ÓĖ½Ó╣łÓĖ│ÓĖćÓĖłÓĖ│ÓĖü MRT 4.668- 1.39518 -3.345 0.001 ÓĖŻÓĖ░ÓĖóÓĖ░ÓĖ½Ó╣łÓĖ│ÓĖćÓĖłÓĖ│ÓĖü ARL 1.676 1.87409 0.894 0.371 ÓĖŻÓĖ░ÓĖóÓĖ░ÓĖ½Ó╣łÓĖ│ÓĖćÓĖłÓĖ│ÓĖüÓĖ¢ÓĖÖÓĖÖ 4 ÓĖŖÓ╣łÓĖŁÓĖćÓĖłÓĖŻÓĖ│ÓĖłÓĖŻ 3.533- 2.37667 -1.486 0.137 ÓĖŻÓĖ░ÓĖóÓĖ░ÓĖ½Ó╣łÓĖ│ÓĖćÓĖłÓĖ│ÓĖüÓĖ¢ÓĖÖÓĖÖ 6 ÓĖŖÓ╣łÓĖŁÓĖćÓĖłÓĖŻÓĖ│ÓĖłÓĖŻ 1.017- 2.16949 -0.469 0.639 ÓĖ×ÓĖĘÓ╣ēÓĖÖÓĖŚÓĖĄÓ╣łÓ╣ĆÓĖ×ÓĖĘÓ╣łÓĖŁÓĖ×ÓĖ│ÓĖōÓĖ┤ÓĖŖÓĖóÓĖüÓĖŻÓĖŻÓĖĪ (ÓĖ¬ÓĖĄÓ╣üÓĖöÓĖć) 4.303- 5.31112 -0.810 0.418 ÓĖ×ÓĖĘÓ╣ēÓĖÖÓĖŚÓĖĄÓ╣łÓĖŁÓĖóÓĖ╣Ó╣łÓĖŁÓĖ│ÓĖ©ÓĖ▒ÓĖóÓĖ½ÓĖÖÓĖ│Ó╣üÓĖÖÓ╣łÓĖÖÓĖĪÓĖ│ÓĖü (ÓĖ¬ÓĖĄÓĖÖÓ╣ēÓĖ│ÓĖĢÓĖ│ÓĖź) 1.080 5.05385 0.214 0.831 ÓĖ×ÓĖĘÓ╣ēÓĖÖÓĖŚÓĖĄÓ╣łÓĖŁÓĖóÓĖ╣Ó╣łÓĖŁÓĖ│ÓĖ©ÓĖ▒ÓĖóÓĖ½ÓĖÖÓĖ│Ó╣üÓĖÖÓ╣łÓĖÖÓĖøÓĖ│ÓĖÖÓĖüÓĖźÓĖ│ÓĖć (ÓĖ¬ÓĖĄÓĖ¬ Ó╣ēÓĖĪ) 4.118- 4.6482 -0.886 0.376 ÓĖØÓĖ▒Ó╣łÓĖćÓĖĢÓĖ░ÓĖ¦ÓĖ▒ÓĖÖÓĖŁÓĖŁÓĖüÓĖéÓĖŁÓĖćÓ╣üÓĖĪÓ╣łÓĖÖÓ╣ēÓĖ│Ó╣ĆÓĖł Ó╣ēÓĖ│ÓĖ×ÓĖŻÓĖ░ÓĖóÓĖ│ 11.057 3.61682 3.057 0.002 ÓĖ×ÓĖĘÓ╣ēÓĖÖÓĖŚÓĖĄÓ╣łÓĖÖÓ╣ēÓĖ│Ó╣äÓĖĪÓ╣łÓĖŚÓ╣łÓĖ¦ÓĖĪ ÓĖøÓĖĄ 2554 4.019- 2.8187 -1.426 0.154 ÓĖŻÓĖ¦ÓĖĪÓĖĢÓĖ▒ÓĖ¦Ó╣üÓĖøÓĖŻ 19 * Standardized Schwarz criterion R-squared Log likelihood Akaike info criterion
Editor's Notes
- Pandora -- This map from streaming website Pandora attempts to show the┬Āfavourite dance music tracks┬Āin each US state//top Pandora dance tracks by state http://brilliantmaps.com/air-pollution/ -- As the map above shows, China is home to many of the worldŌĆÖs┬Āmost polluted┬Ācities. The map was created by┬ĀAQICN, a Chinese website that tracks global air pollution stats.
- http://blog.visme.co/how-to-communicate-technical-information/ https://guides.library.duke.edu/datavis/vis_types https://sites.google.com/site/thematicmap2557/cartogram
- Choropleth:┬Āthis is a map that has its areas of interest categorized in colors or patterns. Its goal is to offer an overall view of how a certain feature like population density is different from area to area. Read more at http://blog.visme.co/how-to-communicate-technical-information/#POhOS1DLfSOmU9LS.99
- Cartogram:┬Āthis type of map substitutes land area or distance for certain variables. For example, the size of districts can be altered to show how many citizens there are in contrast with other districts Read more at http://blog.visme.co/how-to-communicate-technical-information/#POhOS1DLfSOmU9LS.99
- Dot Distribution Map:┬Āthis map representation uses dots to signal the presence of certain factors within a certain area. One dot represents the location of the phenomenon that data recorded. Thus, it is convenient to observe the impact of a certain agent in an entire country Read more at http://blog.visme.co/how-to-communicate-technical-information/#POhOS1DLfSOmU9LS.99
- Dasymetric map
- Dasymetric map
- A self-organizing map showing┬ĀU.S. Congress┬Āvoting patterns. The input data was a table with a row for each member of Congress, and columns for certain votes containing each member's yes/no/abstain vote. The SOM algorithm arranged these members in a two-dimensional grid placing similar members closer together.┬ĀThe first plot┬Āshows the grouping when the data are split into two clusters.┬ĀThe second plot┬Āshows average distance to neighbours: larger distances are darker.┬ĀThe third plot┬Āpredicts┬ĀRepublican┬Ā(red) or┬ĀDemocratic┬Ā(blue) party membership.┬ĀThe other plots┬Āeach overlay the resulting map with predicted values on an input dimension: red means a predicted 'yes' vote on that bill, blue means a 'no' vote. The plot was created in┬ĀSynapse.
- https://guides.library.duke.edu/datavis/vis_types
- http://www.qgistutorials.com/en/docs/nearest_neighbor_analysis.html
- ÓĖüÓĖ▓ÓĖŻÓĖ¦ÓĖ┤Ó╣ĆÓĖäÓĖŻÓĖ▓ÓĖ░ÓĖ½Ó╣īÓĖ¬ÓĖĪÓĖüÓĖ▓ÓĖŻÓĖ¢ÓĖöÓĖ¢ÓĖŁÓĖóÓ╣ĆÓĖŖÓĖ┤ÓĖćÓĖŚÓĖĄÓ╣łÓĖĢÓĖ▒Ó╣ēÓĖć (Spatial Regression) ÓĖäÓĖ│ÓĖÖÓĖČÓĖćÓĖŁÓĖ┤ÓĖŚÓĖśÓĖ┤ÓĖ×ÓĖźÓĖŚÓĖ▓ÓĖćÓĖĀÓĖ╣ÓĖĪÓĖ┤ÓĖ©ÓĖ▓ÓĖ¬ÓĖĢÓĖŻÓ╣īÓĖŚÓĖĄÓ╣łÓ╣äÓĖöÓ╣ēÓĖäÓĖŻÓĖŁÓĖÜÓĖäÓĖźÓĖĖÓĖĪÓĖŁÓĖ┤ÓĖŚÓĖśÓĖ┤ÓĖ×ÓĖźÓĖéÓĖŁÓĖćÓĖŚÓĖĄÓ╣łÓĖĢÓĖ▒Ó╣ēÓĖć

