Data Visualization Using Tableau
ŌĆóDownload as PPTX, PDFŌĆó
0 likesŌĆó579 views

This document discusses how Tableau can help with data exploration and reporting compared to traditional business intelligence solutions. It notes that traditional solutions have drawbacks like requiring IT support to generate reports and making it difficult to connect multiple data sources. Tableau allows users to easily create graphs and dashboards with drag and drop functionality while connecting to various data sources like cloud databases, big data, Excel, and relational databases without needing IT support. This empowers business users to generate their own reports.


Data Visualization Using Tableau
- 1. Data Exploration Using Tableau
- 2. Why do we need yet another solution when we already haveŌĆ”.
- 3. Traditional Business Intelligence Systems SAS SAP Statistical Programming languages R MATLAB and more..
- 4. These solutions have few drawbacksŌĆ”
- 5. Traditional solution drawbacks -Needs IT support to generate reports. - Connecting multiple data sources is major undertaking - No support for Connecting newer cloud based database.
- 6. How does Tableau help solve it?
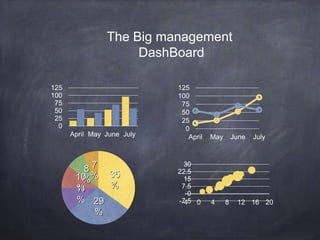
- 7. Tableau allows you to create Graphs with simple drag n drop..
- 8. 125 100 75 50 25 0 The Big management April May June July 35 % 29 % 8 % 10 % 11 % 7 % DashBoard 125 100 75 50 25 0 April May June July 30 22.5 15 7.5 0 -7.5 -4 0 4 8 12 16 20
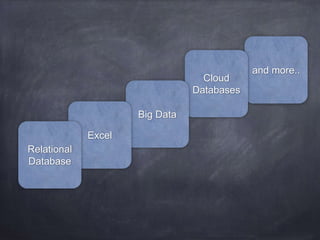
- 9. While Connecting with multiple data sources..
- 10. and more.. Cloud Databases Big Data Excel Relational Database
- 11. With Tableau, you donŌĆÖt need IT support. Business can generate their own reports.
- 12. Before Tableau Number of people who can generate reports.
- 13. After Tableau Number of people who can generate reports.
- 14. Thank you! Meera Bavadekar