dataflowdiagram2 121005140736-phpapp01
Download as pptx, pdf1 like538 views

This document defines and provides examples of various modeling techniques used in systems analysis and design: 1) Data Flow Diagrams (DFDs) visually represent the flow of data through a system and its processes, data stores, external entities, and levels of abstraction. 2) Decision tables organize the conditions and expected outcomes of decision logic in a matrix format. 3) Decision charts use a tree structure to model decisions, consequences, probabilities, costs, and utilities. 4) Structure charts describe the hierarchical modular structure and relationships between functions, subfunctions, modules, and control logic (conditions, loops, data coupling) within a system or computer program.


![Flow Chart & Input Output Statement [3] M](https://cdn.slidesharecdn.com/ss_thumbnails/flow-chart-inputoutput-statement-3-m-1233232763031429-3-thumbnail.jpg?width=560&fit=bounds)
More Related Content
What's hot (18)
Viewers also liked (13)


Similar to dataflowdiagram2 121005140736-phpapp01 (20)


dataflowdiagram2 121005140736-phpapp01
- 1. DFD, Decision Table, Decision Chart, Structure Charts
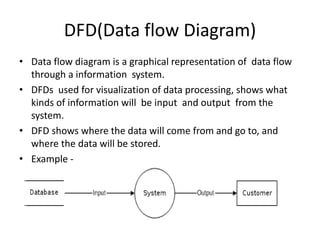
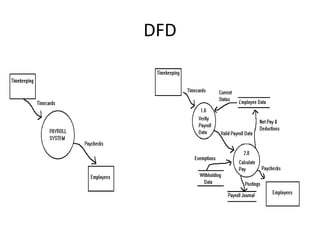
- 2. DFD(Data flow Diagram) • Data flow diagram is a graphical representation of data flow through a information system. • DFDs used for visualization of data processing, shows what kinds of information will be input and output from the system. • DFD shows where the data will come from and go to, and where the data will be stored. • Example -
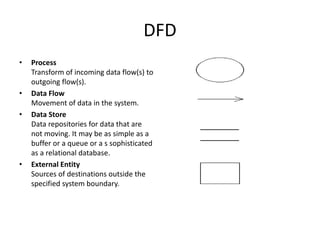
- 3. DFD • Process Transform of incoming data flow(s) to outgoing flow(s). • Data Flow Movement of data in the system. • Data Store Data repositories for data that are not moving. It may be as simple as a buffer or a queue or a s sophisticated as a relational database. • External Entity Sources of destinations outside the specified system boundary.
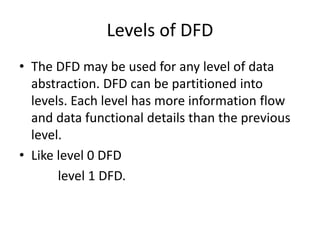
- 4. Levels of DFD • The DFD may be used for any level of data abstraction. DFD can be partitioned into levels. Each level has more information flow and data functional details than the previous level. • Like level 0 DFD level 1 DFD.
- 5. DFD
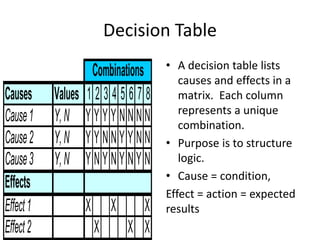
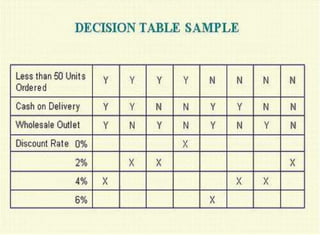
- 6. Decision Table Combinations • A decision table lists Causes Values 1 2 3 4 5 6 7 8 Cause 1 Y, N Y Y Y Y N N N N Cause 2 Y, N Y Y N N Y Y N N Cause 3 Y, N Y N Y N Y N Y N Effects Effect 1 X X X Effect 2 X X X causes and effects in a matrix. Each column represents a unique combination. • Purpose is to structure logic. • Cause = condition, Effect = action = expected results
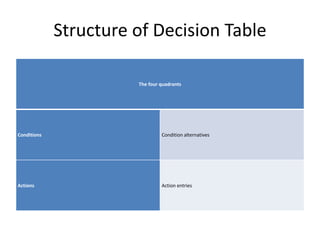
- 7. Structure of Decision Table The four quadrants Conditions Condition alternatives Actions Action entries
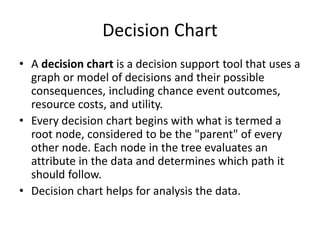
- 9. Decision Chart • A decision chart is a decision support tool that uses a graph or model of decisions and their possible consequences, including chance event outcomes, resource costs, and utility. • Every decision chart begins with what is termed a root node, considered to be the "parent" of every other node. Each node in the tree evaluates an attribute in the data and determines which path it should follow. • Decision chart helps for analysis the data.
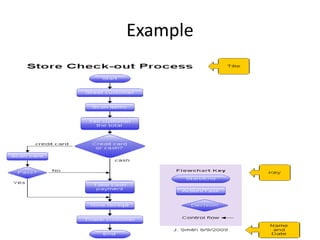
- 10. Example
- 11. Structure Chart • Describe functions and sub-functions of each part of system (in more detail than a DFD) • Show relationships between common and unique modules of a computer program • Hierarchical, Modular structure – Each layer in a program performs specific activities – Each module performs a specific function
- 12. Steps in drawing a structure chart • Review the DFDs and object models • Identify modules and relationships • Add couples, loops, and conditions • Analyze the structure chart, the DFDs, and the data dictionary
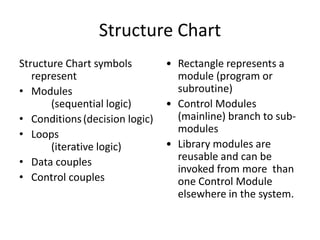
- 13. Structure Chart Structure Chart symbols represent • Modules (sequential logic) • Conditions (decision logic) • Loops (iterative logic) • Data couples • Control couples • Rectangle represents a module (program or subroutine) • Control Modules (mainline) branch to sub-modules • Library modules are reusable and can be invoked from more than one Control Module elsewhere in the system.
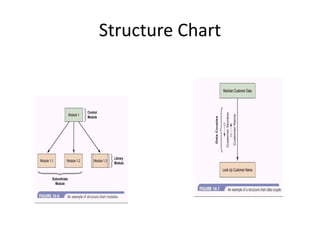
- 14. Structure Chart
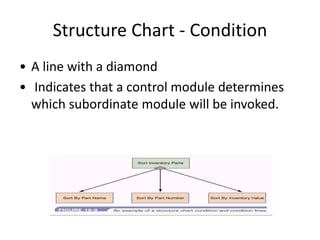
- 15. Structure Chart - Condition • A line with a diamond • Indicates that a control module determines which subordinate module will be invoked.
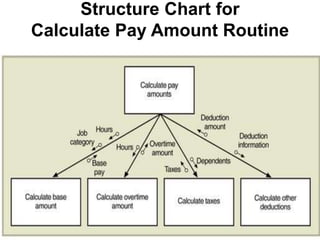
- 16. Structure Chart for Calculate Pay Amount Routine
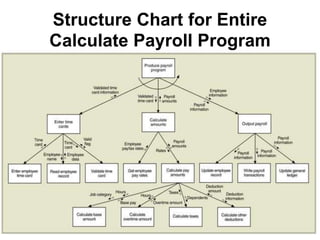
- 17. Structure Chart for Entire Calculate Payroll Program
- 18. Summary - Structure Charts – Show the relationships among program modules – Structure Chart consists of: • Modules - Related program code organized into small units that are easy to understand and maintain • Data couples - Data passed between modules • Control couples - Data passed between modules that indicates a condition or action to another module (e.g. End of File) • Conditions - determines what subordinate module a control module will run • Loops - Indicates one or more subordinate modules are repeated – Structure Charts are based on the DFD and Data Dictionary