Data visualization 101
- 1. Data Visualization 101 weibo @jexchan Thursday, January 10, 13
- 2. Thursday, January 10, 13
- 4. Thursday, January 10, 13
- 5. Thursday, January 10, 13
- 6. Thursday, January 10, 13
- 7. United States debt http://usdebt.kleptocracy.us/ Thursday, January 10, 13
- 10. Thursday, January 10, 13
- 11. ¡° Data is the new oil ¡± http://goo.gl/9a1wv Thursday, January 10, 13
- 12. Thursday, January 10, 13
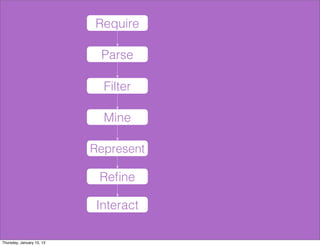
- 13. Require Parse Filter Mine Represent Re?ne Interact Thursday, January 10, 13
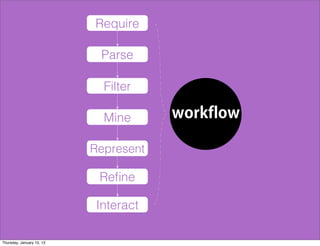
- 14. Require Parse Filter Mine workflow Represent Re?ne Interact Thursday, January 10, 13
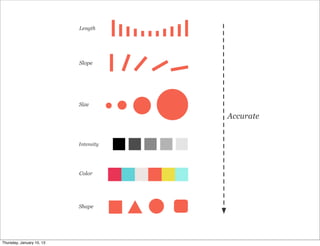
- 15. Graphic Vocabulary Thursday, January 10, 13
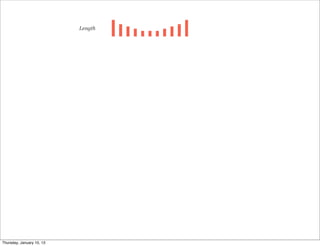
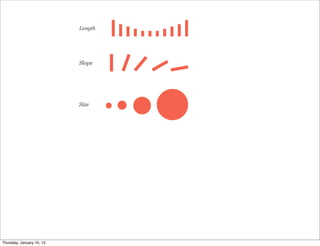
- 16. Length Thursday, January 10, 13
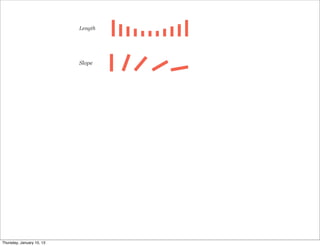
- 17. Length Slope Thursday, January 10, 13
- 18. Length Slope Size Thursday, January 10, 13
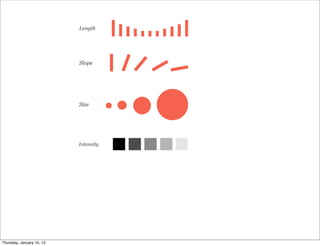
- 19. Length Slope Size Intensity Thursday, January 10, 13
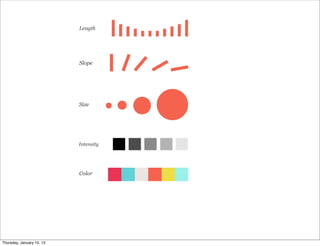
- 20. Length Slope Size Intensity Color Thursday, January 10, 13
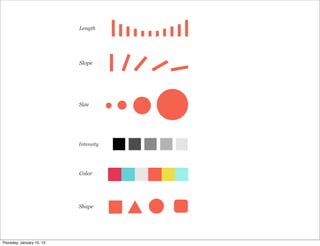
- 21. Length Slope Size Intensity Color Shape Thursday, January 10, 13
- 22. Length Slope Size Accurate Intensity Color Shape Thursday, January 10, 13
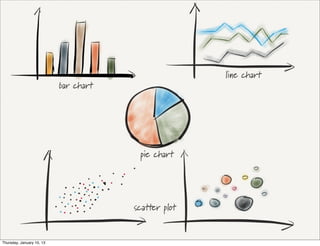
- 23. Choose the right type of display The common type of charts Thursday, January 10, 13
- 24. Thursday, January 10, 13
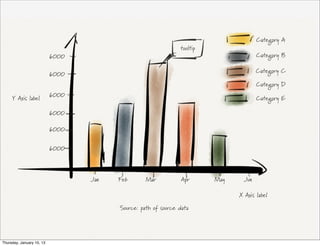
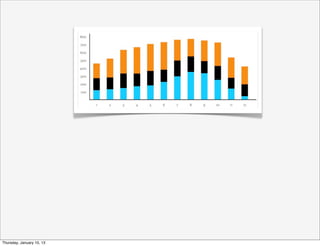
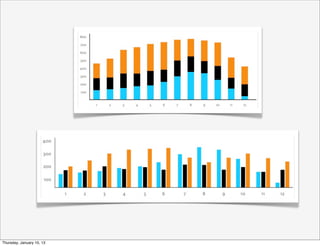
- 25. Category A tooltip 6000 Category B Category C 6000 Category D 6000 Y Axis label Category E 6000 6000 6000 Jan Feb Mar Apr May Jun X Axis label Source: path of source data Thursday, January 10, 13
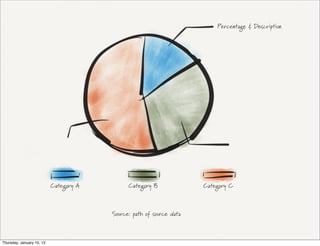
- 26. Percentage & Description Category A Category B Category C Source: path of source data Thursday, January 10, 13
- 27. Thursday, January 10, 13
- 28. Thursday, January 10, 13
- 29. Thursday, January 10, 13
- 30. Thursday, January 10, 13
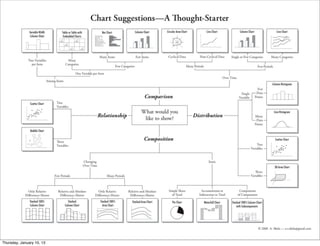
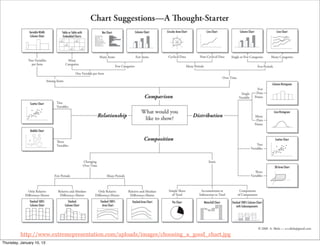
- 31. http://www.extremepresentation.com/uploads/images/choosing_a_good_chart.jpg Thursday, January 10, 13
- 32. Choose the right type of display The Uncommon type of charts Thursday, January 10, 13
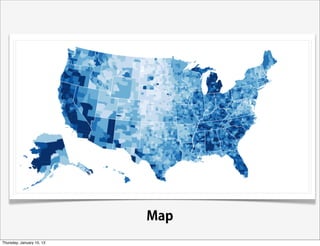
- 34. Map Thursday, January 10, 13
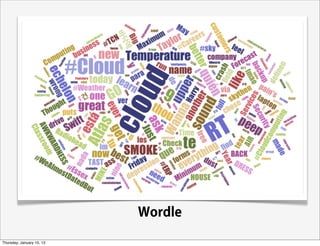
- 35. Wordle Thursday, January 10, 13
- 36. Good . Bad . Pitfall . Principles Best practices Thursday, January 10, 13
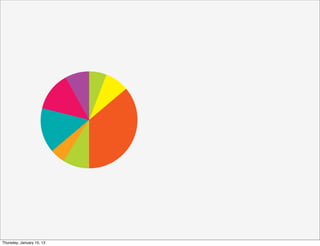
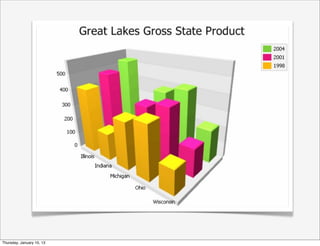
- 37. Thursday, January 10, 13
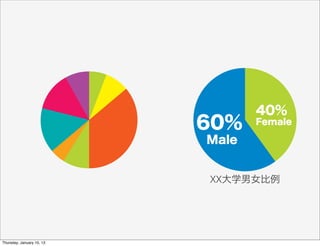
- 38. 40% 60% Female Male XX´óѧÄĞÅ®±ÈÀı Thursday, January 10, 13
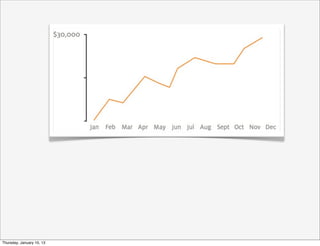
- 39. Thursday, January 10, 13
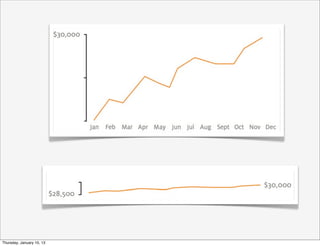
- 40. Thursday, January 10, 13
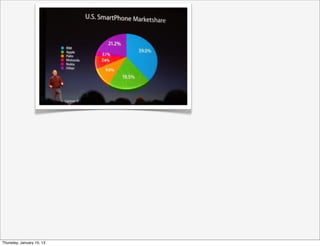
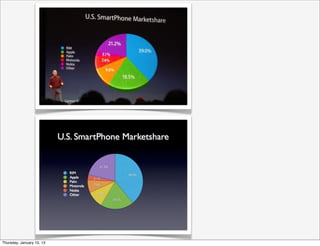
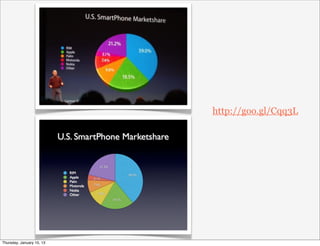
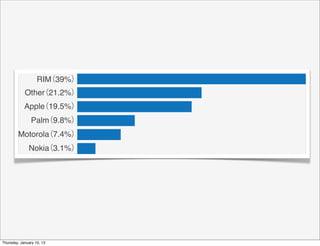
- 42. £¨39%£© RIM £¨21.2%£© Other £¨ Apple 19.5%£© £¨9.8%£© Palm £¨ Motorola 7.4%£© £¨ Nokia 3.1%£© Thursday, January 10, 13
- 43. Thursday, January 10, 13
- 44. Thursday, January 10, 13
- 45. Thursday, January 10, 13
- 46. Thursday, January 10, 13
- 47. Thursday, January 10, 13
- 48. Visualization Tools Thursday, January 10, 13
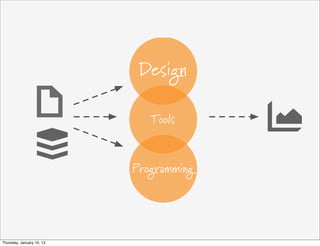
- 49. Design Tools Programming Thursday, January 10, 13
- 50. Data visualization VS Infographics Thursday, January 10, 13
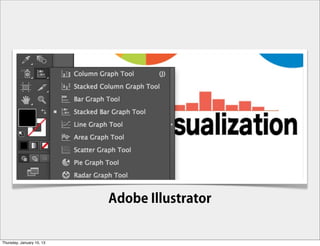
- 51. Adobe Illustrator Thursday, January 10, 13
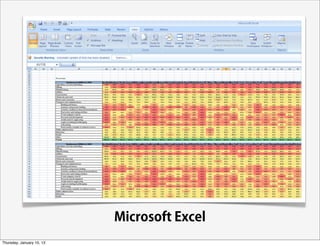
- 52. Microsoft Excel Thursday, January 10, 13
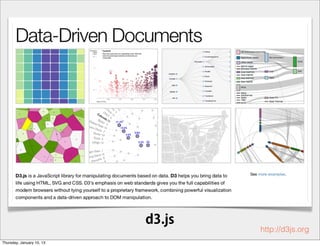
- 54. d3.js http://d3js.org Thursday, January 10, 13
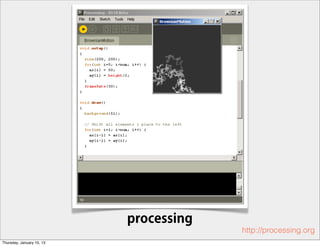
- 55. processing http://processing.org Thursday, January 10, 13
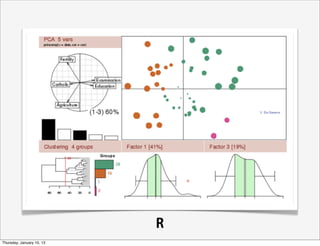
- 56. R Thursday, January 10, 13
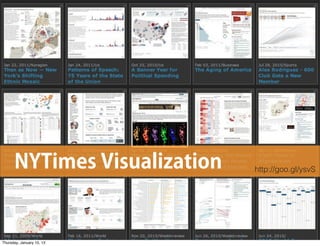
- 57. NYTimes Visualization http://goo.gl/ysvS Thursday, January 10, 13
- 58. Important Telling Stories http://goo.gl/aLv9t Thursday, January 10, 13
- 59. Thanks Next Topic: Visualization Implementation Thursday, January 10, 13
