Datayanolja 121019
0 likes103 views

лҚ°мқҙн„°м•јлҶҖмһҗ 2019м—җм„ң л°ңн‘ңн•ң лӮҙмҡ©мһ…лӢҲлӢӨ.


Datayanolja 121019
- 1. лҚ°мқҙн„° көҗмңЎ н”„лЎңлҚ•нҠё л§ӨлӢҲм Җмқҳ кі лҜјкіј мӢӨнҢЁ, м„ұмһҘ мқҙм•јкё° к№ҖмҳҒмӣ…
- 2. м ҖлҠ” м—°кө¬мһҗмқҙмһҗ кё°нҡҚмһҗмқҙл©° н”„лЎңлҚ•нҠё л§ӨлӢҲм Җмһ…лӢҲлӢӨ. кҝҲкҫёлҠ” лҚ°мқҙн„° л””мһҗмқҙл„Ҳ көҗмңЎмғқмңјлЎң мӢңмһ‘н•ҙ кё°нҡҚмһҗлЎң м„ұмһҘн–Ҳкі , мөңк·јм—җлҠ” лҚ°мһҮкұёмҰҲ лҘј кё°нҡҚн•ҳкі мҡҙмҳҒн•ҳлҠ” лҚ°мқҙн„° көҗмңЎ н”„лЎңлҚ•нҠё л§ӨлӢҲм ҖлЎң кёёмқ„ кұ·кі мһҲмҠөлӢҲлӢӨ. н”јл“ңл°ұкіј мқёнҠёлһҷм…ҳмқҳ мһҰмқҖ л°ҳліөмқ„ нҶөн•ҙ м„ұмһҘмқ„ м§Җн–Ҙн•ҳлҠ” кё°мҲ мӨ‘мӢ¬мқҳкөҗмңЎ л¬ёнҷ”лҘј кҫёлҰ¬лҠ” лҚ° лӘ© н‘ңк°Җ мһҲмҠөлӢҲлӢӨ. м—°кө¬мһҗлЎңм„ңлҠ” вҖҳл””м§Җн„ё м „нҷҳ мӢңлҢҖм—җм„ң нҢҢкҙҙм Ғ нҳҒмӢ кҙҖм җмқҳ л””м§Җн„ё м—ӯлҹү н•ҷмҠө мӢңмҠӨн…ң м„Ө кі„ л°Ҹ л°©лІ•лЎ к°ңл°ңвҖҷ м—җ лҢҖн•ң м—°кө¬мҷҖ кҙҖмӢ¬мқ„ 집мӨ‘н•ҳкі мһҲкі , лӢӨм–‘м„ұкіј м лҚ” кҙҖм җмқҳ л ҢмҰҲ лҘј кё°л°ҳмңјлЎң кё°мҲ көҗмңЎмқҳ мғҲлЎңмҡҙ м§Җм җмқ„ м°ҫкё° мң„н•ҙ нҢҖкіј к°ңмқёмңјлЎң л…ёл Ҙн•ҳкі мһҲмҠөлӢҲлӢӨ.
- 5. ліё лӮҙмҡ©мқҳ кі лҜјкіј м§Ҳл¬ё, лӢөліҖмқҖ лӢЁмІҙмҷҖ мҶҢ мҶҚмқ„ лҢҖліҖн•ҳм§Җ м•ҠлҠ” к°ңмқём Ғмқё мқҳкІ¬мһ…лӢҲ лӢӨ.
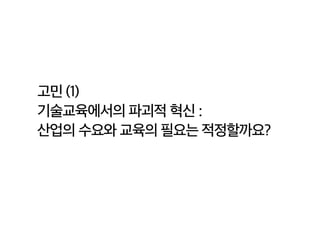
- 6. кі лҜј (1) кё°мҲ көҗмңЎм—җм„ңмқҳ нҢҢкҙҙм Ғ нҳҒмӢ : мӮ°м—…мқҳ мҲҳмҡ”мҷҖ көҗмңЎмқҳ н•„мҡ”лҠ” м Ғм •н• к№Ңмҡ”?
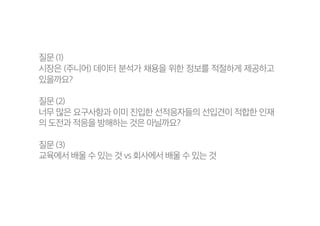
- 7. м§Ҳл¬ё (1) мӢңмһҘмқҖ (мЈјлӢҲм–ҙ) лҚ°мқҙн„° 분м„қк°Җ мұ„мҡ©мқ„ мң„н•ң м •ліҙлҘј м Ғм Ҳн•ҳкІҢ м ңкіөн•ҳкі мһҲмқ„к№Ңмҡ”? м§Ҳл¬ё (2) л„Ҳл¬ҙ л§ҺмқҖ мҡ”кө¬мӮ¬н•ӯкіј мқҙлҜё 진мһ…н•ң м„ м Ғмқ‘мһҗл“Өмқҳ м„ мһ…кІ¬мқҙ м Ғн•©н•ң мқёмһ¬ мқҳ лҸ„м „кіј м Ғмқ‘мқ„ л°©н•ҙн•ҳлҠ” кІғмқҖ м•„лӢҗк№Ңмҡ”? м§Ҳл¬ё (3) көҗмңЎм—җм„ң л°°мҡё мҲҳ мһҲлҠ” кІғ vs нҡҢмӮ¬м—җм„ң л°°мҡё мҲҳ мһҲлҠ” кІғ
- 10. кі лҜј (2) кё°мҲ көҗмңЎм—җм„ң н•ҷмҠөлӘ©н‘ңлҠ” л¬ҙм—Үмқҙ лҗҳм–ҙ м•ј н• к№Ңмҡ”?
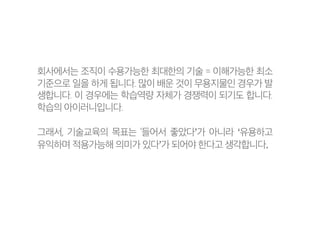
- 11. нҡҢмӮ¬м—җм„ңлҠ” мЎ°м§Ғмқҙ мҲҳмҡ©к°ҖлҠҘн•ң мөңлҢҖн•ңмқҳ кё°мҲ = мқҙн•ҙк°ҖлҠҘн•ң мөңмҶҢ кё°мӨҖмңјлЎң мқјмқ„ н•ҳкІҢ лҗ©лӢҲлӢӨ. л§Һмқҙ л°°мҡҙ кІғмқҙ л¬ҙмҡ©м§Җл¬јмқё кІҪмҡ°к°Җ л°ң мғқн•©лӢҲлӢӨ. мқҙ кІҪмҡ°м—җлҠ” н•ҷмҠөм—ӯлҹү мһҗмІҙк°Җ кІҪмҹҒл Ҙмқҙ лҗҳкё°лҸ„ н•©лӢҲлӢӨ. н•ҷмҠөмқҳ м•„мқҙлҹ¬лӢҲмһ…лӢҲлӢӨ. к·ёлһҳм„ң, кё°мҲ көҗмңЎмқҳ лӘ©н‘ңлҠ” вҖҳл“Өм–ҙм„ң мўӢм•ҳлӢӨвҖҷк°Җ м•„лӢҲлқј вҖҳмң мҡ©н•ҳкі мң мқөн•ҳл©° м Ғмҡ©к°ҖлҠҘн•ҙ мқҳлҜёк°Җ мһҲлӢӨвҖҷк°Җ лҗҳм–ҙм•ј н•ңлӢӨкі мғқк°Ғн•©лӢҲлӢӨ.
- 12. кі лҜј (3) (мЈјлӢҲм–ҙ) лҚ°мқҙн„° 분м„қк°ҖлҘј мң„н•ң мөңм ҒмқҖ л¬ҙм—Үмқјк№Ңмҡ”?
- 13. лҚ°мқҙн„° мӢңк°Ғнҷ”лҠ” 분м„қк°Җм—җкІҢ м •л§җлЎң мӨ‘мҡ”н• к№Ңмҡ”. лҚ°мқҙн„°лІ мқҙмҠӨлҠ” м •л§җлЎң мҶҢнҷҖн•ҙлҸ„ лҗҳлҠ”кұҙк°Җмҡ”. 분м„қмқ„ мһҳн•ҳкё° мң„н•ҙ нҶөкі„лҠ” м–ҙлҠҗ м •лҸ„лЎң м•Ңм•„м•ј н• к№Ңмҡ”. лЁёмӢ лҹ¬лӢқкіј л”Ҙлҹ¬лӢқмқҖ?
- 14. SQL, лҚ°мқҙн„° 분м„қ кҙҖл Ё лқјмқҙлёҢлҹ¬лҰ¬ нҷңмҡ© лҠҘл Ҙ, лҸҷлЈҢмҷҖмқҳ нҳ‘м—… л“ұ м»Өл®ӨлӢҲмјҖ мқҙм…ҳ мҠӨнӮ¬, EDA мҲҳмӨҖмқҳ лҚ°мқҙн„° мӢңк°Ғнҷ”, кё°мҙҲ нҶөкі„ м—ӯлҹүмқҙлқјкі мғқк°Ғн•©лӢҲлӢӨ. к·ё мҷёмқҳ мҠӨнӮ¬мқё лҶ’мқҖ мҲҳмӨҖмқҳ лҚ°мқҙн„° мӢңк°Ғнҷ”, лҶ’мқҖ мҲҳмӨҖмқҳ нҶөкі„ м—ӯлҹүмқҖ лҚң мӨ‘ мҡ”н•ң мҡ”мҶҢлЎң м •мқҳн•ҳкі мӢ¶мҠөлӢҲлӢӨ. кё°мҙҲ нҶөкі„ мҲҳмӨҖмқҖ нҳ„м—…м—җм„ң мЈјлЎң м“°мқҙлҠ” нҶөкі„ к°ңл…җмқ„ мӨ‘мӢ¬мңјлЎң вҖҳмӢӨн—ҳкі„нҡҚ, нҡҢк·Җ분м„қ, мғқмЎҙ분м„қ, мӢңкі„м—ҙ분м„қ, A/B н…ҢмҠӨнҠёмҷҖ нҶөкі„м Ғ к°Җм„Ө кІҖм •, мғҒкҙҖ분 м„қ л“ұвҖҷ мқҙ мһҲмҠөлӢҲлӢӨ. мқҙ к°ңл…җл“ӨмЎ°м°Ё мЎ°м§Ғмқҳ нҠ№м„ұм—җ л”°лқј нҷңмҡ©мқҳ м •лҸ„к°Җ лӢӨлҰ… лӢҲлӢӨ.
- 15. кі лҜј (4) м–ём ңк№Ңм§Җ н•ҷмҠөн•ҳкі л°°мӣҢм•ј н• к№Ңмҡ”?
- 16. лҜјк°җн•ҳкі кіӨлһҖн•ң м§Ҳл¬ёмһ…лӢҲлӢӨ. м •лӢөмқҖ м—ҶмҠөлӢҲлӢӨ. лӢӨл§Ң к°ңмқём ҒмңјлЎң лҠ” нҡҢмӮ¬м—җ мӢ мһ…мңјлЎң мһ…мӮ¬л¬ён„ұмқ„ л„ҳмқ„ м •лҸ„л©ҙ лҗҳм§Җ м•Ҡмқ„к№Ң мғқк°Ғ н•©лӢҲлӢӨ. нғҖкІҹмқ„ м„Өм •н•ҳкі м „лһөм ҒмңјлЎң м ‘к·јн•ҙм•ј н•©лӢҲлӢӨ. к·ё мӢңкё° лҘј лҜёлӨ„к°Җл©ҙм„ң л°–м—җм„ң мҳӨлһҳ кіөл¶Җн•ҳлҠ” кІғмқҖ нҳ„м—…м—җм„ңмқҳ м„ұмһҘкё°нҡҢ лҘј лҶ“м№ҳкІҢ лҗҳм–ҙ кІ°кіјм ҒмңјлЎң м„ұмһҘмқҳ нҸӯмқҙ нҒ¬м§Җ м•ҠмқҖ кІғ к°ҷмҠөлӢҲлӢӨ.
- 17. кі лҜј (5) м–ҙл–»кІҢ к°ҖлҘҙм№ҳкұ°лӮҳ н•ҷмҠөн•ҳлҠ” кІғмқҙ мўӢмқ„ к№Ңмҡ”?
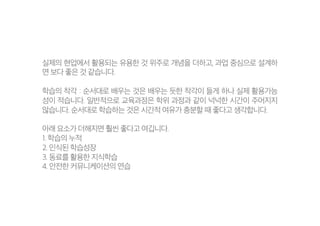
- 18. мӢӨм ңмқҳ нҳ„м—…м—җм„ң нҷңмҡ©лҗҳлҠ” мң мҡ©н•ң кІғ мң„мЈјлЎң к°ңл…җмқ„ лҚ”н•ҳкі , кіјм—… мӨ‘мӢ¬мңјлЎң м„Өкі„н•ҳ л©ҙ ліҙлӢӨ мўӢмқҖ кІғ к°ҷмҠөлӢҲлӢӨ. н•ҷмҠөмқҳ м°©к°Ғ : мҲңм„ңлҢҖлЎң л°°мҡ°лҠ” кІғмқҖ л°°мҡ°лҠ” л“Ҝн•ң м°©к°Ғмқҙ л“ӨкІҢ н•ҳлӮҳ мӢӨм ң нҷңмҡ©к°ҖлҠҘ м„ұмқҙ м ҒмҠөлӢҲлӢӨ. мқјл°ҳм ҒмңјлЎң көҗмңЎкіјм •мқҖ н•ҷмң„ кіјм •кіј к°ҷмқҙ л„үл„үн•ң мӢңк°„мқҙ мЈјм–ҙм§Җм§Җ м•ҠмҠөлӢҲлӢӨ. мҲңм„ңлҢҖлЎң н•ҷмҠөн•ҳлҠ” кІғмқҖ мӢңк°„м Ғ м—¬мң к°Җ м¶©л¶„н• л•Ң мўӢлӢӨкі мғқк°Ғн•©лӢҲлӢӨ. м•„лһҳ мҡ”мҶҢк°Җ лҚ”н•ҙм§Җл©ҙ нӣЁм”¬ мўӢлӢӨкі м—¬к№ҒлӢҲлӢӨ. 1. н•ҷмҠөмқҳ лҲ„м Ғ 2. мқёмӢқлҗң н•ҷмҠөм„ұмһҘ 3. лҸҷлЈҢлҘј нҷңмҡ©н•ң м§ҖмӢқн•ҷмҠө 4. м•Ҳм „н•ң м»Өл®ӨлӢҲмјҖмқҙм…ҳмқҳ м—°мҠө
- 19. кі лҜј (6) мҷ„лІҪн•ң нҷҳкІҪмқ„ л§Ңл“Өкі кҙҖлҰ¬н• мҲҳ мһҲмқ„к№Ң мҡ”?
- 20. мҷ„лІҪн•ң нҷҳкІҪкө¬м¶•мқҖ м–ҙл өмҠөлӢҲлӢӨ. м§ҖмҶҚм Ғмқё н”јл“ңл°ұкіј м»Ө л®ӨлӢҲмјҖмқҙм…ҳмқ„ нҶөн•ҙ м җм җ к°ңм„ лҗҳлҠ” нҷҳкІҪмқ„ л§Ңл“Өм–ҙк°Ҳ мҲҳ лҠ” мһҲмҠөлӢҲлӢӨ. к°Ҳл“ұкіј 충лҸҢмқҙ м—ҶлҠ” мҷ„лІҪн•ң көҗмңЎнҷҳкІҪмқҖ л¶Ҳк°ҖлҠҘн•©лӢҲлӢӨ. мһҗм—°мҠӨлҹ¬мҡҙ нҳ„мғҒмһ…лӢҲлӢӨ. к·ёкІғмңјлЎңл¶Җн„° л°°мҡ°кі к°Ғмһҗмқҳ көҗнӣҲмқ„ м–»лҸ„лЎқ м§Җмӣҗн•ҙм•ј н•©лӢҲлӢӨ.
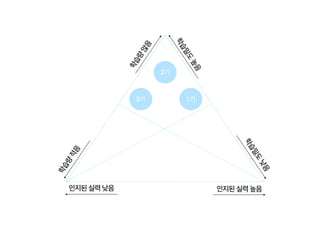
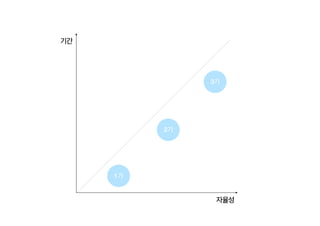
- 21. н•ҷмҠөлҹү л§ҺмқҢ н•ҷмҠөлҹү м ҒмқҢ мқём§Җлҗң мӢӨл Ҙ лҶ’мқҢмқём§Җлҗң мӢӨл Ҙ лӮ®мқҢ н•ҷмҠөл°ҖлҸ„ лҶ’мқҢ н•ҷмҠөл°ҖлҸ„ лӮ®мқҢ 1кё° 2кё° 3кё°
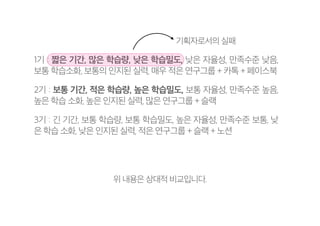
- 23. 1кё° : 짧мқҖ кё°к°„, л§ҺмқҖ н•ҷмҠөлҹү, лӮ®мқҖ н•ҷмҠөл°ҖлҸ„, лӮ®мқҖ мһҗмңЁм„ұ, л§ҢмЎұмҲҳмӨҖ лӮ®мқҢ, ліҙнҶө н•ҷмҠөмҶҢнҷ”, ліҙнҶөмқҳ мқём§Җлҗң мӢӨл Ҙ, л§Өмҡ° м ҒмқҖ м—°кө¬к·ёлЈ№ + м№ҙнҶЎ + нҺҳмқҙмҠӨл¶Ғ 2кё° : ліҙнҶө кё°к°„, м ҒмқҖ н•ҷмҠөлҹү, лҶ’мқҖ н•ҷмҠөл°ҖлҸ„, ліҙнҶө мһҗмңЁм„ұ, л§ҢмЎұмҲҳмӨҖ лҶ’мқҢ, лҶ’мқҖ н•ҷмҠө мҶҢнҷ”, лҶ’мқҖ мқём§Җлҗң мӢӨл Ҙ, л§ҺмқҖ м—°кө¬к·ёлЈ№ + мҠ¬лһҷ 3кё° : кёҙ кё°к°„, ліҙнҶө н•ҷмҠөлҹү, ліҙнҶө н•ҷмҠөл°ҖлҸ„, лҶ’мқҖ мһҗмңЁм„ұ, л§ҢмЎұмҲҳмӨҖ ліҙнҶө, лӮ® мқҖ н•ҷмҠө мҶҢнҷ”, лӮ®мқҖ мқём§Җлҗң мӢӨл Ҙ, м ҒмқҖ м—°кө¬к·ёлЈ№ + мҠ¬лһҷ + л…ём…ҳ мң„ лӮҙмҡ©мқҖ мғҒлҢҖм Ғ 비көҗмһ…лӢҲлӢӨ. кё°нҡҚмһҗлЎңм„ңмқҳ мӢӨнҢЁ
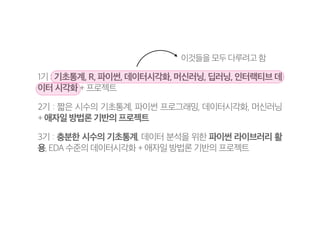
- 24. 1кё° : кё°мҙҲнҶөкі„, R, нҢҢмқҙмҚ¬, лҚ°мқҙн„°мӢңк°Ғнҷ”, лЁёмӢ лҹ¬лӢқ, л”Ҙлҹ¬лӢқ, мқён„°лһҷнӢ°лёҢ лҚ° мқҙн„° мӢңк°Ғнҷ” + н”„лЎңм қнҠё 2кё° : 짧мқҖ мӢңмҲҳмқҳ кё°мҙҲнҶөкі„, нҢҢмқҙмҚ¬ н”„лЎңк·ёлһҳл°Қ, лҚ°мқҙн„°мӢңк°Ғнҷ”, лЁёмӢ лҹ¬лӢқ + м• мһҗмқј л°©лІ•лЎ кё°л°ҳмқҳ н”„лЎңм қнҠё 3кё° : 충분н•ң мӢңмҲҳмқҳ кё°мҙҲнҶөкі„, лҚ°мқҙн„° 분м„қмқ„ мң„н•ң нҢҢмқҙмҚ¬ лқјмқҙлёҢлҹ¬лҰ¬ нҷң мҡ©, EDA мҲҳмӨҖмқҳ лҚ°мқҙн„°мӢңк°Ғнҷ” + м• мһҗмқј л°©лІ•лЎ кё°л°ҳмқҳ н”„лЎңм қнҠё мқҙкІғл“Өмқ„ лӘЁл‘җ лӢӨлЈЁл Өкі н•Ё
- 25. кІ°лЎ н•„мҡ”н• л•Ң н•„мҡ”н•ңл§ҢнҒј л°°мҡ°лҠ” кІғмқҙ мӨ‘мҡ”н•©лӢҲлӢӨ. к·ёлҹ¬кё° мң„н•ҙм„ңлҠ” н•ҷмҠөн• мҲҳ мһҲлҠ” лҠҘл Ҙ к·ё мһҗмІҙк°Җ н•„мҡ”н•©лӢҲлӢӨ. н•„мҡ” мқҙмғҒмңјлЎң л„ҳм№ҳлҠ” м •ліҙмҷҖ мЎ°м–ё мҶҚм—җм„ң лӮҙмҷҖ мЎ°м§Ғм—җм„ң м§ҖкёҲ н•„мҡ”н•ң кІғмқ„ нҢҗлӢЁн• мҲҳ мһҲлҠ” кө¬мЎ°м Ғ м„ нғқ лҠҘл Ҙмқҙ мҡ”кө¬лҗ© лӢҲлӢӨ. м „лһөм ҒмңјлЎң н•„мҡ”н•ң л§ҢнҒј н•ҷмҠөн•ҳкі лӮҳлЁём§ҖлҠ” нҷҳкІҪ мҶҚм—җм„ң мІҙл“қн•ҳлҠ” Learn- Learn by doing - Learn by stacking мқҳ лӢЁкі„к°Җ н•„мҡ”н•ҳлӢӨкі мғқк°Ғн•©лӢҲлӢӨ.
- 26. нғҗмғүм Ғ н•ҷмҠө & м „лһөм Ғ 집мӨ‘
- 27. н•„мҡ”н•ң л§ҢнҒјмқҳ л°ҳліөмқ„ нҶөн•ҙ мҢ“м•„ м—°кІ°н•ҳкі л№„л°ҳліөм Ғмқё мӢңлҸ„лҘј нҶөн•ҙ мқҙм§Ҳм ҒмңјлЎң мҳҒм—ӯмқ„ нҷ•лҢҖ
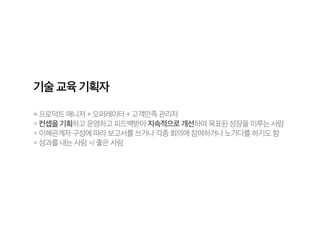
- 28. кё°мҲ көҗмңЎ кё°нҡҚмһҗ = н”„лЎңлҚ•нҠё л§ӨлӢҲм Җ + мҳӨнҚјл Ҳмқҙн„° + кі к°қл§ҢмЎұ кҙҖлҰ¬мһҗ = м»Ём…үмқ„ кё°нҡҚн•ҳкі мҡҙмҳҒн•ҳкі н”јл“ңл°ұл°ӣм•„ м§ҖмҶҚм ҒмңјлЎң к°ңм„ н•ҳм—¬ лӘ©н‘ңлҗң м„ұмһҘмқ„ мқҙлЈЁлҠ” мӮ¬лһҢ = мқҙн•ҙкҙҖкі„мһҗ кө¬м„ұм—җ л”°лқј ліҙкі м„ңлҘј м“°кұ°лӮҳ к°Ғмў… нҡҢмқҳм—җ м°ём—¬н•ҳкұ°лӮҳ л…ёк°ҖлӢӨлҘј н•ҳкё°лҸ„ н•Ё = м„ұкіјлҘј лӮҙлҠ” мӮ¬лһҢ =/ мўӢмқҖ мӮ¬лһҢ
- 30. ліҖнҷ”н•ҳлҠ” мҶҚлҸ„к°Җ көүмһҘнһҲ л№ лҰ…лӢҲлӢӨ
- 31. м–ҙм ңмқҳ н•ҙлӢөмқҙ мҳӨлҠҳмқҳ лӢөмқҙ м•„лӢҷлӢҲлӢӨ
- 32. мһ¬лҜёмһҲлҠ”кІғ < мқҳлҜёмһҲлҠ”кІғ < к°Җм№ҳмһҲлҠ”кІғ
- 34. л°ңн‘ң лҒқ
- 35. м•С«°Ё
- 37. лҚ°мқҙн„° көҗмңЎ н”„лЎңлҚ•нҠё л§ӨлӢҲм Җмқҳ кі лҜјкіј мӢӨнҢЁ, м„ұмһҘ мқҙм•јкё° youngwung.kim@gmail.com к№ҖмҳҒмӣ…
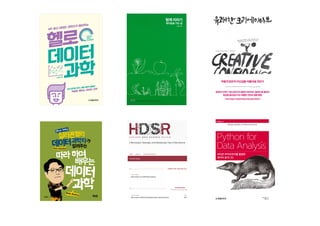
- 38. 추мІңлҸС«„ң
- 40. м°ёкі мһҗлЈҢ
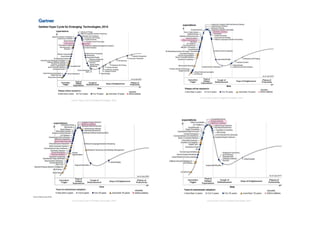
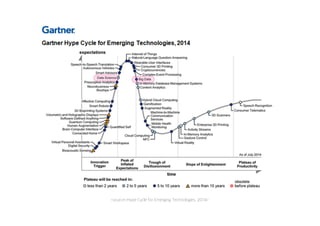
- 41. <source=Hype Cycle for Emerging Technologies, 2014>
- 42. <source=Hype Cycle for Emerging Technologies, 2015>
- 43. <source=Hype Cycle for Emerging Technologies, 2016>
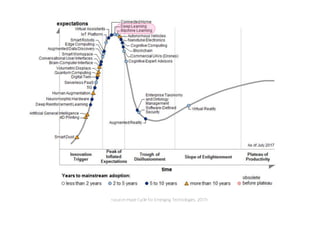
- 44. <source=Hype Cycle for Emerging Technologies, 2017>
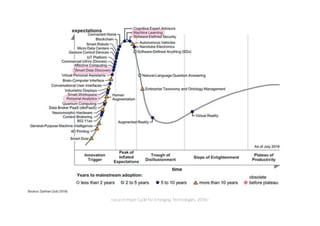
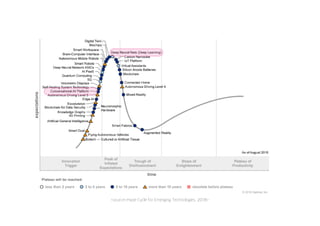
- 45. <source=Hype Cycle for Emerging Technologies, 2018>
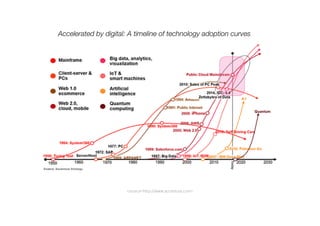
- 46. <source=http://www.accenture.com> Accelerated by digital: A timeline of technology adoption curves