CLUB DB2 µŚ137»Ų£ŗ»łµA¤«¤éŌŁČėéT£”DB2„ā„Ė„æ„ź„ó„°ČėéT
11 likes29,105 views

2011Äź2ŌĀ24ČÕ¤Ėé_“ߤ·¤æCLUB DB2 µŚ137»Ų£ŗ»łµA¤«¤éŌŁČėéT£”DB2„ā„Ė„æ„ź„ó„°ČėéT ¤ĪŁYĮĻ¤Ē¤¹”£ ¤½¤ĪĖū¤ĪŁYĮĻ¤ĻĻĀÓURL¤«¤é„Ą„¦„ó„ķ©`„ÉæÉÄܤĒ¤¹”£ http://www.ibm.com/developerworks/wikis/display/clubdb2/materials
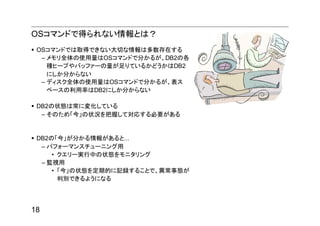
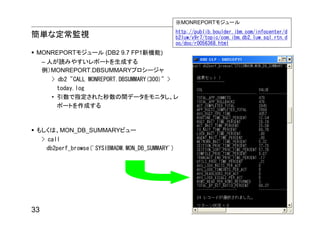
![ÖŲŅŖ„³„Ž„ó„É£ŗ±¹³¾²õ³Ł²¹³Ł vmstat [delay [count]]
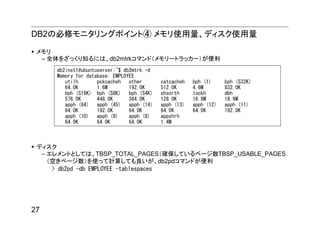
vmstat¤Ļ¶ą¤Æ¤ĪLinux”¢Unix¤ĒĄūÓĆæÉÄܤŹ„³„Ž„ó„ɤĒ”¢¶ą²Ź¤ŹÄŚ²æ„Ē©`„æ¤ņ³öĮ¦¤Ē¤¤ė
vmstat¤Ī³öĮ¦¤Ē„Į„§„Ć„Æ¤¹¤Ł¤„Ż„¤„ó„Č
ØC r¤Ļ“ż¤Į„ׄķ„»„¹Źż £ŗ“ż¤Į¤¬¶ą¤¤öŗĻ¤Ļ”¢¤½¤ā¤½¤āCPU„Ń„ļ©`²»×ć¤ņŅɤ¦
ØC b¤Ļ„¦„§„¤„Ȥ·¤Ę¤¤¤ė£Ø„Ö„ķ„Ć„Æ¤µ¤ģ¤æ£©„ׄķ„»„¹Źż£ØI/O„¦„§„¤„Č£©
? I/O„¦„§„¤„Ȥņp¤é¤¹¤Ė¤Ļ”¢DB2ȤĪøÄÉʤ¬±ŲŅŖ
ØC swap in(si)¤Čswap out (so)¤Ļ„¼„ķ¾S³Ö¤¬Ōt
ØC block-in (bi) „Ē„£„¹„Ƥ«¤é¤ĪÕi¤ßČ”¤źŹż
? ßW¤¤„Æ„Ø„ź©`¤ņgŠŠ¤·¤æ¤Č¤”¢bi¤¬¤Ø¤Ź¤¤£æ?IO„¦„§„¤„ČŅŌĶā¤ĪŅŖŅņ
? ßW¤¤„Æ„Ø„ź©`£ØSELECT£©¤ņgŠŠ¤·¤æ¤Č¤”¢bo¤¬¤Ø¤ė£æ?„Ņ©`„ׄŖ©`„Š©`„Õ„ķ©`
ØC cpu¤Īus¤Ļ„ę©`„¶„ׄķ„»„¹¤ĪŹ¹ÓĆĀŹ”¢sy¤Ļ„·„¹„Ę„ą¤ĪŹ¹ÓĆĀŹ
? “ż¤Į(r)¤¬ÉŁ¤Ź¤Æ”¢„ę©`„¶„ׄķ„»„¹(us)¤¬¶ą¤¤¤Ī¤¬¤č¤Æ„Į„å©`„Ė„ó„°¤µ¤ģ¤æדr
? ¾Ž“󤏄Ē©`„æ„¢„Æ„»„¹¤¬¤¢¤ėöŗĻ”¢„·„¹„Ę„ą(sy)¤¬¤Ø¤ė¤Ī¤Ļ×ŌČ»
db2inst1@ubuntuserver:~$ vmstat 1 100
procs -----------memory---------- ---swap-- -----io---- -system-- ----cpu----
r b swpd free buff cache si so bi bo in cs us sy id wa
1 0 0 17548 35640 298480 0 0 1664 0 7377 15332 35 19 45 0
2 0 0 17020 35648 298472 0 0 1408 16 4165 23101 35 22 44 0
2 0 0 17176 35648 298480 0 0 1916 0 8029 15943 38 16 46 3
12](https://image.slidesharecdn.com/db2-120226090020-phpapp01/85/CLUB-DB2-137-DB2-12-320.jpg)
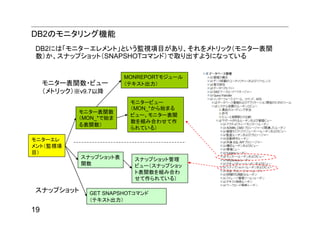
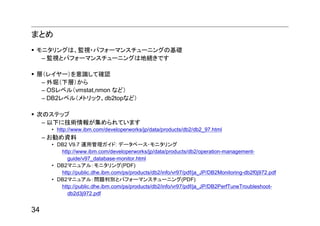
![DB2¤Ī±ŲŠŽ„ā„Ė„æ„ź„ó„°„Ż„¤„ó„Č¢Ł „Š„Ć„Õ„”©`„ש`„ė¤Ī„Ņ„Ć„ČĀŹ
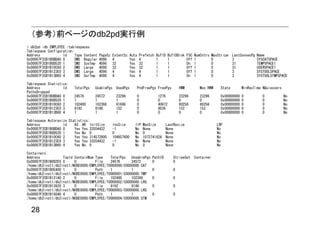
„Š„Ć„Õ„”©`„ש`„ė(BP)¤Ļ”¢„Ē©`„æ¤Ī„„ć„Ć„·„åīIÓņ „Ø©`„ø„§„ó„Č
ØC „Ē©`„æ„Ł©`„¹¤Ē×ī¤āßW¤¤„Ń©`„ĤĻ”ø„Ē„£„¹„Æ”¹
ØC „„ć„Ć„·„å¤Ļ¤¢¤ė¤¬„µ„¤„ŗ¤ĖĻŽ¶Č¤¬¤¢¤ė
”śBP „Ņ„Ć„ČĀŹĻņÉĻ¤Ļ„Ń„Õ„©©`„Ž„ó„¹ĻņÉĻ¤ĪęI
IO„µ©` „Ś©`„ø?
BP„Ņ„Ć„ČĀŹ£½„Š„Ć„Õ„”©`„ש`„ė¤ņÕi¤ßų¤¤·¤æŹż/Č«Ģå „Š©` „Æ„ź©`„Ź©`
¤ĪIO„ź„Æ„Ø„¹„ȤĪŹż * 100 [%]
„Ø„ģ„į„ó„ȤĒÓĖć¤¹¤ė¤Ė¤ĻŅŌĻĀ¤Ī2¤Ä¤ņŹ¹ÓƤ·¤Ę..
ØC POOL_DATA_L_READS : ÕĄķÕi¤ßČ”¤źŹż ±ķ„¹„Ś©`„¹
ØC POOL_DATA_P_READS : ĪļĄķÕi¤ßČ”¤źŹż
„³„ó„Ę„Ź „³„ó„Ę„Ź
SELECT 100.0*(POOL_DATA_L_READS - POOL_DATA_P_READS) / POOL_DATA_L_READS FROM
TABLE (MON_GET_BUFFERPOOL('IBMDEFAULTBP',null)) AS T
¤ā¤·¤Æ¤Ļ”¢ÓƤĪ„Ó„å©`¤ņŹ¹ÓĆ£Ø”ł¤³¤Į¤é¤Ļ„¹„Ź„Ƅׄ·„ē„Ć„Č„Ē©`„æ¤Ź¤Ī¤Ē×¢Ņā£©
SELECT BP_NAME,DATA_HIT_RATIO_PERCENT,INDEX_HIT_RATIO_PERCENT FROM
SYSIBMADM.BP_HITRATIO
23](https://image.slidesharecdn.com/db2-120226090020-phpapp01/85/CLUB-DB2-137-DB2-23-320.jpg)
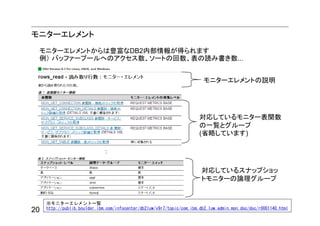
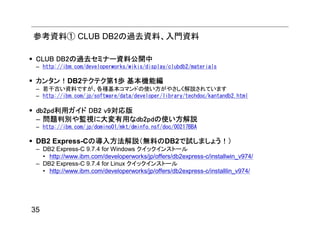
![»å²ś2³Ł“Ē±č¤ņŹ¹¤¦¢ŚźÓƱą „į„æ„„ć„é„Æ„æ ŅāĪ¶
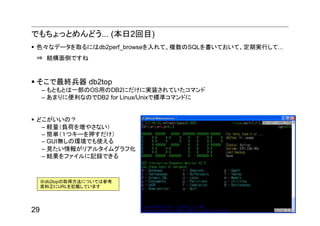
^ ŠŠ¤ĪĻČī^¤Ė„Ž„Ć„Į¤¹¤ė
Ņ¤æ¤¤Ēéó¤ņ½g¤źŽz¤ą $ ŠŠ¤Ī×īįį¤Ė„Ž„Ć„Į¤¹¤ė
ØC /(„¹„é„Ć„·„å)¤ņŃŗ¤¹¤Č”¢ÕżŅ±ķ¬F¤Ē½g¤źŽz¤ß¤¬ | („Ń„¤„×) ×óÓŅ¤É¤Į¤é¤«¤ĪÕżŅ±ķ¬F¤Ė„Ž„Ć„Į¤¹¤ė
æÉÄÜ . £Ø„Ō„ź„Ŗ„É£© ČĪŅā¤ĪĪÄ×ÖŅ»ĪÄ×Ö¤Ė„Ž„Ć„Į¤¹¤ė
? Ąż) /EMP[0-9] ”ś EMP0,EMP1... EMP9 + Ö±Ē°¤ĪĪÄ×Ö¤Ī1ĪÄ×ÖŅŌÉĻ¤ĪßB¾A
¤Ė„Ž„Ć„Į * („¢„¹„æ„ź„¹„Æ) Ö±Ē°¤ĪĪÄ×Ö¤Ī0ĪÄ×ÖŅŌÉĻ¤ĪßB¾A
? Ö±Ē°¤ĪĪÄ×Ö¤Ī0ĪÄ×Ö¤Ž¤æ¤Ļ1ĪÄ×Ö¤ĪßB¾A
ØC z ¤ĒÖø¶ØĮŠ¤Ē¤Ī½µķ„½©`„Č(Z¤ĒNķ) ? „Ø„¹„±©`„×ĪÄ×Ö
ØC c ¤Ē±ķŹ¾¤¹¤ėĮŠ¤ņÖø¶ØæÉÄÜ () ĪÄ×ÖĮŠ¤ņŅ»K¤ĒQ¤¦
[] „ź„¹„ČÄŚ¤Ī¤¤¤ŗ¤ģ¤«¤ĪĪÄ×Ö¤Ė„Ž„Ć„Į¤¹¤ė
SQL¤ĪŌ¼¤ņµĆ¤ė¤Ė¤Ļ
ØC ø÷SQL¤Ė¤Ļ„Ļ„Ć„·„å»Æ¤µ¤ģ¤æ¤¬ø¶¤¤¤Ę¤¤¤ė¤Ī¤Ē”¢L¤ņŃŗ¤·¤æįį¤ĖČėĮ¦¤¹¤ė¤ČŌ¼¤¬·Ö¤«¤ė
? e¤ĒExplain(gŠŠÓ»)¤ā“_ÕJæÉÄÜ
31](https://image.slidesharecdn.com/db2-120226090020-phpapp01/85/CLUB-DB2-137-DB2-31-320.jpg)
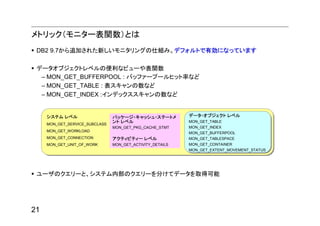
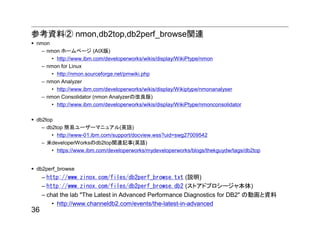
![db2top¤ņŹ¹¤¦¢Ū Óåh¤ČÕ{Ė?óøęÓĆ
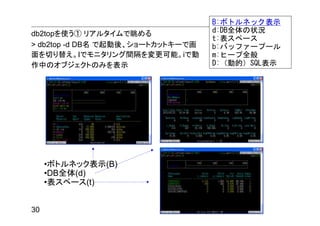
„Õ„”„¤„ė¤ĖŌ¼¤ņÓåh¤¹¤ė
ØC S¤ņŃŗ¤¹¤Č”¢SNAPSHOT„³„Ž„ó„ÉgŠŠ¤µ¤ģ¤ė
? vi¤Ē±ķŹ¾¤µ¤ģ¤ė¤Ī¤Ē :w „Õ„”„¤„ėĆū ¤Ē±£“ę
ØC db2topĘšÓr¤Ė”¢ -b¤ņÖø¶Ø¤·¤Ę„Š„Ć„Æ„°„鄦„ó„É„ā©`„ɤĒĘšÓ
? „Ē©`„æ„Ł©`„¹(-d)”¢Č”µĆégøō[Ćė]£Ø-i£©”¢Č”µĆĘŚég[·Ö]£Ø-m£©¤¢¤ė¤¤¤ĻČ”µĆ»ŲŹż£Ø-s£©¤ņÖø¶Ø
? Ąż£© > db2top -d EMPLOYEE -b d -i 1 -m 10 > db2top.csv
(-b¤Īįį¤Ī„Ŗ„ׄ·„ē„ó¤ĪŅāĪ¶)
-b : background mode
option: d=database, l=sessions, t=tablespaces, b=bufferpools,
T=tables, D=Dynamic SQL, s=Statements, U=Locks, u=Utilities,
F=Federation, m=Memory
32](https://image.slidesharecdn.com/db2-120226090020-phpapp01/85/CLUB-DB2-137-DB2-32-320.jpg)


![[Postgre sql9.4ŠĀCÄÜ]„ģ„ׄź„±©`„·„ē„ó?„¹„ķ„ƄȤĪ»īÓĆ](https://cdn.slidesharecdn.com/ss_thumbnails/postgresql9-140909012453-phpapp01-thumbnail.jpg?width=560&fit=bounds)


More Related Content
What's hot (20)
Viewers also liked (7)


Similar to CLUB DB2 µŚ137»Ų£ŗ»łµA¤«¤éŌŁČėéT£”DB2„ā„Ė„æ„ź„ó„°ČėéT (20)


CLUB DB2 µŚ137»Ų£ŗ»łµA¤«¤éŌŁČėéT£”DB2„ā„Ė„æ„ź„ó„°ČėéT
- 1. CLUB DB2 #137 CLUB DB2 µŚ137»Ų DB2„ā„Ė„æ„ź„ó„°ČėéT 2012/2/24 ČÕ±¾„¢„¤?„Ó©`?„Ø„ą ĻĀ×ō·Ū ÕŃ (¤·¤ā¤µ¤³ ¤¢¤¤é) rev. 1.1 ¤³¤ĪŁYĮĻ¤ĻĻĀÓURL¤Ē„Ą„¦„ó„ķ©`„ÉæÉÄܤĒ¤¹ http://ibm.com/developerworks/wikis/display/clubdb2/materials
- 2. ×Ō¼ŗ½B½é ĻĀ×ō·Ū ÕŃ ( ¤·¤ā¤µ¤³ ¤¢¤¤é ) ŗĶøčɽ±hÉś¤Ž¤ģ 2001Äź IBM¤ĖÖŠĶ¾ČėÉē ŅŌĄ“”¢DB2évßB¤ĪŹĖŹĀ¶ą¤· ¬FŌŚ¤Ļ„Ó„ø„Ķ„¹„Ń©`„Č„Ź©`Ļņ¤±¼¼ŠgÖ§Ō® ”öų¼® ”ø¼“éĮ¦¤ĪDB2¹ÜĄķŠg”¹ ”øXML-DBé_°k g¼¼„³©`„¹”¹£Ø¹²Öų£© ”øDB2 ÄęŅż¤„ź„Õ„”„ģ„ó„¹”¹£Ø¹²Öų) ”ö„Ŗ„ó„鄤„ó Twitter - @simosako ØC http://twitter.com/simosako ÄŚČŻ¤ĻČ«¤ĘWEB¤Ē¹«é_¤·¤Ę¤¤¤Ž¤¹£” Unofficial DB2 Blog ØC http://db2.jugem.cc/ http://db2watch.com/ 2
- 3. ½ńČÕ¤ĪÄæµÄ „ā„Ė„æ„ź„󄰤ƤĘėy¤·¤½¤¦£æ ØC „ā„Ė„æ„ź„ó„°¤Ļ¤½¤ģ¤Ū¤Éėy¤·¤Æ¤¢¤ź¤Ž¤»¤ó ØC “óĒŠ¤Ź¤Ī¤Ļ¶ØĘŚµÄ¤Ė„ā„Ė„æ„ź„ó„°¤·”¢„Ē©`„æ¤ņ±£“ꤷ¤Ę¤Ŗ¤Æ¤³¤Č ØC „Ē©`„æ¤ņ³Ö¤Ć¤Ę¤¤¤Ź¤¤¤Č”¢„Č„é„Ö„ė¤¬Ęš¤³¤Ć¤ær¤Ė“óä ”¾½ńČÕ¤ĪÄæµÄ”æ„ā„Ė„æ„ź„ó„°¤¬±ŲŅŖ¤ŹĄķÓɤȔ¢¤½¤Īŗ g¤Ź·½·Ø¤ņ¾ßĢåµÄ¤ĖÖŖ¤ė£” ”¾Šū»”æ»łµA¤«¤éŌ¤·¤ÆѧĮ¤·¤æ¤¤·½¤Ļ”¢¤¼¤Ņ×ŌÖų¤ņ¤“²ĪÕդƤĄ¤µ¤¤£” ¼“éĮ¦¤ĪDB2¹ÜĄķŠg”«ŹĖ½M¤ß¤«¤é¤ļ¤«¤ėæĀŹµÄ¹ÜĄķ¤Ī„Ī„¦„Ļ„¦ 2011Äź4ŌĀ8ČÕ°kÓ £Ø¼¼ŠgŌuÕÉē£© ĻĀ×ō·ŪÕŃ Öų A5ÅŠ£Æ432„Ś©`„ø ISBN 978-4-7741-4597-6 http://db2.jugem.cc/?eid=2341 £Øų¼®½B½é£© 3
- 4. Äæ“Ī „ā„Ė„æ„ź„ó„°¤Ī漤ط½ OS„ģ„Ł„ė¤Ē¤Ī„ā„Ė„æ„ź„ó„° ØC »ł±¾µÄ¤Ź„³„Ž„ó„É ØC OS„ā„Ė„æ„ź„ó„°¤Ī±ćĄū„Ä©`„ė (nmon) ØC Windows¤Ī±ćĄū„Ä©`„ė£ŗ”ø„Ń„Õ„©©`„Ž„ó„¹”¹ DB2¤Ī„ā„Ė„æ„ź„ó„° ØC „¹„Ź„Ƅׄ·„ē„ƄȤȄį„Č„ź„Ć„Æ„¹ ØC DB2¤Ī±ŲŠŽ„ā„Ė„æ„ź„ó„°„Ż„¤„ó„Č ØC DB2„ā„Ė„æ„ź„ó„°¤Ī±ćĄū„Ä©`„ė (db2top) ØC ŗ g¤Ź¶Ø³£±OŅ ¤Ž¤Č¤į 4
- 6. „ā„Ė„æ„ź„ó„°¤Ļ”¢¤Ź¤ó¤Ī¤æ¤į£æ „ā„Ė„æ„ź„ó„°£½„Ē©`„æ¤Ī §¼Æ ØC„·„¹„Ę„ąÄŚ²æ¤Ī„Ē©`„æ¤ņ §¼Æ¤¹¤ė¤³¤Č ? „Ē„£„¹„ÆIOĖŁ¶Č”¢„Ķ„Ć„Č„ļ©`„Æ„Ø„é©`ĀŹ”¢„į„ā„ź Ź¹ÓĆĀŹ ... ¤Ź¤ó¤Ī¤æ¤į£æ ØCéLĘŚµÄ¤Ź¤ā¤Ī”ś±OŅ ? éLĘŚµÄ¤Ė„Ē©`„æ¤ņÓåh£ŗ¶Ø³£±OŅ ØC¶ĢĘŚµÄ¤Ź¤ā¤Ī”ś„Ń„Õ„©©`„Ž„ó„¹?„Į„å©`„Ė„ó„° ? „ź„¢„ė„愤„ą¤Ī„ā„Ė„æ„ź„ó„° ? „Æ„Ø„ź©`¤ņgŠŠ¤·¤Ź¤¬¤é”øĢ÷¤į¤ė”¹¤³¤Č¤¬ÖŲŅŖ „ā„Ė„æ„ź„ó„°¤Ī·½·Ø¤ņÖŖ¤ė¤Č”¢Ņ»¤IµĆ£” 6
- 7. ¶Ø³£¼ąŹÓ¤Ļ¤Ź¤¼±ŲŅŖ£æ Õż³£¤Ź×“B¤Ī„Ē©`„æ¤Ļ ¾@¾AµÄ¤ĖÓåh¤·¾A¤±¤ė¤³¤Č¤Ē”¢ „Ń„Õ„©©`„Ž„󄹄Į„å©`„Ė„ó„° „·„¹„Ę„ą¤ĖĘš¤³¤Ć¤Ę¤¤¤ėä»Æ¤¬ ¤Ė¤ā“óäÓŠÓƤĒ¤¹ °ŃĪÕ³öĄ“¤ė¤č¤¦¤Ė¤Ź¤ź¤Ž¤¹”£ rég 7
- 8. ”ø²ć£Ø„ģ„¤„ä©`£©”¹¤ņŅāŹ¶¤¹¤ė ?„Į„å©`„Ė„ó„°¤ā±OŅ¤ā”¢Ó¤ņŅā×R¤¹¤ė¤³¤Č¤¬“óĒŠ¤Ē¤¹ ?¤¢¤ėÓ¤ņäøü¤¹¤ė¤Č”¢ÉĻ¤ĪÓ¤ĖÓ°ķ¤¬¤¢¤ź¤Ž¤¹ ?Õ{Ė¤ĻĶāÜ„¤«¤é DB2¤ĪÄŚ²æדB DB2¤ĪŌO¶Ø OS¤ĪŌO¶Ø „Ļ©`„É„¦„§„¢³É 8
- 9. „ā„Ė„æ„ź„ó„°¤Ī„Ż„¤„ó„Č ?NIC , CPUŹ¹ÓĆĀŹ , „į„ā„źŹ¹ÓĆĀŹ, „ׄķ„»„¹¤ĪĖĄ»ī±OŅ , „Ē„£„¹„ÆŹ¹ÓĆĮæ ”ū OS„³„Ž„ó„É ?DB2ÄŚ²æĒéó£Ø„Š„Ć„Õ„”©`„ש`„ė”¢„½©`„Črég ...£©,DB2¤Ī±ķ„¹„Ś©`„¹ ”ū DB2¤Ī„³„Ž„ó„É DB2„µ©`„Š©` DB2évßB„ׄķ„» ?„Š„Ć„Õ„”©`„ש`„ė„Ņ„Ć„ČĀŹ „¹¤ĪĖĄ»ī±OŅ ?„Ē„Ć„É„ķ„Ć„ÆŹż DB2ÄŚ²æ¤ĪÓ DB2 DB2 ?„½©`„Črég „Ķ„Ć„Č„ļ©`„ÆÆE DB2 ×÷Ēéó ?„Č„é„󄶄Ƅ·„ē„óŹż ĶØ”¢„Ø„é©`ĀŹ £ŗ NIC CPU CPU¤ä„į„ā„ź Ź¹ÓĆĀŹ „į„ā„ź „¹„Č„ģ©`„øČ«Ģå¤ĪŹ¹ÓĆĀŹ OS¤Ī„ķ„° „Ø„é©`Ēéó DB2¤Ī±ķ„¹ DB2±ķ„¹„Ś©`„¹¤Ī „Ś©`„¹ DB2¤ĪŌ\¶Ļ„ķ„° „Ø„é©`Ēéó Ź¹ÓĆĀŹ 9
- 11. °æ³§„³„Ž„ó„ɤĒ¤Ī„ā„Ė„æ„ź„󄰣ص÷Ė£© CPU¤ĪŹ¹ÓĆדr¤Ļ£æ ØC Linux/Unix: ps , vmstat ØC Windows: „愹„Æ„Ž„Ķ©`„ø„ć „į„ā„ź×“r¤Ļ£æ ØC Linux/Unix: vmstat , free ØC Windows : „愹„Æ„Ž„Ķ©`„ø„ć „Ē„£„¹„Æ„¢„Æ„»„¹,„Ē„£„¹„ƲŠĮæ¤Ļ£æ ØC Linux/Unix: vmstat , iostat , df ØC Windows: „Ń„Õ„©©`„Ž„󄹄ā„Ė„æ©` „Ķ„Ć„Č„ļ©`„ƤĻ¤É¤¦¤«£æ ØC ping £ØÉś¤¤Ę¤¤¤ė¤«“_ÕJ£© OS¤Ī„ķ„°¤ņÕi¤ą£ØÕĻŗ¦°kÉśr¤Ļ×īÖŲŅŖ£”£© ØC Linux/Unix : syslog , errpt(AIX) , /var/log/messages ¤Ź¤É ØC Windows: „¤„Ł„ó„Č„Ó„å©`„¢ 11
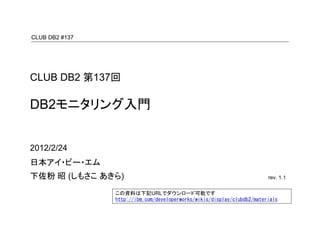
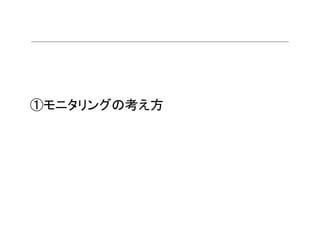
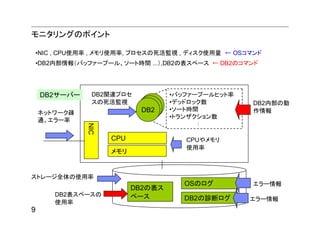
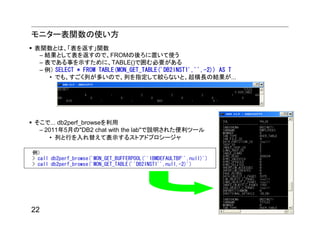
- 12. ÖŲŅŖ„³„Ž„ó„É£ŗ±¹³¾²õ³Ł²¹³Ł vmstat [delay [count]] vmstat¤Ļ¶ą¤Æ¤ĪLinux”¢Unix¤ĒĄūÓĆæÉÄܤŹ„³„Ž„ó„ɤĒ”¢¶ą²Ź¤ŹÄŚ²æ„Ē©`„æ¤ņ³öĮ¦¤Ē¤¤ė vmstat¤Ī³öĮ¦¤Ē„Į„§„Ć„Æ¤¹¤Ł¤„Ż„¤„ó„Č ØC r¤Ļ“ż¤Į„ׄķ„»„¹Źż £ŗ“ż¤Į¤¬¶ą¤¤öŗĻ¤Ļ”¢¤½¤ā¤½¤āCPU„Ń„ļ©`²»×ć¤ņŅɤ¦ ØC b¤Ļ„¦„§„¤„Ȥ·¤Ę¤¤¤ė£Ø„Ö„ķ„Ć„Æ¤µ¤ģ¤æ£©„ׄķ„»„¹Źż£ØI/O„¦„§„¤„Č£© ? I/O„¦„§„¤„Ȥņp¤é¤¹¤Ė¤Ļ”¢DB2ȤĪøÄÉʤ¬±ŲŅŖ ØC swap in(si)¤Čswap out (so)¤Ļ„¼„ķ¾S³Ö¤¬Ōt ØC block-in (bi) „Ē„£„¹„Ƥ«¤é¤ĪÕi¤ßČ”¤źŹż ? ßW¤¤„Æ„Ø„ź©`¤ņgŠŠ¤·¤æ¤Č¤”¢bi¤¬¤Ø¤Ź¤¤£æ?IO„¦„§„¤„ČŅŌĶā¤ĪŅŖŅņ ? ßW¤¤„Æ„Ø„ź©`£ØSELECT£©¤ņgŠŠ¤·¤æ¤Č¤”¢bo¤¬¤Ø¤ė£æ?„Ņ©`„ׄŖ©`„Š©`„Õ„ķ©` ØC cpu¤Īus¤Ļ„ę©`„¶„ׄķ„»„¹¤ĪŹ¹ÓĆĀŹ”¢sy¤Ļ„·„¹„Ę„ą¤ĪŹ¹ÓĆĀŹ ? “ż¤Į(r)¤¬ÉŁ¤Ź¤Æ”¢„ę©`„¶„ׄķ„»„¹(us)¤¬¶ą¤¤¤Ī¤¬¤č¤Æ„Į„å©`„Ė„ó„°¤µ¤ģ¤æדr ? ¾Ž“󤏄Ē©`„æ„¢„Æ„»„¹¤¬¤¢¤ėöŗĻ”¢„·„¹„Ę„ą(sy)¤¬¤Ø¤ė¤Ī¤Ļ×ŌČ» db2inst1@ubuntuserver:~$ vmstat 1 100 procs -----------memory---------- ---swap-- -----io---- -system-- ----cpu---- r b swpd free buff cache si so bi bo in cs us sy id wa 1 0 0 17548 35640 298480 0 0 1664 0 7377 15332 35 19 45 0 2 0 0 17020 35648 298472 0 0 1408 16 4165 23101 35 22 44 0 2 0 0 17176 35648 298480 0 0 1916 0 8029 15943 38 16 46 3 12
- 13. ¤Ē¤ā¤Į¤ē¤Ć¤ČĆęµ¹... É«”©¤Ź„Ē©`„æ¤ņČ”¤ė¤Ė¤ĻŃ}Źż¤Ī„³„Ž„ó„ɤņKŠŠgŠŠ¤·¤Ę”¢ tail -f ¤ĒŃ}Źż¤Ī„ķ„°¤ņŅ¤Ę... ? ½YĆęµ¹¤Ē¤¹¤Ķ ¤½¤³¤Ē×ī½K±ųĘ÷ nmon ØC ¤ā¤Č¤ā¤Č¤ĻIBMÉēÄŚ¤ĪÓŠÖ¾é_°kÕߤ¬×÷¤Ć¤æAIXÓƤĪ±ćĄū„³„Ž„ó„É”£įį¤ĖLinux¤Ė¤āŅĘÖ² ØC ¤¢¤Ž¤ź¤Ė±ćĄū¤Ź¤Ī¤Ē”¢AIX¤Ē¤ĻOSĖŹĢķø¶¤Ė ¤É¤³¤¬¤¤¤¤¤Ī£æ ØC ŻXĮæ£ØŲŗɤņ¤ä¤µ¤Ź¤¤£© ØC ŗ g£Ø£±¤Ä„©`¤ņŃŗ¤¹¤Ą¤±£© ØC GUIo¤·¤Īh¾³¤Ē¤āŹ¹¤Ø¤ė ØC Ņ¤æ¤¤Ēé󤬄ź„¢„ė„愤„ą„°„é„Õ»Æ ØC ½Y¹ū¤ņ„Õ„”„¤„ė¤ĖÓåh¤Ē¤¤ė ”łnmon¤ĪČ”µĆ·½·Ø¤Ė¤Ä¤¤¤Ę¤Ļ²Īæ¼ŁY ĮĻ¢Ś¤ĖURL¤ņÓŻd¤·¤Ę¤¤¤Ž¤¹ 13
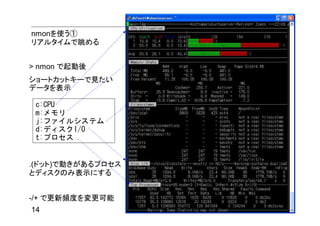
- 14. nmon¤ņŹ¹¤¦¢Ł „ź„¢„ė„愤„ą¤ĒĢ÷¤į¤ė > nmon ¤ĒĘšÓįį „·„ē©`„Č„«„Ć„Č„©`¤ĒŅ¤æ¤¤ „Ē©`„æ¤ņ±ķŹ¾ c:CPU m:„į„ā„ź j:„Õ„”„¤„ė„·„¹„Ę„ą d:„Ē„£„¹„ÆI/O t:„ׄķ„»„¹ .(„É„Ć„Č)¤ĒÓ¤¤¬¤¢¤ė„ׄķ„»„¹ ¤Č„Ē„£„¹„ƤĪ¤ß±ķŹ¾¤Ė¤¹¤ė -/+ ¤ĒøüŠĀīl¶Č¤ņäøüæÉÄÜ 14
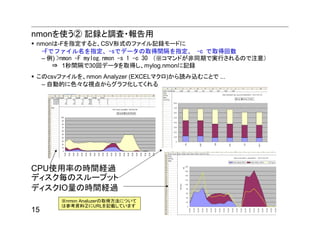
- 15. nmon¤ņŹ¹¤¦¢Ś Óåh¤ČÕ{Ė?óøęÓĆ nmon¤Ļ-F¤ņÖø¶Ø¤¹¤ė¤Č”¢CSVŠĪŹ½¤Ī„Õ„”„¤„ėÓåh„ā©`„ɤĖ -F¤Ē„Õ„”„¤„ėĆū¤ņÖø¶Ø”¢-s¤Ē„Ē©`„æ¤ĪČ”µĆégøō¤ņÖø¶Ø”¢ -c ¤ĒČ”µĆ»ŲŹż ØC Ąż) >nmon -F mylog.nmon -s 1 -c 30 £Ø”ł„³„Ž„ó„ɤ¬·ĒĶ¬ĘŚ¤ĒgŠŠ¤µ¤ģ¤ė¤Ī¤Ē×¢Ņā£© ? 1Ćėégøō¤Ē30»Ų„Ē©`„æ¤ņČ”µĆ¤·”¢mylog.nmon¤ĖÓåh ¤³¤Īcsv„Õ„”„¤„ė¤ņ”¢nmon Analyzer (EXCEL„Ž„Æ„ķ)¤«¤éÕi¤ßŽz¤ą¤³¤Č¤Ē ... ØC ×ŌӵĤĖÉ«”©¤ŹŅµć¤«¤é„°„é„ջƤ·¤Ę¤Æ¤ģ¤ė CPUŹ¹ÓĆĀŹ¤Īrég½Uß^ „Ē„£„¹„Æ°¤Ī„¹„ė©`„×„Ć„Č „Ē„£„¹„ÆIOĮæ¤Īrég½Uß^ ”łnmon Analuzer¤ĪČ”µĆ·½·Ø¤Ė¤Ä¤¤¤Ę ¤Ļ²Īæ¼ŁYĮĻ¢Ś¤ĖURL¤ņÓŻd¤·¤Ę¤¤¤Ž¤¹ 15
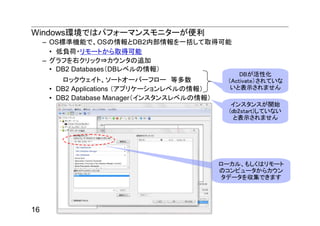
- 16. °Ā¾±²Ō»å“Ē·É²õ»·¾³¤Ē¤Ļ„Ń„Õ„©©`„Ž„󄹄ā„Ė„æ©`¤¬±ćĄū ØC OSĖŹCÄܤĒ”¢OS¤ĪĒéó¤ČDB2ÄŚ²æĒéó¤ņŅ»ĄØ¤·¤ĘČ”µĆæÉÄÜ ? µĶŲŗÉ?„ź„ā©`„Ȥ«¤éČ”µĆæÉÄÜ ØC „°„é„Õ¤ņÓŅ„Æ„ź„Ć„Æ?„«„¦„ó„æ¤Ī×·¼Ó ? DB2 Databases£ØDB„ģ„Ł„ė¤ĪĒéó£© DB¤¬»īŠŌ»Æ „ķ„Ć„Æ„¦„§„¤„Č”¢„½©`„Č„Ŗ©`„Š©`„Õ„ķ©` µČ¶ąŹż £ØActivate£©¤µ¤ģ¤Ę¤¤¤Ź ? DB2 Applications £Ø„¢„ׄź„±©`„·„ē„ó„ģ„Ł„ė¤ĪĒéó£© ¤¤¤Č±ķŹ¾¤µ¤ģ¤Ž¤»¤ó ? DB2 Database Manager£Ø„¤„󄹄æ„󄹄ģ„Ł„ė¤ĪĒéó£© „¤„󄹄æ„󄹤¬é_Ź¼ (db2start)¤·¤Ę¤¤¤Ź¤¤ ¤Č±ķŹ¾¤µ¤ģ¤Ž¤»¤ó „ķ©`„«„ė”¢¤ā¤·¤Æ¤Ļ„ź„ā©`„Č ¤Ī„³„ó„Ō„å©`„椫¤é„«„¦„ó „æ„Ē©`„æ¤ņ §¼Æ¤Ē¤¤Ž¤¹ 16
- 18. OS„³„Ž„ó„ɤĒµĆ¤é¤ģ¤Ź¤¤Ēéó¤Č¤Ļ£æ OS„³„Ž„ó„ɤĒ¤ĻČ”µĆ¤Ē¤¤Ź¤¤“óĒŠ¤ŹĒéó¤Ļ¶ąŹż“ęŌŚ¤¹¤ė ØC „į„ā„źČ«Ģå¤ĪŹ¹ÓĆĮæ¤ĻOS„³„Ž„ó„ɤĒ·Ö¤«¤ė¤¬”¢DB2¤Īø÷ ·N„Ņ©`„פ䄊„Ć„Õ„”©`¤ĪĮ椬×椟¤Ę¤¤¤ė¤«¤É¤¦¤«¤ĻDB2 ¤Ė¤·¤«·Ö¤«¤é¤Ź¤¤ ØC „Ē„£„¹„ÆČ«Ģå¤ĪŹ¹ÓĆĮæ¤ĻOS„³„Ž„ó„ɤĒ·Ö¤«¤ė¤¬”¢±ķ„¹ „Ś©`„¹¤ĪĄūÓĆĀŹ¤ĻDB2¤Ė¤·¤«·Ö¤«¤é¤Ź¤¤ DB2¤ĪדB¤Ļ³£¤Ėä»Æ¤·¤Ę¤¤¤ė ØC ¤½¤Ī¤æ¤į”ø½ń”¹¤Īדr¤ņ°ŃĪÕ¤·¤Ęź¤¹¤ė±ŲŅŖ¤¬¤¢¤ė DB2¤Ī”ø½ń”¹¤¬·Ö¤«¤ėĒé󤬤¢¤ė¤Č... ØC „Ń„Õ„©©`„Ž„󄹄Į„å©`„Ė„ó„°ÓĆ ? „Æ„Ø„ź©`gŠŠÖŠ¤ĪדB¤ņ„ā„Ė„æ„ź„ó„° ØC ±OŅÓĆ ? ”ø½ń”¹¤ĪדB¤ņ¶ØĘŚµÄ¤ĖÓåh¤¹¤ė¤³¤Č¤Ē”¢®³£ŹĀB¤¬ ÅŠe¤Ē¤¤ė¤č¤¦¤Ė¤Ź¤ė 18
- 19. DB2¤Ī„ā„Ė„æ„ź„ó„°CÄÜ DB2¤Ė¤Ļ”ø„ā„Ė„棄؄ģ„į„ó„Č”¹¤Č¤¤¤¦±OŅķÄ椬¤¢¤ź”¢¤½¤ģ¤ņ„į„Č„ź„Ć„Æ£Ø„ā„Ė„æ©`±ķév Źż£©¤«”¢„¹„Ź„Ƅׄ·„ē„Ć„Č£ØSNAPSHOT„³„Ž„ó„É£©¤ĒČ”¤ź³ö¤¹¤č¤¦¤Ė¤Ź¤Ć¤Ę¤¤¤ė MONREPORT„ā„ø„å©`„ė „ā„Ė„æ©`±ķévŹż?„Ó„å©` £Ø„Ę„„¹„Č³öĮ¦£© £Ø„į„Č„ź„Ć„Æ£©”łv9.7ŅŌ½µ „ā„Ė„æ©`„Ó„å©` £ØMON_*¤«¤éŹ¼¤Ž¤ė „ā„Ė„æ©`±ķévŹż „Ó„å©`”£„ā„Ė„æ©`±ķév £ØMON_*¤ĒŹ¼¤Ž Źż¤ņ½M¤ßŗĻ¤ļ¤»¤Ę×÷ ¤ė±ķévŹż£© ¤é¤ģ¤Ę¤¤¤ė£© „ā„Ė„æ©`„Ø„ģ „į„ó„Č£Ø±OŅķ Ä棩 „¹„Ź„Ƅׄ·„ē„Ƅȱķ „¹„Ź„Ƅׄ·„ē„Ć„Č¹ÜĄķ évŹż „Ó„å©`£Ø„¹„Ź„Ƅׄ·„ē„Ć „ȱķévŹż¤ņ½M¤ßŗĻ¤ļ ¤»¤Ę×÷¤é¤ģ¤Ę¤¤¤ė£© „¹„Ź„Ƅׄ·„ē„Ć„Č GET SNAPSHOT„³„Ž„ó„É £Ø„Ę„„¹„Č³öĮ¦£© 19
- 20. „ā„Ė„æ©`„Ø„ģ„į„ó„Č „ā„Ė„æ©`„Ø„ģ„į„ó„Ȥ«¤é¤ĻŲNø»¤ŹDB2ÄŚ²æĒé󤬵Ƥé¤ģ¤Ž¤¹ Ąż£© „Š„Ć„Õ„”©`„ש`„ė¤Ų¤Ī„¢„Æ„»„¹Źż”¢„½©`„ȤĪ»ŲŹż”¢±ķ¤ĪÕi¤ßų¤Źż... „ā„Ė„æ©`„Ø„ģ„į„ó„ȤĪÕhĆ÷ ź¤·¤Ę¤¤¤ė„ā„Ė„æ©`±ķévŹż ¤ĪŅ»ÓE¤Č„°„ė©`„× (Ź”ĀŌ¤·¤Ę¤¤¤Ž¤¹) £ŗ ź¤·¤Ę¤¤¤ė„¹„Ź„Ƅׄ·„ē„Ć „Č„ā„Ė„æ©`¤ĪÕĄķ„°„ė©`„× ”ł„ā„Ė„æ©`„Ø„ģ„į„ó„ČŅ»ÓE 20 http://publib.boulder.ibm.com/infocenter/db2luw/v9r7/topic/com.ibm.db2.luw.admin.mon.doc/doc/r0001140.html
- 21. „į„Č„ź„Ć„Æ£Ø„ā„Ė„æ©`±ķévŹż£©¤Č¤Ļ DB2 9.7¤«¤é×·¼Ó¤µ¤ģ¤æŠĀ¤·¤¤„ā„Ė„æ„ź„ó„°¤ĪŹĖ½M¤ß”£„Ē„Õ„©„ė„ȤĒÓŠæ¤Ė¤Ź¤Ć¤Ę¤¤¤Ž¤¹ „Ē©`„æ„Ŗ„Ö„ø„§„Æ„Č„ģ„Ł„ė¤Ī±ćĄū¤Ź„Ó„å©`¤ä±ķévŹż ØC MON_GET_BUFFERPOOL : „Š„Ć„Õ„”©`„ש`„ė„Ņ„Ć„ČĀŹ¤Ź¤É ØC MON_GET_TABLE : ±ķ„¹„„ć„ó¤ĪŹż¤Ź¤É ØC MON_GET_INDEX :„¤„ó„Ē„Ć„Æ„¹„¹„„ć„ó¤ĪŹż¤Ź¤É „·„¹„Ę„ą „ģ„Ł„ė „Ń„Ć„±©`„ø?„„ć„Ć„·„å?„¹„Ę©`„Č„į „Ē©`„æ?„Ŗ„Ö„ø„§„Æ„Č „ģ„Ł„ė „ó„Č „ģ„Ł„ė MON_GET_TABLE MON_GET_SERVICE_SUBCLASS MON_GET_PKG_CACHE_STMT MON_GET_INDEX MON_GET_WORKLOAD MON_GET_BUFFERPOOL MON_GET_CONNECTION „¢„Æ„Ę„£„Ó„Ę„£©` „ģ„Ł„ė MON_GET_TABLESPACE MON_GET_UNIT_OF_WORK MON_GET_ACTIVITY_DETAILS MON_GET_CONTAINER MON_GET_EXTENT_MOVEMENT_STATUS „ę©`„¶¤Ī„Æ„Ø„ź©`¤Č”¢„·„¹„Ę„ąÄŚ²æ¤Ī„Æ„Ø„ź©`¤ņ·Ö¤±¤Ę„Ē©`„æ¤ņČ”µĆæÉÄÜ 21
- 22. „ā„Ė„æ©`±ķévŹż¤ĪŹ¹¤¤·½ ±ķévŹż¤Č¤Ļ”¢”ø±ķ¤ņ·µ¤¹”¹évŹż ØC ½Y¹ū¤Č¤·¤Ę±ķ¤ņ·µ¤¹¤Ī¤Ē”¢FROM¤Īįį¤ķ¤ĖÖƤ¤¤ĘŹ¹¤¦ ØC ±ķ¤Ē¤¢¤ėŹĀ¤ņŹ¾¤¹¤æ¤į¤Ė”¢TABLE()¤Ēģ¤ą±ŲŅŖ¤¬¤¢¤ė ØC Ąż£© SELECT * FROM TABLE(MON_GET_TABLE('DB2INST1','',-2)) AS T ? ¤Ē¤ā”¢¤¹¤“¤ÆĮŠ¤¬¶ą¤¤¤Ī¤Ē”¢ĮŠ¤ņÖø¶Ø¤·¤Ę½g¤é¤Ź¤¤¤Č”¢³¬ŗįéL¤Ī½Y¹ū¤¬... ¤½¤³¤Ē... db2perf_browse¤ņĄūÓĆ ØC 2011Äź5ŌĀ¤Ī"DB2 chat with the lab"¤ĒÕhĆ÷¤µ¤ģ¤æ±ćĄū„Ä©`„ė ? ĮŠ¤ČŠŠ¤ņČė¤ģĢę¤Ø¤Ę±ķŹ¾¤¹¤ė„¹„Č„¢„Ʉׄķ„·©`„ø„ć Ąż£© > call db2perf_browse('MON_GET_BUFFERPOOL(''IBMDEFAULTBP'',null)') > call db2perf_browse('MON_GET_TABLE(''DB2INST1'',null,-2)') 22
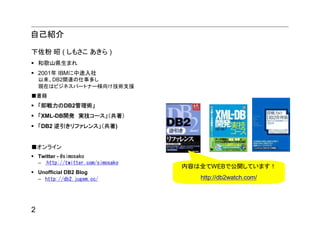
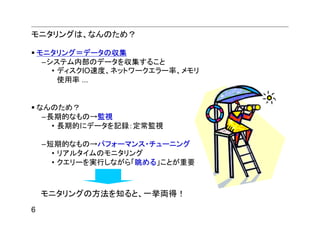
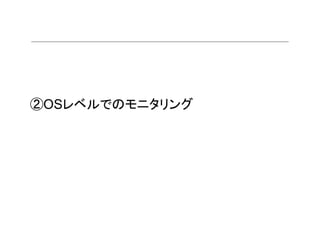
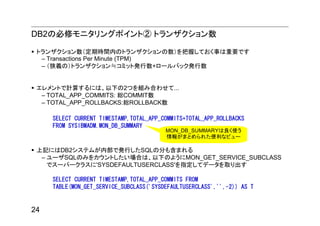
- 23. DB2¤Ī±ŲŠŽ„ā„Ė„æ„ź„ó„°„Ż„¤„ó„Č¢Ł „Š„Ć„Õ„”©`„ש`„ė¤Ī„Ņ„Ć„ČĀŹ „Š„Ć„Õ„”©`„ש`„ė(BP)¤Ļ”¢„Ē©`„æ¤Ī„„ć„Ć„·„åīIÓņ „Ø©`„ø„§„ó„Č ØC „Ē©`„æ„Ł©`„¹¤Ē×ī¤āßW¤¤„Ń©`„ĤĻ”ø„Ē„£„¹„Æ”¹ ØC „„ć„Ć„·„å¤Ļ¤¢¤ė¤¬„µ„¤„ŗ¤ĖĻŽ¶Č¤¬¤¢¤ė ”śBP „Ņ„Ć„ČĀŹĻņÉĻ¤Ļ„Ń„Õ„©©`„Ž„ó„¹ĻņÉĻ¤ĪęI IO„µ©` „Ś©`„ø? BP„Ņ„Ć„ČĀŹ£½„Š„Ć„Õ„”©`„ש`„ė¤ņÕi¤ßų¤¤·¤æŹż/Č«Ģå „Š©` „Æ„ź©`„Ź©` ¤ĪIO„ź„Æ„Ø„¹„ȤĪŹż * 100 [%] „Ø„ģ„į„ó„ȤĒÓĖć¤¹¤ė¤Ė¤ĻŅŌĻĀ¤Ī2¤Ä¤ņŹ¹ÓƤ·¤Ę.. ØC POOL_DATA_L_READS : ÕĄķÕi¤ßČ”¤źŹż ±ķ„¹„Ś©`„¹ ØC POOL_DATA_P_READS : ĪļĄķÕi¤ßČ”¤źŹż „³„ó„Ę„Ź „³„ó„Ę„Ź SELECT 100.0*(POOL_DATA_L_READS - POOL_DATA_P_READS) / POOL_DATA_L_READS FROM TABLE (MON_GET_BUFFERPOOL('IBMDEFAULTBP',null)) AS T ¤ā¤·¤Æ¤Ļ”¢ÓƤĪ„Ó„å©`¤ņŹ¹ÓĆ£Ø”ł¤³¤Į¤é¤Ļ„¹„Ź„Ƅׄ·„ē„Ć„Č„Ē©`„æ¤Ź¤Ī¤Ē×¢Ņā£© SELECT BP_NAME,DATA_HIT_RATIO_PERCENT,INDEX_HIT_RATIO_PERCENT FROM SYSIBMADM.BP_HITRATIO 23
- 24. DB2¤Ī±ŲŠŽ„ā„Ė„æ„ź„ó„°„Ż„¤„ó„Č¢Ś „Č„é„󄶄Ƅ·„ē„óŹż „Č„é„󄶄Ƅ·„ē„óŹż£Ø¶ØĘŚrégÄŚ¤Ī„Č„é„󄶄Ƅ·„ē„ó¤ĪŹż£©¤ņ°ŃĪÕ¤·¤Ę¤Ŗ¤ÆŹĀ¤ĻÖŲŅŖ¤Ē¤¹ ØC Transactions Per Minute (TPM) ØC £ØĻĮĮx¤Ī£©„Č„é„󄶄Ƅ·„ē„óØP„³„ß„Ć„Č°kŠŠŹż+„ķ©`„ė„Š„Ć„Æ°kŠŠŹż „Ø„ģ„į„ó„ȤĒÓĖć¤¹¤ė¤Ė¤Ļ”¢ŅŌĻĀ¤Ī2¤Ä¤ņ½M¤ßŗĻ¤ļ¤»¤Ę... ØC TOTAL_APP_COMMITS: ¾tCOMMITŹż ØC TOTAL_APP_ROLLBACKS:¾tROLLBACKŹż SELECT CURRENT TIMESTAMP,TOTAL_APP_COMMITS+TOTAL_APP_ROLLBACKS FROM SYSIBMADM.MON_DB_SUMMARY MON_DB_SUMMARY¤ĻĮ¼¤ÆŹ¹¤¦ Ēé󤬤Ž¤Č¤į¤é¤ģ¤æ±ćĄū¤Ź„Ó„å©` ÉĻÓ¤Ė¤ĻDB2„·„¹„Ę„ą¤¬ÄŚ²æ¤Ē°kŠŠ¤·¤æSQL¤Ī·Ö¤āŗ¬¤Ž¤ģ¤ė ØC „ę©`„¶SQL¤Ī¤ß¤ņ„«„¦„ó„Ȥ·¤æ¤¤öŗĻ¤Ļ”¢ŅŌĻĀ¤Ī¤č¤¦¤ĖMON_GET_SERVICE_SUBCLASS ¤Ē„¹©`„Ń©`„Ƅ鄹¤Ė'SYSDEFAULTUSERCLASS'¤ņÖø¶Ø¤·¤Ę„Ē©`„æ¤ņČ”¤ź³ö¤¹ SELECT CURRENT TIMESTAMP,TOTAL_APP_COMMITS FROM TABLE(MON_GET_SERVICE_SUBCLASS('SYSDEFAULTUSERCLASS','',-2)) AS T 24
- 25. DB2¤Ī±ŲŠŽ„ā„Ė„æ„ź„ó„°„Ż„¤„ó„Č¢Ū ßW¤¤„Æ„Ø„ź©`¤Ī°kŅ „Ń„Õ„©©`„Ž„󄹄Į„å©`„Ė„ó„°¤Ē¤Ļ”¢ßW¤¤„Æ„Ø„ź©`¤Ė¤·¤Ę„Į„å©`„Ė„ó„°¤¹¤ėŹĀ¤¬ÖŲŅŖ ØC Ņ»·¬Į¼¤¤¤Ī¤Ļ”¢„Ƅ鄤„¢„ó„Č„¢„ׄź„±©`„·„ē„óȤĒSQL¤ņ¹ÜĄķ¤·¤Ę¤¤¤ė¤³¤Č ØC o¤¤¤Ź¤é”¢„Ń„Ć„±©`„ø„„ć„Ć„·„夫¤é£ØgŠŠ¤µ¤ģ¤æSQL¤ņŅ»“ĪµÄ¤Ė„„ć„Ć„·„夷¤Ę¤Ŗ¤ÆīIÓņ£© „Ø„ģ„į„ó„ȤĒÓĖć¤¹¤ė¤Ė¤Ļ”¢ ØC STMT_EXEC_TIME£ŗ„Æ„Ø„ź©`¤ņgŠŠ¤·¤ærég ØC EXECUTABLEID£ŗSQL°¤Ėø¶¤±¤é¤ģ¤ėID£Ø„Ļ„Ć„·„壩 ¤ņ„Ł©`„¹¤ĖŹĖ÷ ? ŅŌĻĀ¤ĪĄż¤Ļ”¢Ķ¬¤ø„Æ„Ø„ź©`¤ĪgŠŠrég¤ņSUM¤Ē×椷¤Ę”¢ßW¤¤¤ā¤Īķ¤Ē„Č„Ć„×10¤ņ³öĮ¦¤·¤æĄż SELECT SUM(STMT_EXEC_TIME) AS TOTAL_EXEC_TIME, SUM(TOTAL_ACT_WAIT_TIME) AS TOTAL_WAIT_TIME, EXECUTABLE_ID FROM TABLE(MON_GET_PKG_CACHE_STMT(NULL, NULL, NULL, -2)) AS T GROUP BY EXECUTABLE_ID ORDER BY TOTAL_EXEC_TIME DESC FETCH FIRST 10 ROWS ONLY ? EXECUTABLEID¤Ē¤ĻSQL¤¬·Ö¤«¤é¤Ź¤¤¤Ī¤Ē”¢ŅŌĻĀ¤Ī¤č¤¦¤Ė¤·¤ĘĒéó¤ņ³öĮ¦ EXECUTABLEID¤ņµŚ¶žŅżŹż¤ĖÖø¶Ø”££Øx¤ņø¶¤±¤ė¤Ī¤ņ¤ŖĶü¤ģo¤Æ£© call db2perf_browse('MON_GET_PKG_CACHE_STMT(NULL,x''010000000000000084000 25 0000000000000000000020020120223161303238342'',NULL,-2)');
- 26. £Ø²Īæ¼£©Ē°„Ś©`„ø¤ĪgŠŠĄż call db2perf_browse('MON_GET_PKG_CACHE_STMT(NULL,x''0100000000000000840000000 000000000000000020020120223161303238342'',NULL,-2)') ½Y¹ū„»„Ć„Č 1 -------------- TOTAL_SORTS 0 POST_THRESHOLD_SORTS 0 COL VALUE POST_SHRTHRESHOLD_SORTS 0 -------------------------------- ------------------------------- SORT_OVERFLOWS 0 MEMBER 0 WLM_QUEUE_TIME_TOTAL 0 SECTION_TYPE D WLM_QUEUE_ASSIGNMENTS_TOTAL 0 INSERT_TIMESTAMP 2012-02-23-16.13.03.238338 DEADLOCKS 0 (ÖŠĀŌ£© (ÖŠĀŌ) TOTAL_ACT_WAIT_TIME 305 LOCK_TIMEOUTS 0 TOTAL_CPU_TIME 1085 LOG_BUFFER_WAIT_TIME 0 POOL_READ_TIME 305 NUM_LOG_BUFFER_FULL 0 POOL_WRITE_TIME 0 LOG_DISK_WAIT_TIME 0 DIRECT_READ_TIME 0 LOG_DISK_WAITS_TOTAL 0 DIRECT_WRITE_TIME 0 LAST_METRICS_UPDATE 2012-02-23-16.43.02.557624 LOCK_WAIT_TIME 0 NUM_COORD_EXEC 7 TOTAL_SECTION_SORT_TIME 0 NUM_COORD_EXEC_WITH_METRICS 7 TOTAL_SECTION_SORT_PROC_TIME 0 VALID Y TOTAL_SECTION_SORTS 0 TOTAL_ROUTINE_TIME 0 LOCK_ESCALS 0 TOTAL_ROUTINE_INVOCATIONS 0 LOCK_WAITS 0 ROUTINE_ID 0 ROWS_MODIFIED 0 STMT_TYPE_ID DML, Select (blockable) ROWS_READ 35 QUERY_COST_ESTIMATE 23 ROWS_RETURNED 35 STMT_PKG_CACHE_ID 704374636548 DIRECT_READS 0 COORD_STMT_EXEC_TIME 313 DIRECT_READ_REQS 0 STMT_EXEC_TIME 313 DIRECT_WRITES 0 TOTAL_SECTION_TIME 313 DIRECT_WRITE_REQS 0 TOTAL_SECTION_PROC_TIME 8 POOL_DATA_L_READS 36 TOTAL_ROUTINE_NON_SECT_TIME 0 POOL_TEMP_DATA_L_READS 0 TOTAL_ROUTINE_NON_SECT_PROC_TIME 0 POOL_XDA_L_READS 0 STMT_TEXT SELECT COLNAME, TYPENAME FROM SYSCAT.COLUMNS WHERE POOL_TEMP_XDA_L_READS 0 TABNAME='POLICY' AND TABSCHE POOL_INDEX_L_READS 24 COMP_ENV_DESC <BLOB> POOL_TEMP_INDEX_L_READS 0 ADDITIONAL_DETAILS <BLOB> POOL_DATA_P_READS 2 -------------------- ---------------------------------------- POOL_TEMP_DATA_P_READS 0 POOL_XDA_P_READS 0 85 „ģ„³©`„ɤ¬ßxk¤µ¤ģ¤Ž¤·¤æ”£ POOL_TEMP_XDA_P_READS 0 POOL_INDEX_P_READS 4 „ź„æ©`„óדr = 0 POOL_TEMP_INDEX_P_READS 0 POOL_DATA_WRITES 0 POOL_XDA_WRITES 0 POOL_INDEX_WRITES 0 26
- 27. DB2¤Ī±ŲŠŽ„ā„Ė„æ„ź„ó„°„Ż„¤„ó„Č¢Ü „į„ā„źŹ¹ÓĆĮ攢„Ē„£„¹„ÆŹ¹ÓĆĮæ „į„ā„ź ØC Č«Ģå¤ņ¤¶¤Ć¤Æ¤źÖŖ¤ė¤Ė¤Ļ”¢db2mtrk„³„Ž„ó„ɣ؄į„ā„ź©`„Č„é„Ć„«©`£©¤¬±ćĄū db2inst1@ubuntuserver:~$ db2mtrk -d Memory for database: EMPLOYEE utilh pckcacheh other catcacheh bph (1) bph (S32K) 64.0K 1.6M 192.0K 512.0K 4.6M 832.0K bph (S16K) bph (S8K) bph (S4K) shsorth lockh dbh 576.0K 448.0K 384.0K 128.0K 16.9M 18.9M apph (64) apph (45) apph (14) apph (13) apph (12) apph (11) 64.0K 192.0K 64.0K 64.0K 64.0K 192.0K apph (10) apph (9) apph (8) appshrh 64.0K 64.0K 64.0K 1.4M „Ē„£„¹„Æ ØC „Ø„ģ„į„ó„ȤȤ·¤Ę¤Ļ”¢TBSP_TOTAL_PAGES£Ø“_±£¤·¤Ę¤¤¤ė„Ś©`„øŹżTBSP_USABLE_PAGES £ØæÕ¤„Ś©`„øŹż£©¤ņŹ¹¤Ć¤ĘÓĖ椷¤Ę¤āĮ¼¤¤¤¬”¢db2pd„³„Ž„ó„ɤ¬±ćĄū > db2pd -db EMPLOYEE -tablespaces 27
- 28. £Ø²Īæ¼£©Ē°„Ś©`„ø¤Īdb2pdgŠŠĄż > db2pd -db EMPLOYEE -tablespaces Tablespace Configuration: Address Id Type Content PageSz ExtentSz Auto Prefetch BufID BufIDDisk FSC NumCntrs MaxStripe LastConsecPg Name 0x00007F2CB1B0BDA0 0 DMS Regular 4096 4 Yes 4 1 1 Off 1 0 3 SYSCATSPACE 0x00007F2CB1B0D520 1 SMS SysTmp 4096 32 Yes 32 1 1 On 1 0 31 TEMPSPACE1 0x00007F2CB1B10C60 2 DMS Large 4096 32 Yes 32 1 1 Off 1 0 31 USERSPACE1 0x00007F2CB1B123E0 3 DMS Large 4096 4 Yes 4 1 1 Off 1 0 3 SYSTOOLSPACE 0x00007F2CB1B13B60 4 SMS UsrTmp 4096 4 Yes 4 1 1 On 1 0 3 SYSTOOLSTMPSPACE Tablespace Statistics: Address Id TotalPgs UsablePgs UsedPgs PndFreePgs FreePgs HWM Max HWM State MinRecTime NQuiescers PathsDropped 0x00007F2CB1B0BDA0 0 24576 24572 23296 0 1276 23296 23296 0x00000000 0 0 No 0x00007F2CB1B0D520 1 1 1 1 0 0 0 0 0x00000000 0 0 No 0x00007F2CB1B10C60 2 102400 102368 61696 0 40672 80256 80256 0x00000000 0 0 No 0x00007F2CB1B123E0 3 8192 8188 152 0 8036 152 152 0x00000000 0 0 No 0x00007F2CB1B13B60 4 1 1 1 0 0 0 0 0x00000000 0 0 No Tablespace Autoresize Statistics: Address Id AS AR InitSize IncSize IIP MaxSize LastResize LRF 0x00007F2CB1B0BDA0 0 Yes Yes 33554432 -1 No None None No 0x00007F2CB1B0D520 1 Yes No 0 0 No 0 None No 0x00007F2CB1B10C60 2 Yes Yes 314572800 104857600 No 1073741824 None No 0x00007F2CB1B123E0 3 Yes Yes 33554432 -1 No None None No 0x00007F2CB1B13B60 4 Yes No 0 0 No 0 None No Containers: Address TspId ContainNum Type TotalPgs UseablePgs PathID StripeSet Container 0x00007F2CB1B0D2E0 0 0 File 24576 24572 0 0 /home/db2inst1/db2inst1/NODE0000/EMPLOYEE/T0000000/C0000000.CAT 0x00007F2CB1B0EA00 1 0 Path 1 1 0 0 /home/db2inst1/db2inst1/NODE0000/EMPLOYEE/T0000001/C0000000.TMP 0x00007F2CB1B121A0 2 0 File 102400 102368 0 0 /home/db2inst1/db2inst1/NODE0000/EMPLOYEE/T0000002/C0000000.LRG 0x00007F2CB1B13920 3 0 File 8192 8188 0 0 /home/db2inst1/db2inst1/NODE0000/EMPLOYEE/T0000003/C0000000.LRG 0x00007F2CB1B15040 4 0 Path 1 1 0 0 /home/db2inst1/db2inst1/NODE0000/EMPLOYEE/T0000004/C0000000.UTM 28
- 29. ¤Ē¤ā¤Į¤ē¤Ć¤Č¤į¤ó¤É¤¦... (±¾ČÕ2»ŲÄæ) É«”©¤Ź„Ē©`„æ¤ņČ”¤ė¤Ė¤Ļdb2perf_browse¤ņČė¤ģ¤Ę”¢Ń}Źż¤ĪSQL¤ņų¤¤¤Ę¤Ŗ¤¤¤Ę”¢¶ØĘŚgŠŠ¤·¤Ę... ? ½YĆęµ¹¤Ē¤¹¤Ķ ¤½¤³¤Ē×ī½K±ųĘ÷ db2top ØC ¤ā¤Č¤ā¤Č¤ĻŅ»²æ¤ĪOSÓƤĪDB2¤Ė¤Ą¤±¤Ėg×°¤µ¤ģ¤Ę¤¤¤æ„³„Ž„ó„É ØC ¤¢¤Ž¤ź¤Ė±ćĄū¤Ź¤Ī¤ĒDB2 for Linux/Unix¤ĒĖŹ„³„Ž„ó„ɤĖ ¤É¤³¤¬¤¤¤¤¤Ī£æ ØC ŻXĮæ£ØŲŗɤņ¤ä¤µ¤Ź¤¤£© ØC ŗ g£Ø£±¤Ä„©`¤ņŃŗ¤¹¤Ą¤±£© ØC GUIo¤·¤Īh¾³¤Ē¤āŹ¹¤Ø¤ė ØC Ņ¤æ¤¤Ēé󤬄ź„¢„ė„愤„ą„°„é„Õ»Æ ØC ½Y¹ū¤ņ„Õ„”„¤„ė¤ĖÓåh¤Ē¤¤ė ”łdb2top¤ĪČ”µĆ·½·Ø¤Ė¤Ä¤¤¤Ę¤Ļ²Īæ¼ ŁYĮĻ¢Ś¤ĖURL¤ņÓŻd¤·¤Ę¤¤¤Ž¤¹ 29
- 30. B:„Ü„Č„ė„Ķ„Ć„Æ±ķŹ¾ db2top¤ņŹ¹¤¦¢Ł „ź„¢„ė„愤„ą¤ĒĢ÷¤į¤ė d:DBČ«Ģå¤Īדr t:±ķ„¹„Ś©`„¹ > db2top -d DBĆū ¤ĒĘšÓįį”¢„·„ē©`„Č„«„Ć„Č„©`¤Ē» b:„Š„Ć„Õ„”©`„ש`„ė Ćę¤ņĒŠ¤źĢę¤Ø”£I¤Ē„ā„Ė„æ„ź„ó„°égøō¤ņäøüæÉÄÜ”£i¤ĒÓ m:„Ņ©`„×Č«°ć ×÷ÖŠ¤Ī„Ŗ„Ö„ø„§„Æ„Č¤Ī¤ß¤ņ±ķŹ¾ D:£Øӵģ©SQL±ķŹ¾ ?„Ü„Č„ė„Ķ„Ć„Æ±ķŹ¾(B) ?DBČ«Ģå(d) ?±ķ„¹„Ś©`„¹(t) 30
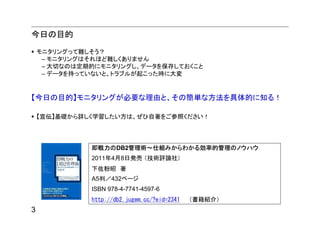
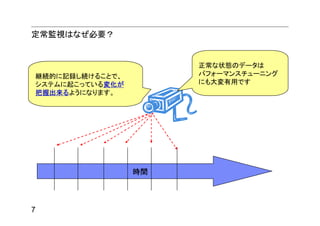
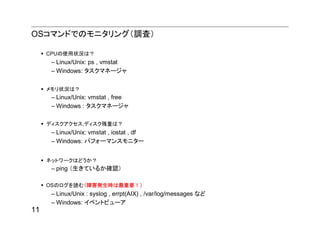
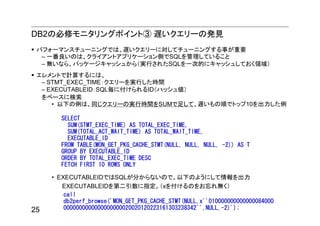
- 31. »å²ś2³Ł“Ē±č¤ņŹ¹¤¦¢ŚźÓƱą „į„æ„„ć„é„Æ„æ ŅāĪ¶ ^ ŠŠ¤ĪĻČī^¤Ė„Ž„Ć„Į¤¹¤ė Ņ¤æ¤¤Ēéó¤ņ½g¤źŽz¤ą $ ŠŠ¤Ī×īįį¤Ė„Ž„Ć„Į¤¹¤ė ØC /(„¹„é„Ć„·„å)¤ņŃŗ¤¹¤Č”¢ÕżŅ±ķ¬F¤Ē½g¤źŽz¤ß¤¬ | („Ń„¤„×) ×óÓŅ¤É¤Į¤é¤«¤ĪÕżŅ±ķ¬F¤Ė„Ž„Ć„Į¤¹¤ė æÉÄÜ . £Ø„Ō„ź„Ŗ„É£© ČĪŅā¤ĪĪÄ×ÖŅ»ĪÄ×Ö¤Ė„Ž„Ć„Į¤¹¤ė ? Ąż) /EMP[0-9] ”ś EMP0,EMP1... EMP9 + Ö±Ē°¤ĪĪÄ×Ö¤Ī1ĪÄ×ÖŅŌÉĻ¤ĪßB¾A ¤Ė„Ž„Ć„Į * („¢„¹„æ„ź„¹„Æ) Ö±Ē°¤ĪĪÄ×Ö¤Ī0ĪÄ×ÖŅŌÉĻ¤ĪßB¾A ? Ö±Ē°¤ĪĪÄ×Ö¤Ī0ĪÄ×Ö¤Ž¤æ¤Ļ1ĪÄ×Ö¤ĪßB¾A ØC z ¤ĒÖø¶ØĮŠ¤Ē¤Ī½µķ„½©`„Č(Z¤ĒNķ) ? „Ø„¹„±©`„×ĪÄ×Ö ØC c ¤Ē±ķŹ¾¤¹¤ėĮŠ¤ņÖø¶ØæÉÄÜ () ĪÄ×ÖĮŠ¤ņŅ»K¤ĒQ¤¦ [] „ź„¹„ČÄŚ¤Ī¤¤¤ŗ¤ģ¤«¤ĪĪÄ×Ö¤Ė„Ž„Ć„Į¤¹¤ė SQL¤ĪŌ¼¤ņµĆ¤ė¤Ė¤Ļ ØC ø÷SQL¤Ė¤Ļ„Ļ„Ć„·„å»Æ¤µ¤ģ¤æ¤¬ø¶¤¤¤Ę¤¤¤ė¤Ī¤Ē”¢L¤ņŃŗ¤·¤æįį¤ĖČėĮ¦¤¹¤ė¤ČŌ¼¤¬·Ö¤«¤ė ? e¤ĒExplain(gŠŠÓ»)¤ā“_ÕJæÉÄÜ 31
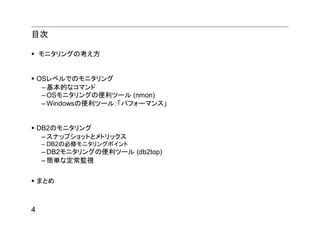
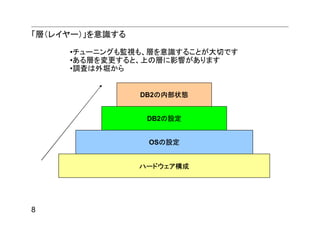
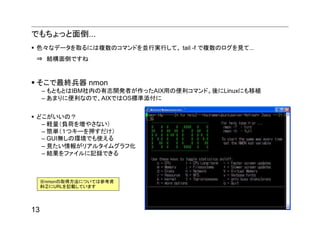
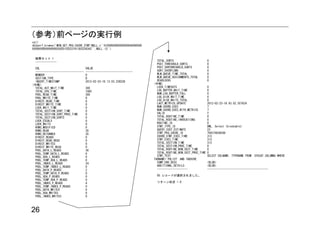
- 32. db2top¤ņŹ¹¤¦¢Ū Óåh¤ČÕ{Ė?óøęÓĆ „Õ„”„¤„ė¤ĖŌ¼¤ņÓåh¤¹¤ė ØC S¤ņŃŗ¤¹¤Č”¢SNAPSHOT„³„Ž„ó„ÉgŠŠ¤µ¤ģ¤ė ? vi¤Ē±ķŹ¾¤µ¤ģ¤ė¤Ī¤Ē :w „Õ„”„¤„ėĆū ¤Ē±£“ę ØC db2topĘšÓr¤Ė”¢ -b¤ņÖø¶Ø¤·¤Ę„Š„Ć„Æ„°„鄦„ó„É„ā©`„ɤĒĘšÓ ? „Ē©`„æ„Ł©`„¹(-d)”¢Č”µĆégøō[Ćė]£Ø-i£©”¢Č”µĆĘŚég[·Ö]£Ø-m£©¤¢¤ė¤¤¤ĻČ”µĆ»ŲŹż£Ø-s£©¤ņÖø¶Ø ? Ąż£© > db2top -d EMPLOYEE -b d -i 1 -m 10 > db2top.csv (-b¤Īįį¤Ī„Ŗ„ׄ·„ē„ó¤ĪŅāĪ¶) -b : background mode option: d=database, l=sessions, t=tablespaces, b=bufferpools, T=tables, D=Dynamic SQL, s=Statements, U=Locks, u=Utilities, F=Federation, m=Memory 32
- 33. ”ł²Ń°æ±·øé·”±Ź°æøé°Õ„ā„ø„å©`„ė http://publib.boulder.ibm.com/infocenter/d ŗ g¤Ź¶Ø³£±OŅ b2luw/v9r7/topic/com.ibm.db2.luw.sql.rtn.d oc/doc/r0056368.html MONREPORT„ā„ø„å©`„ė (DB2 9.7 FP1ŠĀCÄÜ) ØC ČĖ¤¬Õi¤ß¤ä¤¹¤¤„ģ„Ż©`„ȤņÉś³É¤¹¤ė Ąż£©MONREPORT.DBSUMMARY„ׄķ„·©`„ø„ć > db2 "CALL MONREPORT.DBSUMMARY(300)" > today.log ? ŅżŹż¤ĒÖø¶Ø¤µ¤ģ¤æĆėŹż¤Īég„Ē©`„æ¤ņ„ā„Ė„椷”¢„ģ „Ż©`„Ȥņ×÷³É¤¹¤ė ¤ā¤·¤Æ¤Ļ”¢MON_DB_SUMMARY„Ó„å©` > call db2perf_browse('SYSIBMADM.MON_DB_SUMMARY') 33
- 34. ¤Ž¤Č¤į „ā„Ė„æ„ź„ó„°¤Ļ”¢±OŅ?„Ń„Õ„©©`„Ž„󄹄Į„å©`„Ė„ó„°¤Ī»łµA ØC ±OŅ¤Č„Ń„Õ„©©`„Ž„󄹄Į„å©`„Ė„ó„°¤ĻµŲ¾A¤¤Ē¤¹ ӣ؄ģ„¤„ä©`£©¤ņŅā×R¤·¤Ę“_ÕJ ØC ĶāÜ„£ØĻĀÓ£©¤«¤é ØC OS„ģ„Ł„ė£Øvmstat,nmon ¤Ź¤É£© ØC DB2„ģ„Ł„ė£Ø„į„Č„ź„Ć„Æ”¢db2top¤Ź¤É£© “Ī¤Ī„¹„Ę„Ć„× ØC ŅŌĻĀ¤Ė¼¼ŠgĒé󤬼Ƥį¤é¤ģ¤Ę¤¤¤Ž¤¹ ? http://www.ibm.com/developerworks/jp/data/products/db2/db2_97.html ØC ¤Ŗį¤įŁYĮĻ ? DB2 V9.7 ß\ÓĆ¹ÜĄķ„¬„¤„É: „Ē©`„æ„Ł©`„¹?„ā„Ė„æ„ź„ó„° http://www.ibm.com/developerworks/jp/data/products/db2/operation-management- guide/v97_database-monitor.html ? DB2„Ž„Ė„å„¢„ė£ŗ„ā„Ė„æ„ź„ó„°(PDF) http://public.dhe.ibm.com/ps/products/db2/info/vr97/pdf/ja_JP/DB2Monitoring-db2f0j972.pdf ? DB2„Ž„Ė„å„¢„ė£ŗī}ÅŠe¤Č„Ń„Õ„©©`„Ž„󄹄Į„å©`„Ė„ó„°(PDF) http://public.dhe.ibm.com/ps/products/db2/info/vr97/pdf/ja_JP/DB2PerfTuneTroubleshoot- db2d3j972.pdf 34
- 35. ²Īæ¼ŁYĮĻ¢Ł CLUB DB2¤Īß^Č„ŁYĮĻ”¢ČėéTŁYĮĻ CLUB DB2¤Īß^Č„„»„ß„Ź©`ŁYĮĻ¹«é_ÖŠ ØC http://ibm.com/developerworks/wikis/display/clubdb2/materials „«„ó„æ„ó£”DB2„Ę„Æ„Ę„ÆµŚ1i »ł±¾CÄܾ ØC ČōøɹŤ¤ŁYĮĻ¤Ē¤¹¤¬”¢ø÷·N»ł±¾„³„Ž„ó„ɤĪŹ¹¤¤·½¤¬¤ä¤µ¤·¤Æ½āÕh¤µ¤ģ¤Ę¤¤¤Ž¤¹ ØC http://ibm.com/jp/software/data/developer/library/techdoc/kantandb2.html db2pdĄūÓĆ„¬„¤„É DB2 v9ź°ę ØC ī}ÅŠe¤ä±OŅ¤Ė“óäÓŠÓƤŹdb2pd¤ĪŹ¹¤¤·½½āÕh ØC http://ibm.com/jp/domino01/mkt/dminfo.nsf/doc/00217BBA DB2 Express-C¤Ī§Čė·½·Ø½āÕh£ØoĮĻ¤ĪDB2¤ĒŌ¤·¤Ž¤·¤ē¤¦£”£© ØC DB2 Express-C 9.7.4 for Windows „Æ„¤„Ć„Æ„¤„ó„¹„Č©`„ė ? http://www.ibm.com/developerworks/jp/offers/db2express-c/installwin_v974/ ØC DB2 Express-C 9.7.4 for Linux „Æ„¤„Ć„Æ„¤„ó„¹„Č©`„ė ? http://www.ibm.com/developerworks/jp/offers/db2express-c/installlin_v974/ 35
- 36. ²Īæ¼ŁYĮĻ¢Ś nmon,db2top,db2perf_browseévßB nmon ØC nmon „Ū©`„ą„Ś©`„ø (AIX°ę) ? http://www.ibm.com/developerworks/wikis/display/WikiPtype/nmon ØC nmon for Linux ? http://nmon.sourceforge.net/pmwiki.php ØC nmon Analyzer ? http://www.ibm.com/developerworks/wikis/display/Wikiptype/nmonanalyser ØC nmon Consolidator (nmon Analyzer¤ĪøÄĮ¼°ę) ? http://www.ibm.com/developerworks/wikis/display/WikiPtype/nmonconsolidator db2top ØC db2top ŗŅׄę©`„¶©`„Ž„Ė„å„¢„ė(Ó¢ÕZ) ? http://www-01.ibm.com/support/docview.wss?uid=swg27009542 ØC Ć×developerWorks¤Īdb2topévßBÓŹĀ(Ó¢ÕZ) ? https://www.ibm.com/developerworks/mydeveloperworks/blogs/thekguydw/tags/db2top db2perf_browse ØC http://www.zinox.com/files/db2perf_browse.txt (ÕhĆ÷) ØC http://www.zinox.com/files/db2perf_browse.db2 („¹„Č„¢„Ʉׄķ„·©`„ø„ć±¾Ģå) ØC chat the lab "The Latest in Advanced Performance Diagnostics for DB2" ¤ĪÓ»¤ČŁYĮĻ ? http://www.channeldb2.com/events/the-latest-in-advanced 36
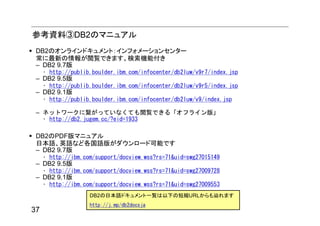
- 37. ²Īæ¼ŁYĮĻ¢ŪDB2¤Ī„Ž„Ė„å„¢„ė DB2¤Ī„Ŗ„ó„鄤„ó„É„„å„į„ó„Č£ŗ„¤„ó„Õ„©„į©`„·„ē„ó„»„ó„æ©` ³£¤Ė×īŠĀ¤ĪĒéó¤¬éÓE¤Ē¤¤Ž¤¹”£ŹĖ÷CÄÜø¶¤ ØC DB2 9.7°ę ? http://publib.boulder.ibm.com/infocenter/db2luw/v9r7/index.jsp ØC DB2 9.5°ę ? http://publib.boulder.ibm.com/infocenter/db2luw/v9r5/index.jsp ØC DB2 9.1°ę ? http://publib.boulder.ibm.com/infocenter/db2luw/v9/index.jsp ØC „Ķ„Ć„Č„ļ©`„ƤĖ椬¤Ć¤Ę¤¤¤Ź¤Æ¤Ę¤āéÓE¤Ē¤¤ė”ø„Ŗ„Մ鄤„ó°ę”¹ ? http://db2.jugem.cc/?eid=1933 DB2¤ĪPDF°ę„Ž„Ė„å„¢„ė ČÕ±¾ÕZ”¢Ó¢ÕZ¤Ź¤Éø÷¹śÕZ°ę¤¬„Ą„¦„ó„ķ©`„ÉæÉÄܤĒ¤¹ ØC DB2 9.7°ę ? http://ibm.com/support/docview.wss?rs=71&uid=swg27015149 ØC DB2 9.5°ę ? http://ibm.com/support/docview.wss?rs=71&uid=swg27009728 ØC DB2 9.1°ę ? http://ibm.com/support/docview.wss?rs=71&uid=swg27009553 DB2¤ĪČÕ±¾ÕZ„É„„å„į„ó„ČŅ»ÓE¤ĻŅŌĻĀ¤Ī¶ĢæsURL¤«¤é¤āŽ{¤ģ¤Ž¤¹ http://j.mp/db2docsja 37