DDD (Debugger Driven Development)
ŌĆóDownload as PPTX, PDFŌĆó
0 likesŌĆó90 views

My talk at the Symfony Online 2023 Conference. Many developers fail to use a debugger like Xdebug in their day to day activities. In this talk we explain: - Why you really want to be using a debugger - How do you install and configure it easily - How it interacts with your Symfony application - How you can use it for more than just debugging your application, how you can actually use it to drive your development.


DDD (Debugger Driven Development)
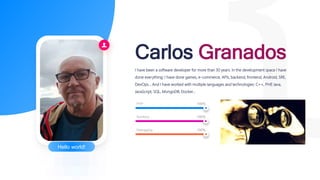
- 3. <3/> Hello world! Carlos Granados I have been a software developer for more than 30 years. In the development space I have done everything: I have done games, e-commerce, APIs, backend, frontend, Android, SRE, DevOps... And I have worked with multiple languages and technologies: C++, PHP , Java, JavaScript, SQL, MongoDB, DockerŌĆ” PHP 100% Symfony 100% Debugging 100%
- 4. https://fastdebug.io Looking for beta users!
- 5. <5/> DDD Debugger Driven Development <5/> - What is Xdebug and some reasons why people donŌĆÖt use it - How to enable and configure it in a Symfony project - Use cases, going beyond just debugging - Other alternatives
- 6. <6/> What is Xdebug ? The most widely used step-by- step debugger for the PHP language. An open source PHP extension created by Derick Rethans and launched in 2002 Provides all the expected tools: breakpoints, step-by- step, stack traces, variables, expression evaluationŌĆ” It is more than a debugger: profiling, code coverage, tracing, improved error handlingŌĆ” https://xdebug.org/
- 7. 2 0 1 9 . A l l R i g h t s R e s e r v e d <7/>
- 8. 2 0 1 9 . A l l R i g h t s R e s e r v e d <8/>
- 9. <9/> Xdebug is slow <9/> - It can make your code between 60% and 300% slower - It has improved a lot in version 3 - Make sure you use the right configuration - You can always give FastDebug a go!
- 10. <10/> Xdebug is hard to set up <10/> - It can really be difficult to configure and get it running - You only need to do it once - Derick has produced some really good helper videos - I am working on a wizard that will greatly simplify the process
- 11. <11/> I donŌĆÖt need a debugger <11/> - My code is fully tested so I donŌĆÖt have any bugs - DonŌĆÖt believe this can be the case in a real world scenario - The system is not complex enough - Symfony has 279 open bugs at the time of writing
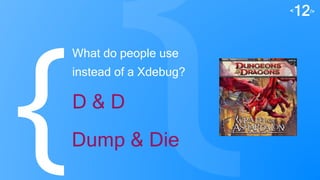
- 12. <12/> What do people use instead of a Xdebug? D & D Dump & Die
- 13. <13/> WhatŌĆÖs wrong with dump & die? It only provides a very narrow and limited view into your code. It usually requires several iterations to get to the heart of the problem Many times it can be difficult to record the output. Requires modification of your code, with the possibility of leaving debugging code behind. ItŌĆÖs like using alert()!
- 14. <14/> Debugging is like using a security camera Using Dump & die is like using a camera that only takes photos of a limited part of the scene. Using a Debugger is like using a camera that records video and which you can pan around.
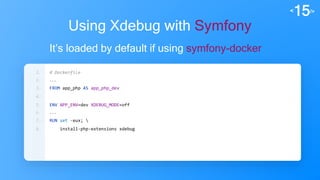
- 15. <15/> 1. # Dockerfile 2. ... 3. FROM app_php AS app_php_dev 4. 5. ENV APP_ENV=dev XDEBUG_MODE=off 6. ... 7. RUN set -eux; 8. install-php-extensions xdebug Using Xdebug with Symfony ItŌĆÖs loaded by default if using symfony-docker
- 16. <16/> 1. > docker-compose exec php php -v 2. 3. PHP 8.1.19 (cli) (built: May 13 2023 01:08:01) (NTS) 4. Copyright (c) The PHP Group 5. Zend Engine v4.1.19, Copyright (c) Zend Technologies 6. with Zend OPcache v8.1.19, Copyright (c), by Zend Technologies 7. with Xdebug v3.2.1, Copyright (c) 2002-2023, by Derick Rethans Using Xdebug with Symfony Check that it is correctly loaded
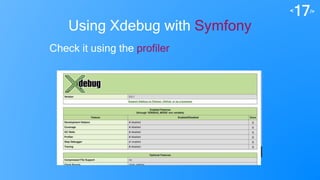
- 17. <17/> Using Xdebug with Symfony Check it using the profiler
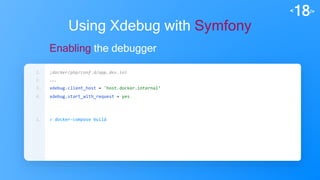
- 18. <18/> 1. ;docker/php/conf.d/app.dev.ini 2. ... 3. xdebug.client_host = 'host.docker.internalŌĆÖ 4. xdebug.start_with_request = yes Using Xdebug with Symfony Enabling the debugger 1. > docker-compose build
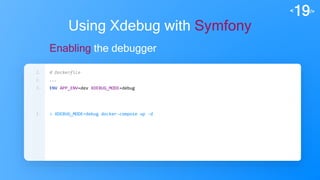
- 19. <19/> 1. # Dockerfile 2. ... 3. ENV APP_ENV=dev XDEBUG_MODE=debug Using Xdebug with Symfony Enabling the debugger 1. > XDEBUG_MODE=debug docker-compose up -d
- 20. <20/> Use the debugger to explore code Learn about the internals of the framework (recommended in the Symfony docs). Learn about the inner working of your dependencies. Learn about the interface to APIs, investigate requests and responses. Understand legacy code or functionality which is not well documented.
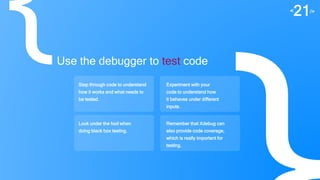
- 21. <21/> Use the debugger to test code Step through code to understand how it works and what needs to be tested. Experiment with your code to understand how it behaves under different inputs. Look under the hod when doing black box testing. Remember that Xdebug can also provide code coverage, which is really important for testing.
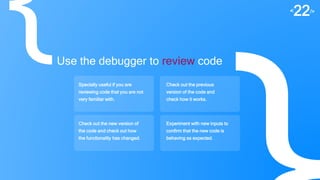
- 22. <22/> Use the debugger to review code Specially useful if you are reviewing code that you are not very familiar with. Check out the previous version of the code and check how it works. Check out the new version of the code and check out how the functionality has changed. Experiment with new inputs to confirm that the new code is behaving as expected.
- 23. <23/> Use the debugger for concurrency Concurrency issues can be specially difficult to debug or test. Setup a breakpoint in one of the processes and let it run until it is hit. Set another breakpoint in another process and again let it run until it is hit. Now use step debugging alternating in both processes to test what happens when they run concurrently.
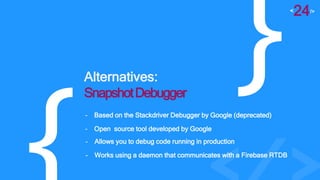
- 24. <24/> Alternatives: SnapshotDebugger <24/> - Based on the Stackdriver Debugger by Google (deprecated) - Open source tool developed by Google - Allows you to debug code running in production - Works using a daemon that communicates with a Firebase RTDB
- 25. <25/> Alternatives: SnapshotDebugger <25/> - Requires adding a PHP extension to enable the breakpoints - When a breakpoint is hit it just records info without stopping - When the request finishes this info is sent to Firebase or logged - It is throttled so that it does not use too much CPU or memory
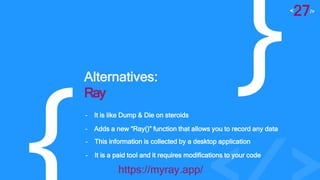
- 27. <27/> Alternatives: Ray <27/> - It is like Dump & Die on steroids - Adds a new ŌĆ£Ray()ŌĆØ function that allows you to record any data - This information is collected by a desktop application - It is a paid tool and it requires modifications to your code https://myray.app/