Denice Ross Lightning
- 1. An app we can trustFive tips from KatrinaPresented by: Denice W. RossGreater New Orleans Community Data Center
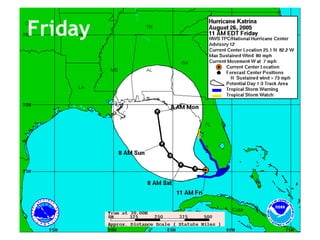
- 3. Friday
- 4. Saturday
- 5. Sunday
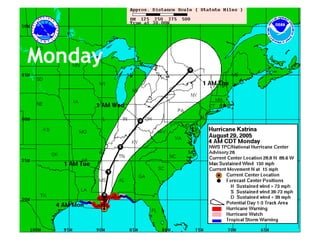
- 6. Monday
- 7. Smiley N. Pool, Dallas Morning NewsAlex Brandon, Times PicayuneAlex Brandon, Times PicayuneIrwin Thompson, Times Picayune
- 10. Tip #1:Have a well-defined question based on the real needs of your audience.
- 11. âHow many people are back, and where are they living?â
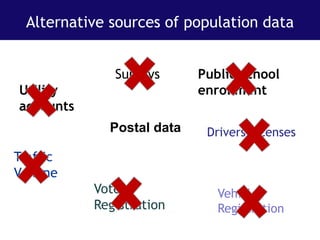
- 12. Alternative sources of population dataPublic school enrollmentSurveysUtility accountsPostal dataDrivers LicensesTraffic VolumeVoter RegistrationVehicle Registration
- 13. Alternative sources of population dataPublic school enrollmentSurveysUtility accountsPostal dataDrivers LicensesTraffic VolumeVoter RegistrationVehicle Registration
- 14. Tip #2:Make sure the data set you choose can actually answer your question.
- 17. Tip #3:Put metadata in plain sight and in plain English.
- 18. Descriptive titlePersistent legendSource citation
- 19. Simple description of what the data set represents
- 20. âLearn moreâ for laypeople
- 21. Technical documentation for experts
- 22. Tip #4:Fix, or explain, errors that matter to locals.(fixing is better)
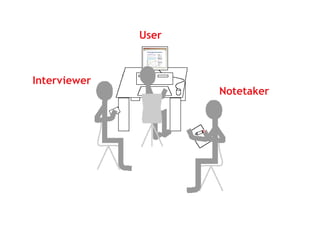
- 24. Tip #5:Optimize usability through field-testing.
- 27. 800 x 600 Screen Resolution <5% web site visitors60% of neighborhood leaders
- 28. Credible App=Happy users and a smoother recovery for New Orleans
- 34. ââĶpopulation is shifting across neighborhoods even as new households are moving into the city, indicating the need to monitor new vacancies and develop policies to address potential new blightâ
- 35. Local credibility is hard to gainâĶ and easy to lose.
Editor's Notes
- 4.5 years ago, a large hurricane named Katrina headed our way.
- But then we learned the federal levee system had failed, and 80% of our city was underwater.
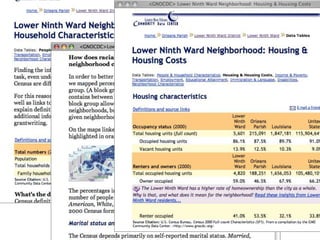
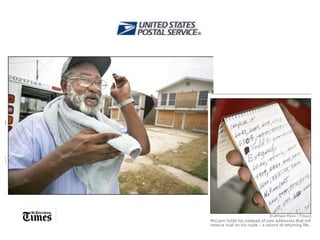
- Postal data makes sense. Mailman McCann walks his route in the Lower Ninth, talks to folks, and knows right away if someone has moved back.He recordsthe addresses that are picking up the mail and addresses that are vacant. Then he puts these changes into the official âedit bookâ and they go into a central database.
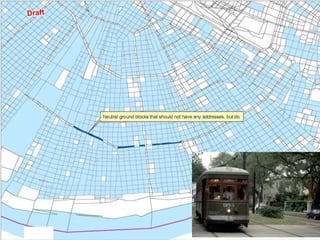
- As we kicked the tires on this data set, we noticed more than 700 addresses were geocoding to blocks in theneutral ground blocks, like on St. Charles Avenue where the street car runs. There arenât any houses there. We know that the problem stems from inaccuracies in the geocoding database, but our lay audience doesnât care about geocoding databases and seeing houses on the street car tracks makes our whole data set lose credibility, and it distracts our users from the tasks they are trying to accomplish with the app.So we fixed âem.
- One surprising finding was that although less than 5% of all visitors to our web site had low-res displays, 60% of the neighborhood leaders we tested the site with had displays of 800x600 resolution, rendering our app this big.
- Seven quick case studies.
- Spring break volunteers in Holy Cross worked on gutting houses rather than collecting basic data through door to door surveying, because that data is now updated quarterly in this app.
- Friends of Palmer Park uses the data in grant proposals to demonstrate that the area around the park is well-repopulated.
- In this contentious land-use issue, advocates for homeowners and the hospital developers used this app to understand how many people are living in the proposed footprint of a new hospital.
- This app makes it easy for media to report on New Orleans recovery, which keeps us in the national consciousness.
- This app makes it easy for media to report on New Orleans recovery, which keeps us in the national consciousness.
- And we also use the app as a policy tool.

