Design tolerances using Six Sigma Statistical tolerances
- 2. Page 2
- 3. Accurate but not precise - On average, the shots are in the center of the target but there is a lot of variability Precise but not accurate - The average is not on the center, but the variability is small Source: iSixSigma
- 4. TOTAL Variation Part to Part Variation Measurement System Variation Repeatability: Variation due to gage or measurement tool Reproducibility: Variation due to people or operators who are measuring s2 Total = s2 Part-Part + s2 R&R
- 5. August 5, 2016 Pa
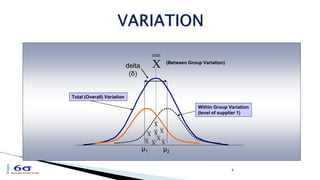
- 6. 6 ╬╝1 ╬╝2 delta (╬┤) (Between Group Variation) Within Group Variation (level of supplier 1) Total (Overall) Variation X X X X X X X X X
- 7. Page 7 August 5, 2016
- 8. ’üĮ The Cpk index is a modified Cp index for mean shift of the process characteristic. ’üĮ k ranges between <0..1> ’üĮ The effective standard deviation of the process may then be estimated as: August 5, 2016 Pa
- 9. 9 USL LSL Voice of the Customer Voice of The Process Voice of the Customer Voice of the Process Capability Ratio - compares the capability of a process (voice of the process) to the specification limits (voice of the customer): = USL - LSL 6s = Cp Cp = 1: The process is barely capable (Just fits into the tolerance window). Cp = 2: The process is a six sigma process (The tolerance window is twice the process capability).
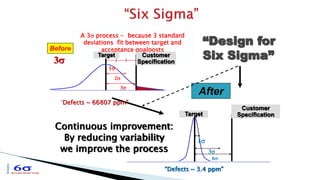
- 10. A 3s process - because 3 standard deviations fit between target and acceptance goalposts Target Customer Specification 1s 2s 3s 3s Before Target Customer Specification After 1s 6s 6s Continuous improvement: By reducing variability we improve the process ŌĆ£Design for Six SigmaŌĆØ ŌĆ£Defects ~ 66807 ppmŌĆØ ŌĆ£Defects ~ 3.4 ppmŌĆØ 3s
- 11. What do we Need? LSL USL LSL USL LSL USL Off-Target, Low Variation High Potential Defects Good Cp but Bad Cpk On Target High Variation High Potential Defects No so good Cp and Cpk On-Target, Low Variation Low Potential Defects Good Cp and Cpk ’ü¼ Variation reduction and process centering create processes with less potential for defects. ’ü¼ The concept of defect reduction applies to ALL processes (not just manufacturing)
- 12. Page 12 August 5, 2016 Cp=1.03 Cpk=0.57 Ppk=0.73 WhatŌĆÖs the difference ? Is this process capable long term? Supplier Component #1 Capability Analysis
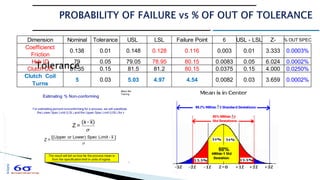
- 13. For estimating percent nonconforming for a process, we will substitute the Lower Spec Limit (LSL) and the Upper Spec Limit (USL) for x 13 s ] x - Limit Spec Lower) or [(Upper = Z s ) x - (x = Z
- 14. Z= % Out of Tolerance Dimension Nominal Tolerance USL LSL Failure Point ŽŁ USL - LSL Z- % OUT SPEC Coefficienct Friction 0.138 0.01 0.148 0.128 0.116 0.003 0.01 3.333 0.0003% Hub ID 79 0.05 79.05 78.95 80.15 0.0083 0.05 6.024 0.0002% Clutch OD 81.35 0.15 81.5 81.2 80.15 0.0375 0.15 4.000 0.0250% Clutch Coil Turns 5 0.03 5.03 4.97 4.54 0.0082 0.03 3.659 0.0002%
- 15. Page 15 August 5, 2016 Probability of SINGLE POINT FAILURE Dimension Coefficienct Friction Hub ID Clutch OD Clutch Coil Turns X--Nominal 0.138 79 81.35 5 Tolerance 0.01 0.05 0.15 0.03 USL 0.148 79.05 81.5 5.03 LSL 0.128 78.95 81.2 4.97 Failure Point 0.116 80.15 80.15 4.54 (x-Nominal) 0.02 0.05 0.15 0.03 (x-Nominal) sq 0.00 0.00 0.02 0.00 ŽŁ 0.00 0.01 0.01 0.01 2Ž¼ 0.01 0.02 0.02 0.02 e power 0.08 0.15 1.36 0.05 E-power x 1.08 1.16 3.88 1.06 1/2pi 0.16 0.16 0.16 0.16 Probability 0.17 0.19 0.62 0.17 Probability of FAILURE = 17% 16.8% 11.4%
- 16. The rate of change in the Standard Error approaches zero at about 30 samples. This is why 30 samples is often recommended when generating summary statistics such as the Mean and Standard Deviation. This is also the point at which the t and Z distributions become nearly equivalent. 1 30 20 10 0 Sample Size Standard Error 5
- 18. Page 18 August 5, 2016
- 19. Page 19 August 5, 2016
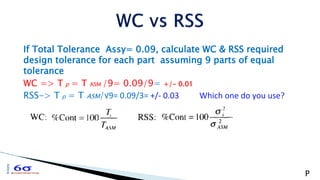
- 20. If Total Tolerance Assy= 0.09, calculate WC & RSS required design tolerance for each part assuming 9 parts of equal tolerance WC => T p = T ASM /9= 0.09/9= +/- 0.01 RSS-> T p = T ASM/ŌłÜ9= 0.09/3= +/- 0.03 Which one do you use? P
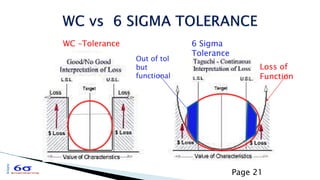
- 21. Page 21 WC ŌĆōTolerance 6 Sigma Tolerance Loss of Function Out of tol but functional
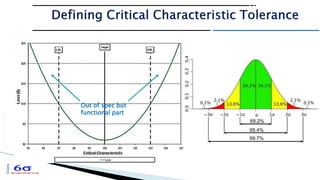
- 22. Page 22 Out of spec but functional part
- 23. Page 23 August 5, 2016
- 24. Page 24






![For estimating percent nonconforming for a
process, we will substitute the Lower Spec Limit
(LSL) and the Upper Spec Limit (USL) for x
13
s
]
x
-
Limit
Spec
Lower)
or
[(Upper
=
Z
s
)
x
-
(x
=
Z](https://image.slidesharecdn.com/statisticalsixsigmatolerances-240725023649-d56d7413/85/Design-tolerances-using-Six-Sigma-Statistical-tolerances-13-320.jpg)
