Development of National Land Cover Monitoring System for Nepal
- 1. Development of National Land Cover Monitoring System for Nepal
- 2. Land cover mapping efforts in Nepal Source: FRTC (2019) et al.
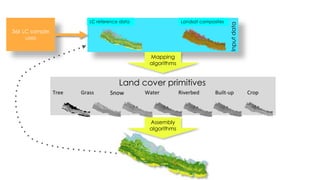
- 3. National Land Cover Monitoring System Methodology ? Machine learning technique for land cover mapping; ? Powerful web-platform for cloud-based processing free historical archive data; ? No high configure computer infrastructure needed; ? Developed data consistency across the country ? Co-development and sustainably
- 4. LC reference data Landsat composites Input data 36k LC sample uses Mapping algorithms Land cover primitives Tree Built-up Crop Grass Snow Water Riverbed Assembly algorithms
- 5. Land Cover Nepal (2000-2019)
- 6. A close-up view of Nepal land cover Sagarmatha National Park
- 7. A close-up view of Nepal land cover Dhorpatan Hunting Reserve
- 8. A close-up view of Nepal land cover Bharatpur
- 9. The land cover area in various categories of Nepal 0.00 5.00 10.00 15.00 20.00 25.00 30.00 35.00 40.00 45.00 Forest Other wooded land Grassland Cropland Builtup Baresoil Barerock Waterbody Riverbed Glacier Snow LC2019 LC2018 LC2017 LC2016 LC2015 LC2014 LC2013 LC2011 LC2010 LC2009 LC2008 LC2007 LC2006 LC2005 LC2004 LC2003 LC2002 LC2001 LC2000
- 10. The land cover area in various categories of Nepal Land cover LC2000 LC2005 LC2010 LC2015 LC2019 Forest 40.02 41.04 41.16 41.28 41.72 Other wooded land 3.58 3.18 3.31 3.55 3.63 Grassland 43.60 44.22 44.46 44.83 45.36 0.00 5.00 10.00 15.00 20.00 25.00 30.00 35.00 40.00 45.00 LC2000 LC2005 LC2010 LC2015 LC2019 Area (%) Forest Other wooded land Land cover LC2000 LC2005 LC2010 LC2015 LC2019 Forest 40.02 41.04 41.16 41.28 41.72 OWL 3.58 3.18 3.31 3.55 3.63 Grassland 13.96 13.26 14.43 13.43 13.27 Cropland 26.41 25.77 25.62 25.28 24.31 Bare soil 0.00 0.00 0.00 0.03 0.03 Bare rock 7.34 6.54 8.52 4.65 5.63 Wetland 0.45 0.42 0.42 0.45 0.49 Glacier 3.05 3.05 3.05 3.04 3.04 Snow 3.86 5.37 2.21 7.09 6.23 Riverbed 1.16 1.18 1.06 0.95 1.11 Built-up 0.17 0.20 0.22 0.25 0.53 Total 100 100 100 100 100
- 11. Land cover change matrix between 2000 and 2019 Land cover (sqkm) Wetland Glacier Snow Forest Riverbed Built-up Cropland Bare soil Bare rock Grassland OWL Total Wetland 426 0 10 6 159 2 20 1 6 33 2 426 Glacier 0 4500 7 0 0 0 0 0 1 1 0 0 Snow 1 1 4534 1 0 2 0 1 724 442 3 1 Forest 12 0 6 55978 2 11 1183 0 4 956 1093 12 Riverbed 171 0 0 3 1455 27 49 0 0 13 1 171 Built-up 0 0 1 0 0 253 0 0 0 1 0 0 Cropland 67 0 0 3710 20 438 34381 0 1 94 391 67 Bare soil 0 0 0 0 0 0 0 0 1 0 0 0 Bare rock 3 1 3450 1 1 8 0 10 6036 1353 5 3 Grassland 41 1 1201 1105 11 46 150 29 1542 16033 516 41 OWL 2 0 17 973 0 1 203 0 13 728 3371 2 Total 426 0 10 6 159 2 20 1 6 33 2 426
- 12. Where those changes are happening
- 13. Where those changes are happening
- 14. Where those changes are happening
- 15. Where those changes are happening
- 16. Where those changes are happening
- 17. Land cover omission and commission between LRMP and NLCMS
- 18. Point (87.5618, 26.6436) Land cover omission and commission between LRMP and NLCMS
- 19. Point (83.8104, 27.50572) Land cover omission and commission between LRMP and NLCMS
- 20. Land cover omission and commission between LRMP and NLCMS
- 21. Point (85.8174, 27.81202) ? Shrubland Cropland Land cover omission and commission between LRMP and NLCMS
- 22. Land cover omission and commission between LRMP and NLCMS
- 23. For what reason variation in waterbodies
- 24. For what reason variation in waterbodies
- 25. For what reason variation in snow
- 26. Accuracy assessment report of Nepal Land cover Source of points Number reference points Permanent sample plot 1700 Field visit 321 Collect earth online (CEO) 2000 Total 4021
- 27. Accuracy assessment report of Nepal Land cover (2019) Land cover wetland glacier snow forest riverbed built-up crop bare soil bare rock grassland owl Total Users accuracy (%) wetland 39 0 0 0 4 0 0 0 0 0 0 43 90.91 glacier 0 61 0 0 0 0 0 0 0 0 0 61 100.00 snow 0 0 133 0 0 0 0 0 12 0 0 145 91.72 forest 0 0 0 2306 0 1 0 0 0 12 2319 99.44 riverbed 1 0 0 0 30 0 0 0 0 3 1 35 85.71 built-up 0 0 0 1 0 30 0 0 0 0 0 31 96.77 crop 0 0 0 285 1 2 488 0 0 39 3 818 59.66 bare soil 0 0 0 0 0 0 0 12 4 0 0 16 75.00 bare rock 0 0 6 0 0 0 0 2 122 0 0 130 93.85 grassland 0 0 6 41 1 1 18 7 29 110 11 224 49.11 owl 0 0 0 118 0 0 1 0 0 1 79 199 39.70 Total 40 61 145 2751 36 33 508 21 167 153 106 4021 Producers accuracy (%) 97.50 100.00 91.72 83.82 83.33 90.91 96.06 57.14 73.05 71.90 74.53 Overall Classification Accuracy = 84.80% (2019) and 84.01% (2018) Overall Kappa Statistics = 0.7349
- 28. Accuracy assessment report of Nepal Land cover (IPPC) Overall classification accuracy = 89.21%% Overall Kappa Statistics = 0.7906 Land cover forest cropland grassland wetland built-up others Total Users accuracy (%) forest 2533 2 1 0 0 0 2536 99.88 cropland 274 488 39 1 2 0 804 60.70 grassland 48 18 110 1 1 42 220 50.00 wetland 1 0 3 74 0 0 78 94.87 built-up 1 0 0 0 30 0 31 96.77 others 0 0 0 0 0 352 352 100.00 Total 2857 508 153 76 33 394 4021 P. accuracy (%) 88.66 96.06 71.90 97.37 90.91 89.34
- 29. Key concerns and limitation
- 30. Key concerns and limitation
- 31. Key concerns and limitation
- 32. Key concerns and limitation Training and validation sample collection OWL
- 33. Thank you


