際際滷

際際滷Share a Scribd company logo
How to change figure to diagram
            Practical Insights
              Heesoo Lee
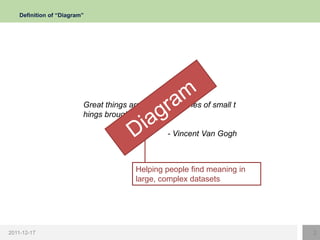
Definition of Diagram


                          Great things are done by a series of small t
                          hings brought together.

                                                  - Vincent Van Gogh


                                         Helping people find meaning in
                                         large, complex datasets


2011-12-17                                                                2
Examples of good diagram


2011-12-17                     3
Basic Ingredients: Types of Data


         Discrete(伎) items
         Continuous(一) items


2011-12-17                             4
Measuring the Ingredients  Nominal Scale


         覈覈 豌

                覈豺 覿 豌
                煙 讌讌 
              Ex. =1, =2


2011-12-17                                      5
Measuring the Ingredients  Ordinal Scale


          豌

               豸′   伎企 蟯螻襯 企 豌
              Ex. 螳, 譴,   3, 2, 1


2011-12-17                                      6
Measuring the Ingredients  Interval Scale


         螳蟆 豌

               豸′豺螳 螳蟆 覩碁ゼ 覿
               豸′螳 谿  觜蟲  襦 螳 伎
              Ex.  蟆曙, 20 30 谿 = 10


                                          谿瑚)  豺螳 狩讌 朱襦 螳螳 覩碁ゼ 螳, 螻煙 覦  覿螳


2011-12-17                                                                                  7
Measuring the Ingredients  Ratio Scale


         觜 豌

               焔 伎 覦一 谿願 螻る 豌
                 蠍一朱 覩襦 覈 , 糾 豌襴螳 螳
              Ex. 貅觜  蟆曙, 20 = 293.15属K


2011-12-17                                           8
Setting the Table: Data Types and Representative Forms


2011-12-17                                                   9
Setting the Table: Data Types and Representative Forms


         1. we tend to interpret size(especially bar size) as representing quantity.

         2. If we map measurements to color, we can perceive nominal or, at best,
            ordinal values, with a few discrete steps.


2011-12-17                                                                             10
Playing Well Together: Data, Visualizations, and People


2011-12-17                                                    11
Applying to examples


                           Source: http://inside.chosun.com/site/data/html_dir/2011/08/19/2011081900676.html


2011-12-17                                                                                                     12
The end of my presentation
                   Any Question?


    Source: http://uxmag.com/articles/winning-combinations-putting-data-and-design-together

More Related Content

Diagram

  • 1. How to change figure to diagram Practical Insights Heesoo Lee
  • 2. Definition of Diagram Great things are done by a series of small t hings brought together. - Vincent Van Gogh Helping people find meaning in large, complex datasets 2011-12-17 2
  • 3. Examples of good diagram 2011-12-17 3
  • 4. Basic Ingredients: Types of Data Discrete(伎) items Continuous(一) items 2011-12-17 4
  • 5. Measuring the Ingredients Nominal Scale 覈覈 豌 覈豺 覿 豌 煙 讌讌 Ex. =1, =2 2011-12-17 5
  • 6. Measuring the Ingredients Ordinal Scale 豌 豸′ 伎企 蟯螻襯 企 豌 Ex. 螳, 譴, 3, 2, 1 2011-12-17 6
  • 7. Measuring the Ingredients Interval Scale 螳蟆 豌 豸′豺螳 螳蟆 覩碁ゼ 覿 豸′螳 谿 觜蟲 襦 螳 伎 Ex. 蟆曙, 20 30 谿 = 10 谿瑚) 豺螳 狩讌 朱襦 螳螳 覩碁ゼ 螳, 螻煙 覦 覿螳 2011-12-17 7
  • 8. Measuring the Ingredients Ratio Scale 觜 豌 焔 伎 覦一 谿願 螻る 豌 蠍一朱 覩襦 覈 , 糾 豌襴螳 螳 Ex. 貅觜 蟆曙, 20 = 293.15属K 2011-12-17 8
  • 9. Setting the Table: Data Types and Representative Forms 2011-12-17 9
  • 10. Setting the Table: Data Types and Representative Forms 1. we tend to interpret size(especially bar size) as representing quantity. 2. If we map measurements to color, we can perceive nominal or, at best, ordinal values, with a few discrete steps. 2011-12-17 10
  • 11. Playing Well Together: Data, Visualizations, and People 2011-12-17 11
  • 12. Applying to examples Source: http://inside.chosun.com/site/data/html_dir/2011/08/19/2011081900676.html 2011-12-17 12
  • 13. The end of my presentation Any Question? Source: http://uxmag.com/articles/winning-combinations-putting-data-and-design-together