Disinformation Visualization

Introduction to a talk by Mushon Zer-Aviv at Pixelache in coordination with the Mushrooming Network and the Open Knowledge Festival. Designers, statisticians, journalists, researchers and technologists often apply visualization techniques in an attempt to make sense of large quantities of data. In this rush to create informational imagery both creators and viewers are often taken by the lure of what Edward Tufte defines as "beautiful evidence". But is information visualization indeed just another type of evidence, or is it a form of visual argument? In this workshop we will attempt to problematize and re-politicize the practice of information visualization by deliberately skewing and manipulating the image. We will show how a visualization pieces can easily undermine the data they are based on and tell any story their authors might choose. In the process we will survey several loopholes in information design methodologies and learn how they can be exploited. Participants are invited to bring their own data sets, statistics and quantifiable stories as a starting point towards a somewhat more sinister use of the information. Participants are also invited to base their projects on existing work and use it as an opportunity for reflection. The work produced in the workshop can take the form of a static image, a moving image, an interactive application, an installation or what not. It can be based on existing tools or be a whole new thing in itself. Prior skills in image making and code are a plus, but are not necessarily a per-requisite (if push comes to shove, you can always use PowerPoint). On the flip side, if you are skilled in the craft of infovis (code/form) you can apply to participate for free as a workshop assistant.


Disinformation Visualization
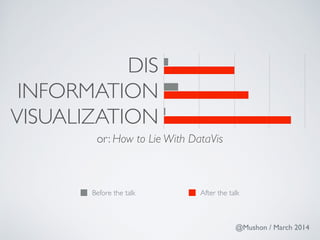
- 1. DIS INFORMATION VISUALIZATION or: How to Lie With DataVis Before the talk After the talk @Mushon / March 2014
- 5. Applied: I'd better stop the car Context: The traffic light I am driving towards has turned red Meaning: South facing traffic light on corner of Pitt and George streets has turned red Future Past WISDOM WISDOM KNOWLEDGE KNOWLEDGE INFORMATION INFORMATION DATA DATA Raw: Red
- 6. CONTENT / STRUCTURE / PRESENTATION
- 7. CONTENT / STRUCTURE / PRESENTATION
- 9. SHOULD THE KILLING OF BABIES BE LEGALIZED?
- 10. SHOULD ABORTION BE LEGAL?
- 11. SHOULD WOMEN HAVE THE RIGHT TO THEIR OWN BODIES?
- 13. WITH RESPECT TO THE ABORTION ISSUE, WOULD YOU CONSIDER YOURSELF TO BE PRO-CHOICE OR PRO-LIFE?
- 18. * From: ProLifeBlogs.com 2011-2012 Abortion Views - all ages 48% 50% 50% 46% 45% 43% 45% 47%
- 22. * Found on: Good.is
- 24. "delight both by the wonder of the spectacle and the accuracy of expression."
- 28. D! A! T! A AESTHETICS MESSAGE
- 29. A-POLITICAL! (dog hitting water makes a splash) DE-POLITICIZED! (correlation of race and socio-economics affects abortion rates) MESSAGE
- 32. GRAPHICS VISUAL LANGUAGE REALITY DATA
- 33. GRAPHICS VISUAL LANGUAGE REALITY DATA
- 34. GRAPHICS VISUAL LANGUAGE REALITY DATA
- 35. GRAPHICS VISUAL LANGUAGE REALITY OBJECTIVE / A-POLITICAL DATA
- 36. GRAPHICS REALITY OBJECTIVE / A-POLITICAL DATA
- 37. GRAPHICS REALITY OBJECTIVE / A-POLITICAL DATA
- 38. DISAMBIGUATION GRAPHICS REALITY OBJECTIVE / A-POLITICAL DATA
- 39. GRAPHICS REALITY OBJECTIVE / A-POLITICAL DATA
- 40. REAMBIGUATION GRAPHICS REALITY OBJECTIVE / A-POLITICAL DATA
- 42. aasen.in/github_globe/ S E A M L E S S
- 44. S E A M F U L uncommongoods.com/product/recycled-army-canvas-bean-bag-chair