Drawing-a-pie-chart-information-presentation1
- 2. Pi e char t s ar e a gr eat way t o show t he compar at i ve si zes of a set of dat a and now you can dr aw t hem your sel f by f ol l owi ng t hese st eps!
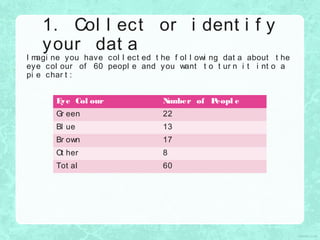
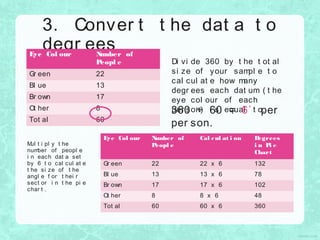
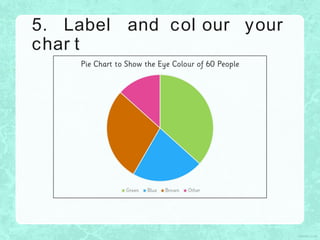
- 3. I magi ne you have col l ect ed t he f ol l owi ng dat a about t he eye col our of 60 peopl e and you want t o t ur n i t i nt o a pi e char t : 1. Col l ect or i dent i f y your dat a Eye Col our Number of Peopl e Gr een 22 Bl ue 13 Br own 17 Ot her 8 Tot al 60
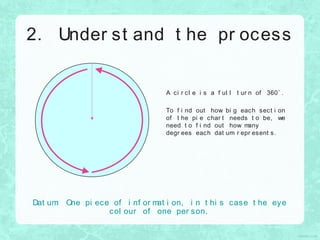
- 4. Dat um: One pi ece of i nf or mat i on, i n t hi s case t he eye col our of one per son. 2. Under st and t he pr ocess A ci r cl e i s a f ul l t ur n of 360? . To f i nd out how bi g each sect i on of t he pi e char t needs t o be, we need t o f i nd out how many degr ees each dat um r epr esent s.
- 5. Di vi de 360 by t he t ot al si ze of your sampl e t o cal cul at e how many degr ees each dat um ( t he eye col our of each per son) i s equal t o. 3. Conver t t he dat a t o degr ees 360 ¡Â 60 = 6? per per son. Eye Col our Number of Peopl e Gr een 22 Bl ue 13 Br own 17 Ot her 8 Tot al 60 Eye Col our Number of Peopl e Cal cul at i on Degrees i n Pi e Chart Gr een 22 22 x 6 132 Bl ue 13 13 x 6 78 Br own 17 17 x 6 102 Ot her 8 8 x 6 48 Tot al 60 60 x 6 360 Mul t i pl y t he number of peopl e i n each dat a set by 6 t o cal cul at e t he si ze of t he angl e f or t hei r sect or i n t he pi e char t .
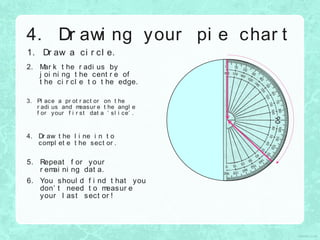
- 6. 1. Dr aw a ci r cl e. 4. Dr awi ng your pi e char t 2. Mar k t he r adi us by j oi ni ng t he cent r e of t he ci r cl e t o t he edge. 3. Pl ace a pr ot r act or on t he r adi us and measur e t he angl e f or your f i r st dat a ¡® sl i ce¡¯ . 4. Dr aw t he l i ne i n t o compl et e t he sect or . 5. Repeat f or your r emai ni ng dat a. 6. You shoul d f i nd t hat you don¡¯ t need t o measur e your l ast sect or !
- 7. 5. Label and col our your char t
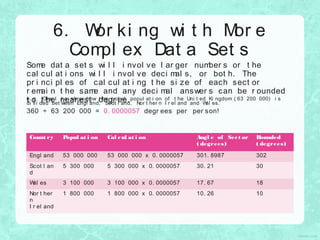
- 8. 6. Wor ki ng wi t h Mor e Compl ex Dat a Set s Some dat a set s wi l l i nvol ve l ar ger number s or t he cal cul at i ons wi l l i nvol ve deci mal s, or bot h. The pr i nci pl es of cal cul at i ng t he si ze of each sect or r emai n t he same and any deci mal answer s can be r ounded t o t he near est degr ee.e. g. Char t t o show how t he t ot al popul at i on of t he Uni t ed Ki ngdom ( 63 200 000) i s di vi ded bet ween Engl and, Scot l and, Nor t her n I r el and and Wal es. 360 ¡Â 63 200 000 = 0. 0000057 degr ees per per son! Count ry Popul at i on Cal cul at i on Angl e of Sect or ( degrees) Rounded ( degrees) Engl and 53 000 000 53 000 000 x 0. 0000057 301. 8987 302 Scot l an d 5 300 000 5 300 000 x 0. 0000057 30. 21 30 Wal es 3 100 000 3 100 000 x 0. 0000057 17. 67 18 Nor t her n I r el and 1 800 000 1 800 000 x 0. 0000057 10. 26 10
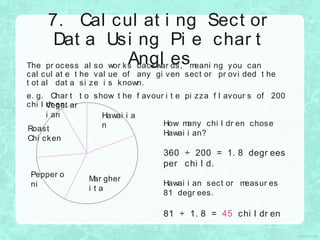
- 9. 7. Cal cul at i ng Sect or Dat a Usi ng Pi e char t Angl esThe pr ocess al so wor ks backwar ds, meani ng you can cal cul at e t he val ue of any gi ven sect or pr ovi ded t he t ot al dat a si ze i s known. e. g. Char t t o show t he f avour i t e pi zza f l avour s of 200 chi l dr en. How many chi l dr en chose Hawai i an? 360 ¡Â 200 = 1. 8 degr ees per chi l d. Hawai i an sect or measur es 81 degr ees. 81 ¡Â 1. 8 = 45 chi l dr en Veget ar i an Hawai i a n Mar gher i t a Pepper o ni Roast Chi cken
- 10. Success Cri t eri a Ai m Success Cri t eri a Ai m I know how t o dr aw a pi e char t f r om a gi ven set of dat a. ? I know whi ch cal cul at i ons wi l l gi ve me t he cor r ect angl es f or each of my sect or s. ? I can use a pr ot r act or t o const r uct t he angl es r equi r ed by my pi e char t .

