Dtrace Overview
6 likes925 views

The document discusses the DTrace framework, which is a tool for dynamic instrumentation and analysis of live systems. It allows inspection of all parts of a system without slowing it down. The DTrace framework includes probes throughout the operating system and user programs, a D programming language, and a toolkit of scripts for common tasks like analyzing CPU, memory, network and disk usage. A demo shows example scripts for tasks like monitoring system calls and web server performance.
![SYSTEM INSPECTION AND ANALYSIS
D LANGUAGE : AGGREGATIONS
@name[keys] = aggfunction(args)
âĒ Used to aggregate data and look for trends
âĒ Simple to generate report about :
âĒ Total system calls by a process or an application
âĒ Total number of read or write by process
âĒ Aggregating functions: âĒ count() âĒ min()
âĒ sum() âĒ max()
âĒ avg() âĒ quantize()
20
COPYRIGHT ÂĐ 2011 ALCATEL-LUCENT. ALL RIGHTS RESERVED.](https://image.slidesharecdn.com/dtraceoverview-120703153701-phpapp01/85/Dtrace-Overview-20-320.jpg)

Dtrace Overview
- 1. DTRACE Overview JÃĐrÃīme Gauthier May 2011 COPYRIGHT ÂĐ 2011 ALCATEL-LUCENT. ALL RIGHTS RESERVED.
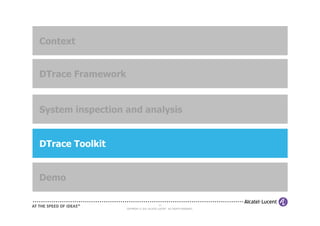
- 2. AGENDA 1. Context 2. DTrace Framework 3. System inspection and analysis 4. DTrace Toolkit 5. Demo 2 COPYRIGHT ÂĐ 2011 ALCATEL-LUCENT. ALL RIGHTS RESERVED.
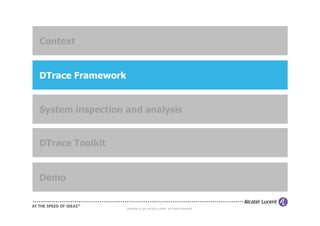
- 3. Context DTrace Framework System inspection and analysis DTrace Toolkit Demo 3 COPYRIGHT ÂĐ 2011 ALCATEL-LUCENT. ALL RIGHTS RESERVED.
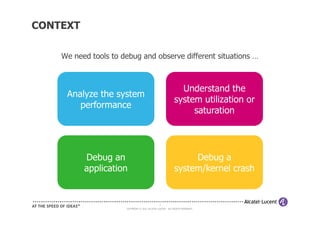
- 4. CONTEXT We need tools to debug and observe different situations âĶ Understand the Analyze the system system utilization or performance saturation Debug an Debug a application system/kernel crash 4 COPYRIGHT ÂĐ 2011 ALCATEL-LUCENT. ALL RIGHTS RESERVED.
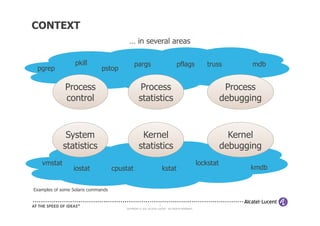
- 5. CONTEXT âĶ in several areas pkill pargs pflags truss mdb pgrep pstop Process Process Process control statistics debugging System Kernel Kernel statistics statistics debugging vmstat lockstat iostat cpustat kstat kmdb Examples of some Solaris commands 5 COPYRIGHT ÂĐ 2011 ALCATEL-LUCENT. ALL RIGHTS RESERVED.
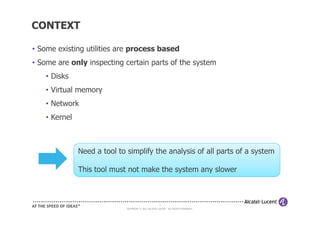
- 6. CONTEXT âĒ Some existing utilities are process based âĒ Some are only inspecting certain parts of the system âĒ Disks âĒ Virtual memory âĒ Network âĒ Kernel Need a tool to simplify the analysis of all parts of a system This tool must not make the system any slower 6 COPYRIGHT ÂĐ 2011 ALCATEL-LUCENT. ALL RIGHTS RESERVED.
- 7. Context DTrace Framework System inspection and analysis DTrace Toolkit Demo 7 COPYRIGHT ÂĐ 2011 ALCATEL-LUCENT. ALL RIGHTS RESERVED.
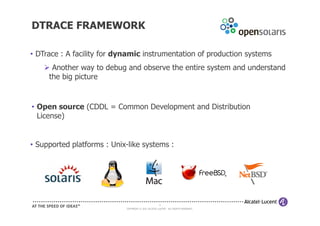
- 8. DTRACE FRAMEWORK âĒ DTrace : A facility for dynamic instrumentation of production systems Another way to debug and observe the entire system and understand the big picture âĒ Open source (CDDL = Common Development and Distribution License) âĒ Supported platforms : Unix-like systems : 8 COPYRIGHT ÂĐ 2011 ALCATEL-LUCENT. ALL RIGHTS RESERVED.
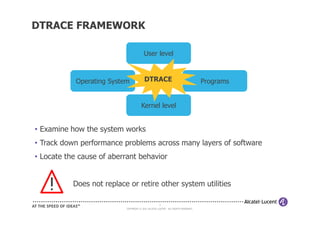
- 9. DTRACE FRAMEWORK User level Operating System DTRACE Programs Kernel level âĒ Examine how the system works âĒ Track down performance problems across many layers of software âĒ Locate the cause of aberrant behavior Does not replace or retire other system utilities 9 COPYRIGHT ÂĐ 2011 ALCATEL-LUCENT. ALL RIGHTS RESERVED.
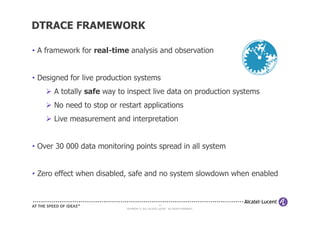
- 10. DTRACE FRAMEWORK âĒ A framework for real-time analysis and observation âĒ Designed for live production systems A totally safe way to inspect live data on production systems No need to stop or restart applications Live measurement and interpretation âĒ Over 30 000 data monitoring points spread in all system âĒ Zero effect when disabled, safe and no system slowdown when enabled 10 COPYRIGHT ÂĐ 2011 ALCATEL-LUCENT. ALL RIGHTS RESERVED.
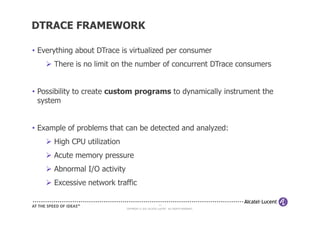
- 11. DTRACE FRAMEWORK âĒ Everything about DTrace is virtualized per consumer There is no limit on the number of concurrent DTrace consumers âĒ Possibility to create custom programs to dynamically instrument the system âĒ Example of problems that can be detected and analyzed: High CPU utilization Acute memory pressure Abnormal I/O activity Excessive network traffic 11 COPYRIGHT ÂĐ 2011 ALCATEL-LUCENT. ALL RIGHTS RESERVED.
- 12. Context DTrace Framework System inspection and analysis DTrace Toolkit Demo 12 COPYRIGHT ÂĐ 2011 ALCATEL-LUCENT. ALL RIGHTS RESERVED.
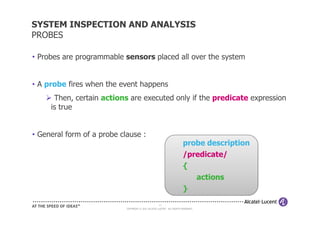
- 13. SYSTEM INSPECTION AND ANALYSIS PROBES âĒ Probes are programmable sensors placed all over the system âĒ A probe fires when the event happens Then, certain actions are executed only if the predicate expression is true âĒ General form of a probe clause : probe description /predicate/ { actions } 13 COPYRIGHT ÂĐ 2011 ALCATEL-LUCENT. ALL RIGHTS RESERVED.
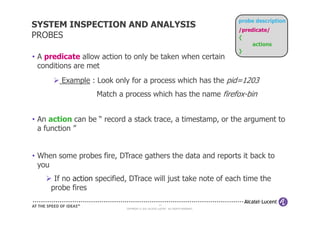
- 14. probe description SYSTEM INSPECTION AND ANALYSIS /predicate/ PROBES { actions } âĒ A predicate allow action to only be taken when certain conditions are met Example : Look only for a process which has the pid=1203 Match a process which has the name firefox-bin âĒ An action can be â record a stack trace, a timestamp, or the argument to a function â âĒ When some probes fire, DTrace gathers the data and reports it back to you If no action specified, DTrace will just take note of each time the probe fires 14 COPYRIGHT ÂĐ 2011 ALCATEL-LUCENT. ALL RIGHTS RESERVED.
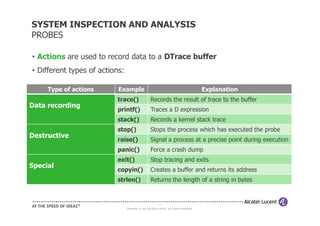
- 15. SYSTEM INSPECTION AND ANALYSIS PROBES âĒ Actions are used to record data to a DTrace buffer âĒ Different types of actions: Type of actions Example Explanation trace() Records the result of trace to the buffer Data recording printf() Traces a D expression stack() Records a kernel stack trace stop() Stops the process which has executed the probe Destructive raise() Signal a process at a precise point during execution panic() Force a crash dump exit() Stop tracing and exits Special copyin() Creates a buffer and returns its address strlen() Returns the length of a string in bytes 15 COPYRIGHT ÂĐ 2011 ALCATEL-LUCENT. ALL RIGHTS RESERVED.
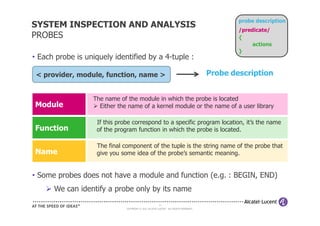
- 16. probe description SYSTEM INSPECTION AND ANALYSIS /predicate/ PROBES { actions } âĒ Each probe is uniquely identified by a 4-tuple : < provider, module, function, name > Probe description The name of the module in which the probe is located Module Either the name of a kernel module or the name of a user library If this probe correspond to a specific program location, itâs the name Function of the program function in which the probe is located. The final component of the tuple is the string name of the probe that Name give you some idea of the probeâs semantic meaning. âĒ Some probes does not have a module and function (e.g. : BEGIN, END) We can identify a probe only by its name 16 COPYRIGHT ÂĐ 2011 ALCATEL-LUCENT. ALL RIGHTS RESERVED.
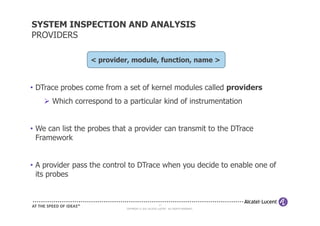
- 17. SYSTEM INSPECTION AND ANALYSIS PROVIDERS < provider, module, function, name > âĒ DTrace probes come from a set of kernel modules called providers Which correspond to a particular kind of instrumentation âĒ We can list the probes that a provider can transmit to the DTrace Framework âĒ A provider pass the control to DTrace when you decide to enable one of its probes 17 COPYRIGHT ÂĐ 2011 ALCATEL-LUCENT. ALL RIGHTS RESERVED.
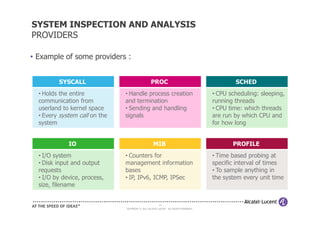
- 18. SYSTEM INSPECTION AND ANALYSIS PROVIDERS âĒ Example of some providers : SYSCALL PROC SCHED âĒ Holds the entire âĒ Handle process creation âĒ CPU scheduling: sleeping, communication from and termination running threads userland to kernel space âĒ Sending and handling âĒ CPU time: which threads âĒ Every system call on the signals are run by which CPU and system for how long IO MIB PROFILE âĒ I/O system âĒ Counters for âĒ Time based probing at âĒ Disk input and output management information specific interval of times requests bases âĒ To sample anything in âĒ I/O by device, process, âĒ IP, IPv6, ICMP, IPSec the system every unit time size, filename 18 COPYRIGHT ÂĐ 2011 ALCATEL-LUCENT. ALL RIGHTS RESERVED.
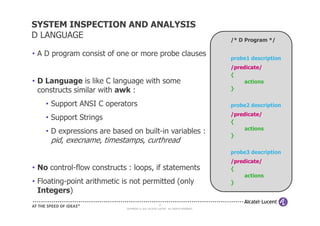
- 19. SYSTEM INSPECTION AND ANALYSIS D LANGUAGE /* D Program */ âĒ A D program consist of one or more probe clauses probe1 description /predicate/ { âĒ D Language is like C language with some actions constructs similar with awk : } âĒ Support ANSI C operators probe2 description /predicate/ âĒ Support Strings { actions âĒ D expressions are based on built-in variables : } pid, execname, timestamps, curthread probe3 description /predicate/ âĒ No control-flow constructs : loops, if statements { actions âĒ Floating-point arithmetic is not permitted (only } Integers) 19 COPYRIGHT ÂĐ 2011 ALCATEL-LUCENT. ALL RIGHTS RESERVED.
- 20. SYSTEM INSPECTION AND ANALYSIS D LANGUAGE : AGGREGATIONS @name[keys] = aggfunction(args) âĒ Used to aggregate data and look for trends âĒ Simple to generate report about : âĒ Total system calls by a process or an application âĒ Total number of read or write by process âĒ Aggregating functions: âĒ count() âĒ min() âĒ sum() âĒ max() âĒ avg() âĒ quantize() 20 COPYRIGHT ÂĐ 2011 ALCATEL-LUCENT. ALL RIGHTS RESERVED.
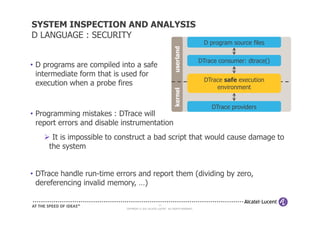
- 21. SYSTEM INSPECTION AND ANALYSIS D LANGUAGE : SECURITY D program source files userland DTrace consumer: dtrace() âĒ D programs are compiled into a safe intermediate form that is used for DTrace safe execution execution when a probe fires environment kernel DTrace providers âĒ Programming mistakes : DTrace will report errors and disable instrumentation It is impossible to construct a bad script that would cause damage to the system âĒ DTrace handle run-time errors and report them (dividing by zero, dereferencing invalid memory, âĶ) 21 COPYRIGHT ÂĐ 2011 ALCATEL-LUCENT. ALL RIGHTS RESERVED.
- 22. Context DTrace Framework System inspection and analysis DTrace Toolkit Demo 22 COPYRIGHT ÂĐ 2011 ALCATEL-LUCENT. ALL RIGHTS RESERVED.
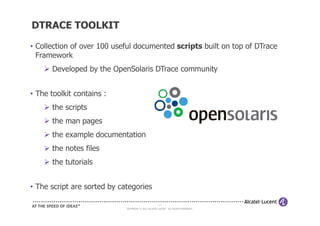
- 23. DTRACE TOOLKIT âĒ Collection of over 100 useful documented scripts built on top of DTrace Framework Developed by the OpenSolaris DTrace community âĒ The toolkit contains : the scripts the man pages the example documentation the notes files the tutorials âĒ The script are sorted by categories 23 COPYRIGHT ÂĐ 2011 ALCATEL-LUCENT. ALL RIGHTS RESERVED.
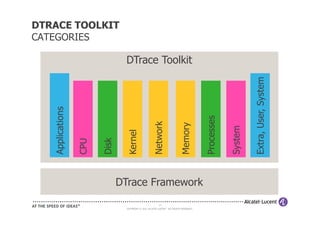
- 24. DTRACE TOOLKIT CATEGORIES DTrace Toolkit Extra, User, System Applications Processes Network Memory System Kernel Disk CPU DTrace Framework 24 COPYRIGHT ÂĐ 2011 ALCATEL-LUCENT. ALL RIGHTS RESERVED.
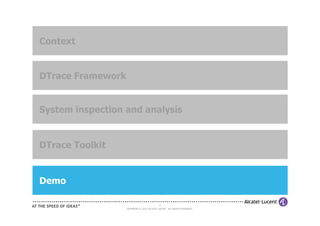
- 25. Context DTrace Framework System inspection and analysis DTrace Toolkit Demo 25 COPYRIGHT ÂĐ 2011 ALCATEL-LUCENT. ALL RIGHTS RESERVED.
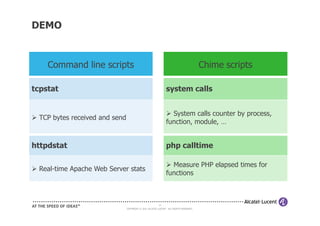
- 26. DEMO Command line scripts Chime scripts tcpstat system calls System calls counter by process, TCP bytes received and send function, module, âĶ httpdstat php calltime Measure PHP elapsed times for Real-time Apache Web Server stats functions 26 COPYRIGHT ÂĐ 2011 ALCATEL-LUCENT. ALL RIGHTS RESERVED.
- 27. Questions? jerome.gauthier@alcatel-lucent.com 27 COPYRIGHT ÂĐ 2011 ALCATEL-LUCENT. ALL RIGHTS RESERVED.
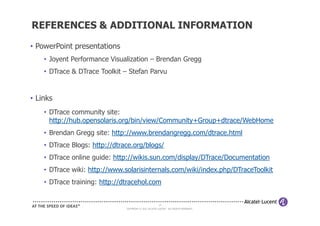
- 28. REFERENCES & ADDITIONAL INFORMATION âĒ PowerPoint presentations âĒ Joyent Performance Visualization â Brendan Gregg âĒ DTrace & DTrace Toolkit â Stefan Parvu âĒ Links âĒ DTrace community site: http://hub.opensolaris.org/bin/view/Community+Group+dtrace/WebHome âĒ Brendan Gregg site: http://www.brendangregg.com/dtrace.html âĒ DTrace Blogs: http://dtrace.org/blogs/ âĒ DTrace online guide: http://wikis.sun.com/display/DTrace/Documentation âĒ DTrace wiki: http://www.solarisinternals.com/wiki/index.php/DTraceToolkit âĒ DTrace training: http://dtracehol.com 28 COPYRIGHT ÂĐ 2011 ALCATEL-LUCENT. ALL RIGHTS RESERVED.
- 29. 29 COPYRIGHT ÂĐ 2011 ALCATEL-LUCENT. ALL RIGHTS RESERVED.