Eclipse Visualization and Performance Monitoring
ŌĆó
0 likesŌĆó163 views

Overview of a couple of custom-built tools to analyze, visualize, and optimize large Java applications, such as Eclipse and WebSphere.


Eclipse Visualization and Performance Monitoring
- 1. Colorado Software Summit: October 24 ŌĆō 29, 2004 ┬® Copyright 2004, IBM Corporation Chris Laffra ŌĆö Eclipse Visualization and Performance Monitoring Page 1 Eclipse Visualization and Performance Monitoring Chris Laffra IBM Ottawa Labs http://eclipsefaq.org/chris
- 2. Colorado Software Summit: October 24 ŌĆō 29, 2004 ┬® Copyright 2004, IBM Corporation Chris Laffra ŌĆö Eclipse Visualization and Performance Monitoring Page 2 Roadmap Introduction Introspection Java Spider Visualization Profiling Conclusions
- 3. Colorado Software Summit: October 24 ŌĆō 29, 2004 ┬® Copyright 2004, IBM Corporation Chris Laffra ŌĆö Eclipse Visualization and Performance Monitoring Page 3 Introduction Eclipse is a massive framework Learning curve may be steep How to make sense from 100s of plug-ins Key to understanding performance are insights into operating systems, Java language, and all constructs above Management of limited resources
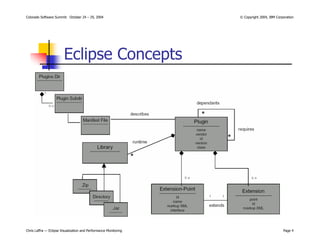
- 4. Colorado Software Summit: October 24 ŌĆō 29, 2004 ┬® Copyright 2004, IBM Corporation Chris Laffra ŌĆö Eclipse Visualization and Performance Monitoring Page 4 Eclipse Concepts
- 5. Colorado Software Summit: October 24 ŌĆō 29, 2004 ┬® Copyright 2004, IBM Corporation Chris Laffra ŌĆö Eclipse Visualization and Performance Monitoring Page 5 Introspection To find out what happens in Eclipse, use: The platform core tools: ŌĆó www.developerworks.ibm.com search for ŌĆśKehnŌĆÖ A debugger and step into and over methods Insert System.out.println() calls A Java profiler based on JVMPI ŌĆó JProbe/Yourkit/Hyades/XRay, etc. A tool/classloader that instruments bytecodes ŌĆó AOSD: weave in a concern ŌĆó Eclipse monitor based on JikesBT (IBM alphaworks)
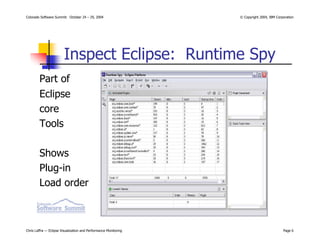
- 6. Colorado Software Summit: October 24 ŌĆō 29, 2004 ┬® Copyright 2004, IBM Corporation Chris Laffra ŌĆö Eclipse Visualization and Performance Monitoring Page 6 Inspect Eclipse: Runtime Spy Part of Eclipse core Tools Shows Plug-in Load order
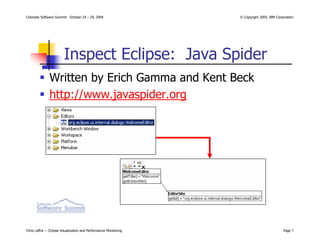
- 7. Colorado Software Summit: October 24 ŌĆō 29, 2004 ┬® Copyright 2004, IBM Corporation Chris Laffra ŌĆö Eclipse Visualization and Performance Monitoring Page 7 Inspect Eclipse: Java Spider Written by Erich Gamma and Kent Beck http://www.javaspider.org
- 8. Colorado Software Summit: October 24 ŌĆō 29, 2004 ┬® Copyright 2004, IBM Corporation Chris Laffra ŌĆö Eclipse Visualization and Performance Monitoring Page 8 Profiling: JVMPI and JVMTI JVMPI ŌĆō Java VM Profiling Interface VM runs slower ŌĆō less aggressive JIT Must be able to generate events on demand JVMPI agent can turn on/off any event at will Makes VM design less clean JVMTI ŌĆō Java VM Testing Interface Uses bytecode instrumentation done by VM Choose ahead of time what you want to trace Clean VM design May completely confuse JIT
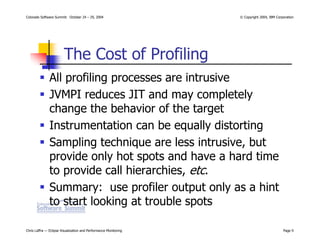
- 9. Colorado Software Summit: October 24 ŌĆō 29, 2004 ┬® Copyright 2004, IBM Corporation Chris Laffra ŌĆö Eclipse Visualization and Performance Monitoring Page 9 The Cost of Profiling All profiling processes are intrusive JVMPI reduces JIT and may completely change the behavior of the target Instrumentation can be equally distorting Sampling technique are less intrusive, but provide only hot spots and have a hard time to provide call hierarchies, etc. Summary: use profiler output only as a hint to start looking at trouble spots
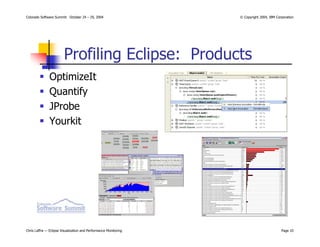
- 10. Colorado Software Summit: October 24 ŌĆō 29, 2004 ┬® Copyright 2004, IBM Corporation Chris Laffra ŌĆö Eclipse Visualization and Performance Monitoring Page 10 Profiling Eclipse: Products OptimizeIt Quantify JProbe Yourkit
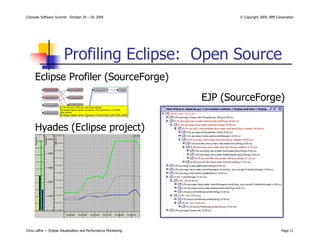
- 11. Colorado Software Summit: October 24 ŌĆō 29, 2004 ┬® Copyright 2004, IBM Corporation Chris Laffra ŌĆö Eclipse Visualization and Performance Monitoring Page 11 Profiling Eclipse: Open Source Eclipse Profiler (SourceForge) EJP (SourceForge) Hyades (Eclipse project)
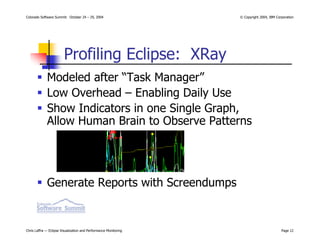
- 12. Colorado Software Summit: October 24 ŌĆō 29, 2004 ┬® Copyright 2004, IBM Corporation Chris Laffra ŌĆö Eclipse Visualization and Performance Monitoring Page 12 Profiling Eclipse: XRay Modeled after ŌĆ£Task ManagerŌĆØ Low Overhead ŌĆō Enabling Daily Use Show Indicators in one Single Graph, Allow Human Brain to Observe Patterns Generate Reports with Screendumps
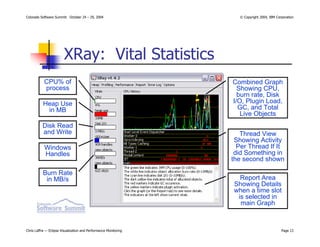
- 13. Colorado Software Summit: October 24 ŌĆō 29, 2004 ┬® Copyright 2004, IBM Corporation Chris Laffra ŌĆö Eclipse Visualization and Performance Monitoring Page 13 XRay: Vital Statistics CPU% of process Heap Use in MB Disk Read and Write Windows Handles Burn Rate in MB/s Combined Graph Showing CPU, burn rate, Disk I/O, Plugin Load, GC, and Total Live Objects Thread View Showing Activity Per Thread If It did Something in the second shown Report Area Showing Details when a time slot is selected in main Graph
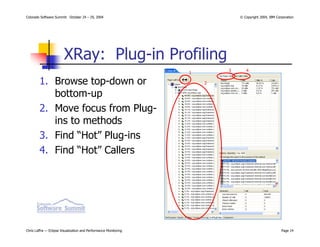
- 14. Colorado Software Summit: October 24 ŌĆō 29, 2004 ┬® Copyright 2004, IBM Corporation Chris Laffra ŌĆö Eclipse Visualization and Performance Monitoring Page 14 XRay: Plug-in Profiling 1 2 3 4 7 1. Browse top-down or bottom-up 2. Move focus from Plug- ins to methods 3. Find ŌĆ£HotŌĆØ Plug-ins 4. Find ŌĆ£HotŌĆØ Callers
- 15. Colorado Software Summit: October 24 ŌĆō 29, 2004 ┬® Copyright 2004, IBM Corporation Chris Laffra ŌĆö Eclipse Visualization and Performance Monitoring Page 15 XRay: Plug-in Profiling Data sorted on a plug-in level so a user can more easily identify their code Two modes of drilling down: Find out for a given plug-in who is calling you Find out all the plug-ins called by your plug-in Search methods by name and top 1000 Data: CPU time, #calls, #news, #classloads, bytes read, bytes written
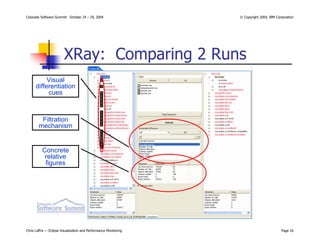
- 16. Colorado Software Summit: October 24 ŌĆō 29, 2004 ┬® Copyright 2004, IBM Corporation Chris Laffra ŌĆö Eclipse Visualization and Performance Monitoring Page 16 XRay: Comparing 2 Runs Visual differentiation cues Filtration mechanism Concrete relative figures
- 17. Colorado Software Summit: October 24 ŌĆō 29, 2004 ┬® Copyright 2004, IBM Corporation Chris Laffra ŌĆö Eclipse Visualization and Performance Monitoring Page 17 XRay: Finding Methods Enter ŌĆśActionSetŌĆÖ Finds all methods and sorts by CPU Clicking on a result to show method in Profile Tree and Method Details.
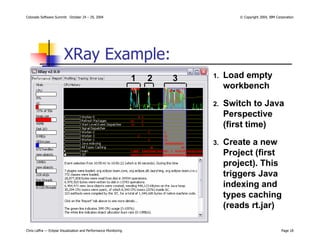
- 18. Colorado Software Summit: October 24 ŌĆō 29, 2004 ┬® Copyright 2004, IBM Corporation Chris Laffra ŌĆö Eclipse Visualization and Performance Monitoring Page 18 XRay Example: 1. Load empty workbench 2. Switch to Java Perspective (first time) 3. Create a new Project (first project). This triggers Java indexing and types caching (reads rt.jar) 1 . 2 . 3 .
- 19. Colorado Software Summit: October 24 ŌĆō 29, 2004 ┬® Copyright 2004, IBM Corporation Chris Laffra ŌĆö Eclipse Visualization and Performance Monitoring Page 19 Visualization Experience has shown that best technique is to use bytecode instrumentation Approach is special classloader that takes bytecodes and inserts extra code Could use BCEL, JikesBT, or other tools Need to cache the result to improve startup time for future runs May need a process to instrument all Eclipse
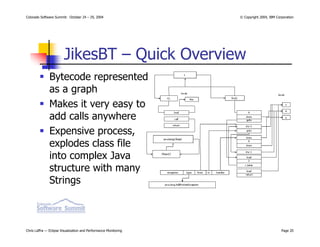
- 20. Colorado Software Summit: October 24 ŌĆō 29, 2004 ┬® Copyright 2004, IBM Corporation Chris Laffra ŌĆö Eclipse Visualization and Performance Monitoring Page 20 JikesBT ŌĆō Quick Overview Bytecode represented as a graph Makes it very easy to add calls anywhere Expensive process, explodes class file into complex Java structure with many Strings
- 21. Colorado Software Summit: October 24 ŌĆō 29, 2004 ┬® Copyright 2004, IBM Corporation Chris Laffra ŌĆö Eclipse Visualization and Performance Monitoring Page 21 Interesting Events? Entering a method Value of method parameters Creation of new objects Call to a method which is known to be outside of instrumented code Leaving a method (with return value)
- 22. Colorado Software Summit: October 24 ŌĆō 29, 2004 ┬® Copyright 2004, IBM Corporation Chris Laffra ŌĆö Eclipse Visualization and Performance Monitoring Page 22 Applet Dashboard Example Hijack the IE AppletClassloader Add ability to suspend, kill, trace, and rehost them Weave in concern to detect network access
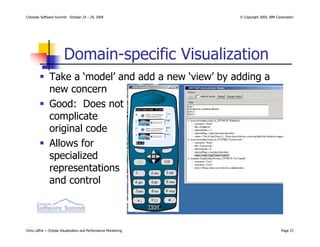
- 23. Colorado Software Summit: October 24 ŌĆō 29, 2004 ┬® Copyright 2004, IBM Corporation Chris Laffra ŌĆö Eclipse Visualization and Performance Monitoring Page 23 Domain-specific Visualization Take a ŌĆśmodelŌĆÖ and add a new ŌĆśviewŌĆÖ by adding a new concern Good: Does not complicate original code Allows for specialized representations and control
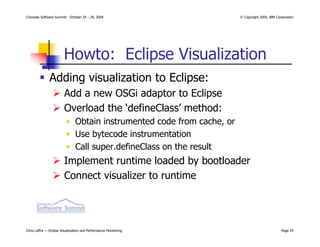
- 24. Colorado Software Summit: October 24 ŌĆō 29, 2004 ┬® Copyright 2004, IBM Corporation Chris Laffra ŌĆö Eclipse Visualization and Performance Monitoring Page 24 Howto: Eclipse Visualization Adding visualization to Eclipse: Add a new OSGi adaptor to Eclipse Overload the ŌĆśdefineClassŌĆÖ method: ŌĆó Obtain instrumented code from cache, or ŌĆó Use bytecode instrumentation ŌĆó Call super.defineClass on the result Implement runtime loaded by bootloader Connect visualizer to runtime
- 25. Colorado Software Summit: October 24 ŌĆō 29, 2004 ┬® Copyright 2004, IBM Corporation Chris Laffra ŌĆö Eclipse Visualization and Performance Monitoring Page 25 Eclipse Visualization Showing Plug-ins when they are loaded Indicate activity and interaction between plug-ins Light-weight, little overhead Allows for drilling down into specific plug-ins
- 26. Colorado Software Summit: October 24 ŌĆō 29, 2004 ┬® Copyright 2004, IBM Corporation Chris Laffra ŌĆö Eclipse Visualization and Performance Monitoring Page 26 Eclipse Visualization 1. Filter plug-ins to show methods traces 2. See time stamps 3. Method names 4. Argument values 5. Call to other plug-ins 6. Object creation 7. Return values
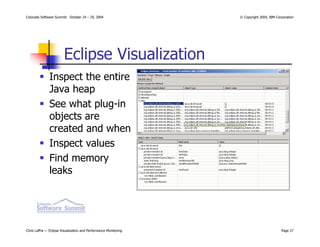
- 27. Colorado Software Summit: October 24 ŌĆō 29, 2004 ┬® Copyright 2004, IBM Corporation Chris Laffra ŌĆö Eclipse Visualization and Performance Monitoring Page 27 Eclipse Visualization Inspect the entire Java heap See what plug-in objects are created and when Inspect values Find memory leaks
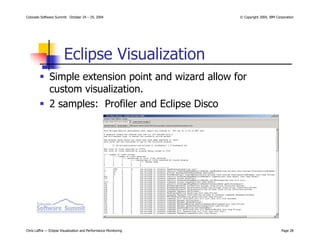
- 28. Colorado Software Summit: October 24 ŌĆō 29, 2004 ┬® Copyright 2004, IBM Corporation Chris Laffra ŌĆö Eclipse Visualization and Performance Monitoring Page 28 Eclipse Visualization Simple extension point and wizard allow for custom visualization. 2 samples: Profiler and Eclipse Disco
- 29. Colorado Software Summit: October 24 ŌĆō 29, 2004 ┬® Copyright 2004, IBM Corporation Chris Laffra ŌĆö Eclipse Visualization and Performance Monitoring Page 29 Performance Tips Use the right tools: Profiler, instrumentation, or System.out Be Lazy: Avoid ŌĆ£touchingŌĆØ plug-ins, classes and static initializers (avoid class loading) Avoid doing things until you really have to Some things are much slower than others DonŌĆÖt go overboard (use 90/10 rule & focus) Most importantly: DonŌĆÖt over-generalize!!!
- 30. Colorado Software Summit: October 24 ŌĆō 29, 2004 ┬® Copyright 2004, IBM Corporation Chris Laffra ŌĆö Eclipse Visualization and Performance Monitoring Page 30 Slow Things in Eclipse/Java Bad Algorithms. Linear Algorithms. Deep recursion (due to Java stack) Things like Hashtable/Vector (synchronized). Use HashMap/ArrayList instead Class Loading and Initialization Lots of object creation/garbage collection I/O (buffer your reading/writing). Always test on a ŌĆścoldŌĆÖ disk.
- 31. Colorado Software Summit: October 24 ŌĆō 29, 2004 ┬® Copyright 2004, IBM Corporation Chris Laffra ŌĆö Eclipse Visualization and Performance Monitoring Page 31 Slow Things in Eclipse/Java Method calls (compared to Field access) Flexible, object-oriented architectures (do you really need that design pattern here?) JNI calls (calling them, not running them) Complex UIs (avoid multiple refreshes) ŌĆō GEF is known for deeply recursive layout Too many threads
- 32. Colorado Software Summit: October 24 ŌĆō 29, 2004 ┬® Copyright 2004, IBM Corporation Chris Laffra ŌĆö Eclipse Visualization and Performance Monitoring Page 32 Fast Things in Eclipse/Java Local variables, fields, loops, arrays Exception clauses (try-catch) Small code Running JNI calls or native (AOT) code Native widgets (think SWT vs. Swing) Anything that avoids class loading (plug-in activation, and disk access) Fastest code is code that is not executed
- 33. Colorado Software Summit: October 24 ŌĆō 29, 2004 ┬® Copyright 2004, IBM Corporation Chris Laffra ŌĆö Eclipse Visualization and Performance Monitoring Page 33 Final Wise Words ŌĆ£Simplicity and elegance are unpopular because they require hard work and discipline to achieve and education to be appreciated.ŌĆØ -- Edsger Dijkstra
- 34. Colorado Software Summit: October 24 ŌĆō 29, 2004 ┬® Copyright 2004, IBM Corporation Chris Laffra ŌĆö Eclipse Visualization and Performance Monitoring Page 34 References http://eclipse.org http://eclipsefaq.org