Emerging Trends In Data Analysis And Visualisation
- 1. EMERGING TRENDS IN DATA ANALYSIS AND VISUALISATION
- 2. Why Data VisualizationBrings patterns, trends and exceptions to lightLeverages human visual systems highly tuned ability to see patterns, spot trends and identify outliersReplaces cognitive calculations with simple perceptual inferencesImproves comprehension, memory and decision makingEngages more diverse audience in exploration and analysis 2
- 3. Food Expenditure for 1 Week: Germany (US$ 500.07) Ecuador (US$ 31.55)A picture is often worth a thousand words, or in our case, a thousand rows of dataSource: http://relevantmagazine.com/releblog/revolution/what-we-eat3
- 4. Data Visualization MarketThe Data Visualization Market is growing rapidly with many of the large IT companies jumping in.While large companies such as SAP and IBM have only 5% of their current revenues from data visualization solutions, smaller companies such as Dundas, QlikTech, Lyzasoft, and SiSense have a majority of their revenues from data visualization.Clearly, it is a growing market with immense potential.4
- 5. Data Visualization Market: The VendorsBusiness intelligence vendorsVendors such as Business Objects, Cognos, Hyperion, IBM, Microsoft, Oracle, and SAS integrate basic charting visualization functionality into their query and analysis, scorecard, and dashboard applicationsprovide basic charting and dashboard functionality as well as some level of interactive visualization5
- 6. Data Visualization Market: The VendorsSpecialized visualization vendorsVendors such as Advanced Visual Systems, SGI, and Advizor Solutions extend the range of basic charting and scorecards with leading advanced-visualization applications6
- 7. Tools for Data VisualizationGliffy helps create and share flowcharts, network diagrams, floorplans, user interface designs and other drawings onlineGraphvizhas several main graph layout programs, web and interactive graphical interfacesFlyCharts creates flash-based compact, interactive, good-looking chartsAnychartis a Flash based solution that helps create interactive flash charts7
- 8. Tools for Data VisualizationPrefuse Visualization is a Java-based toolkit for programming of applications with integrated data visualization methods Axiisprovides both pre-built visualization components as well as abstract layout patternsDegrafa is a graphics framework for creating rich user interfaces, data visualization, mapping, graphicsChronoscope helps visualize millions of points of dataFusionChartsoffers a wide variety of 2D/3D chart typesGoogle Chart API lets you dynamically generate charts8
- 9. Tools for Data VisualizationIBM ILOG Elixir helps enhance data visualization within Flex and AIR applicationsTelerik Charts offers rich functionality and data presentation capabilities.Microsoft Silverlight comes with the bar, line, pie, column, and scatter chartsVisifire is a set of open source data visualization controls - powered by Microsoft Silverlight Dundasoffers a number of data visualization tools including: Chart, Gauge, Map and Calendar for .net and Dashboards for Silverlight9
- 10. Tools for Data VisualizationOmniGraffle is the diagramming application for Mac OS X. It creates flow charts, network diagrams, project processes, office layouts ŌĆō or anything else that can be represented by symbols and linesMicrosoft Visio is abusiness and technical diagramming program solves every problem related to data visualisationMindjet Mind Manager is a powerful software-package which can be used for drawing Mindmaps, Brainstorming-Ideas or organization diagramsFusionChartslets developers integrate the more traditional visualizations like bar charts and basic maps into their websites10
- 11. Data Visualization Market:Free vs. PremiumLot of free APIs are available (Google API, Many Eyes, etc.)However, there is room for both Free and Premium Some popular premium solutions include:11
- 12. Where is the market headed?Visualizations are becoming more pervasive as the technology becomes more powerful and easier to use.Increasingly powerful graphical systems and increasing network bandwidths are enabling richer visual environments, including multidimensional rendering, animation of many data points, map fly-bys, etc., that allow the audience to discern subtle patterns.Sophisticated statistical and data-mining techniques, incorporated under the covers, are allowing visualizations to support smarter analytics.12
- 13. Where is the market headed?Smart authoring wizards recommend charts for specific data types, freeing the user from trial-and-error chart selectionTight linkage with supporting business intelligence reporting capabilities allows users to move seamlessly to supporting detailed information13
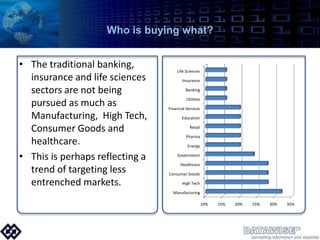
- 14. Who is buying what?The traditional banking, insurance and life sciences sectors are not being pursued as much as Manufacturing, High Tech, Consumer Goods and healthcare.This is perhaps reflecting a trend of targeting less entrenched markets.14
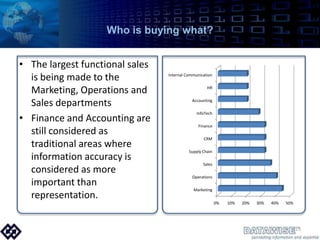
- 15. Who is buying what?The largest functional sales is being made to the Marketing, Operations and Sales departmentsFinance and Accounting are still considered as traditional areas where information accuracy is considered as more important than representation.15
- 16. Trend 1Emerging view: Customer is King, but he does not know what he wants (and that is OK), and he wants it now!16
- 17. Dashboard TrendsTrending towards seamless interaction between transactional and analytical systemsEmbedding analytics into core operational applications and processesEmbedded analytics monitors the status of key business processes, alert individuals when performance exceeds predefined thresholds, and trigger alerts, workflows, and tasks to streamline processes and optimize performance17
- 18. Dashboard TrendsConforms to the ŌĆ£look and feelŌĆØ of operational applications that users use on a daily basis. In addition, functionality is tailored to individual roles ŌĆō moving away from IDE to ADEMoving away from understanding to enabling decision making18
- 19. Trend 2Emerging view: Platform is irrelevant, the achievement of visualization objectives are19
- 20. In order to bolster its end-to-end capabilities, SAP acquired Excelcius ŌĆō but that only constrained its capabilities.Today, nearly all major visualization tools support MS SQL, Oracle, Sybase, SAP and Teradata.Also export is possible into multiple data presentation formats such as Excel, pdf, ppt, rss in a large number of cases.20
- 21. Trend 3Emerging view: Live and interactive availability of information21
- 22. Dashboard TrendsMultiple data sources and data types: Integration of internal and external data from both structured and unstructured sources to get additional value from information to promote more advanced uses of BI and general analytics. companies are required to integrate various information sources to get additional value from their informationBusiness focused applications offer customers ready made solutions which target business issues being faced by companies within different vertical markets22
- 23. Dashboard TrendsInteractive VisualizationsThe right graphics deliver insight faster and deeper than simple pie chartsHelps deal with problem of information overloadContain incredible amount of informationConstruct and convey complex insightsImprove information retrieval23
- 24. PranavMistryŌĆÖs ŌĆśSixth SenseŌĆÖ Technology24
- 25. Trend 4Emerging view: Intuitiveness and ŌĆśfeelŌĆÖ of data is important ŌĆō accuracy and specificity is secondary25
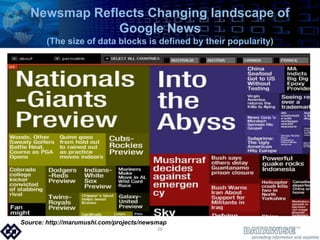
- 26. Newsmap Reflects Changing landscape of Google News (The size of data blocks is defined by their popularity)Source: http://marumushi.com/projects/newsmap26
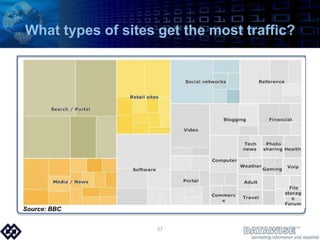
- 27. What types of sites get the most traffic? Source: BBC27
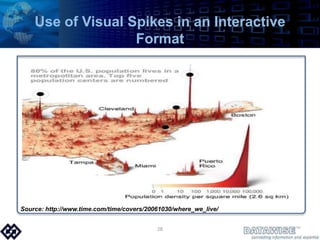
- 28. Use of Visual Spikes in an Interactive FormatSource: http://www.time.com/time/covers/20061030/where_we_live/28
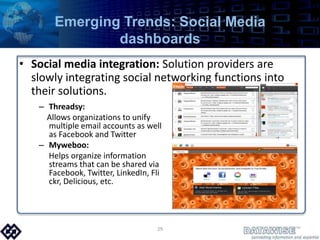
- 29. Emerging Trends: Social Media dashboardsSocial media integration: Solution providers are slowly integrating social networking functions into their solutions. Threadsy:Allows organizations to unify multiple email accounts as well as Facebook and TwitterMyweboo: Helps organize information streams that can be shared via Facebook, Twitter, LinkedIn, Flickr, Delicious, etc.29
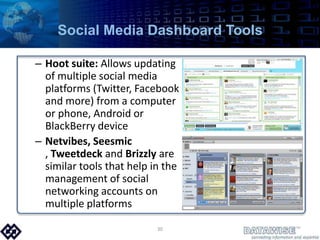
- 30. Social Media Dashboard ToolsHoot suite: Allows updating of multiple social media platforms (Twitter, Facebook and more) from a computer or phone, Android or BlackBerry deviceNetvibes, Seesmic , Tweetdeck and Brizzly are similar tools that help in the management of social networking accounts on multiple platforms30
- 31. Predictions for the MarketMobile access to business metrics will increase in importance Ownership of business intelligence will shift from IT to businessCloud computing in relation to business intelligence will gain momentum especially in the mid-sized segment.31
- 32. Thank youK Vinay Kumarvinay@mydatawise.com+91 9000 444 78832
