際際滷

際際滷Share a Scribd company logo
By The Numbers
Energy Infrastructure Update

         Federal Energy Regulatory Commission

  Office of Energy Projects Energy Infrastructure Update
                       2009  2012

             Data Compiled by Harsh Singh
Part One

New Power Plant Construction
From 2009 to 2012
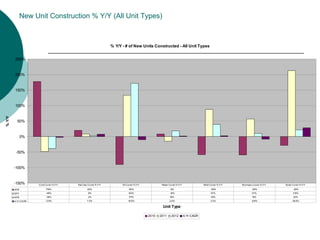
New Unit Construction % Y/Y (All Unit Types)


                                                                 % Y/Y - # of New Units Constructed - All Unit Types


        250%


        200%


        150%


        100%
% Y/Y


          50%


               0%


         -50%


        -100%


        -150%        Co al Co nst % Y/Y   Nat Gas Co nst % Y/Y         Oil Co nst % Y/Y           Water Co nst % Y/Y               Wind Co nst % Y/Y   B io mass Co nst % Y/Y   So lar Co nst % Y/Y
        2010               178%                   20%                       -90%                         8%                              -58%                  -59%                    -28%
        2011               -48%                   8%                        133%                         -15%                            87%                    57%                    213%
        2012               -38%                   2%                        1 %
                                                                             71                          18%                             39%                    10%                    22%
        4-Yr CA GR         -2.9%                 7.3%                      -10.0%                       2.0%                             2.3%                  -8.6%                  28.5%

                                                                                                   Unit Type

                                                                                          2010   2011     2012         4-Yr CAGR
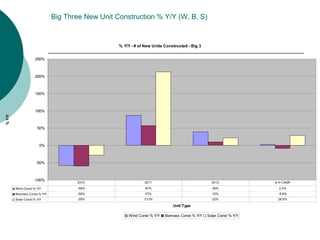
Big Three New Unit Construction % Y/Y (W, B, S)


                                                  % Y/Y - # of New Units Constructed - Big 3


                    250%


                    200%


                    150%


                    100%
% Y/Y


                      50%


                       0%


                     -50%


                    -100%
                                     2010                      2011                               2012              4-Yr CAGR

        Wind Const % Y/Y             -58%                      87%                                39%                 2.3%
        Biomass Const % Y/Y          -59%                      57%                                10%                 -8.6%
        Solar Const % Y/Y            -28%                      213%                               22%                28.5%

                                                                              Unit Type

                                                       Wind Const % Y/Y   Biomass Const % Y/Y   Solar Const % Y/Y
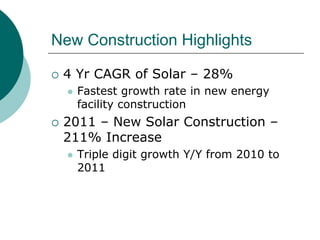
New Construction Highlights

   4 Yr CAGR of Solar  28%
       Fastest growth rate in new energy
        facility construction
   2011  New Solar Construction 
    211% Increase
       Triple digit growth Y/Y from 2010 to
        2011
Part Two

Big Three Plant Construction
From 2009 to 2012
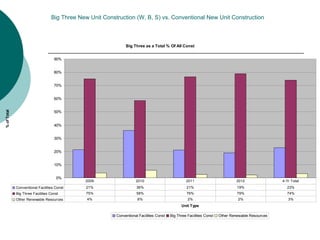
Big Three New Unit Construction (W, B, S) vs. Conventional New Unit Construction


                                                               Big Three as a Total % Of All Const


                                    90%


                                    80%


                                    70%


                                    60%
% of Total


                                    50%


                                    40%


                                    30%


                                    20%


                                    10%


                                     0%
                                              2009                   2010                          2011                         2012               4-Yr Total
             Conventional Facilities Const     21%                    36%                          21%                          19%                  23%
             Big Three Facilities Const        75%                    58%                          76%                          79%                  74%
             Other Renewable Resources         4%                     6%                            2%                           2%                   3%
                                                                                                Unit Type

                                                          Conventional Facilities Const   Big Three Facilities Const   Other Renewable Resources
Big Three New Unit Construction (W, B, S)


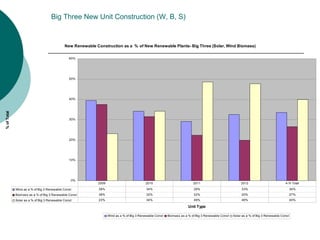
                                             New Renewable Construction as a % of New Renewable Plants- Big Three (Solar, Wind Biomass)

                                                60%


                                                50%


                                                40%
% of Total


                                                30%


                                                20%


                                                10%


                                                 0%
                                                            2009                           2010                           2011                           2012                         4-Yr Total

             Wind as a % of Big 3 Renewable Const            39%                            34%                           29%                            33%                                34%
             Biomass as a % of Big 3 Renewable Const         38%                            32%                           22%                            20%                                27%
             Solar as a % of Big 3 Renewable Const           23%                            34%                           49%                            48%                                40%

                                                                                                                       Unit Type

                                                                   Wind as a % of Big 3 Renewable Const   Biomass as a % of Big 3 Renewable Const   Solar as a % of Big 3 Renewable Const
New Construction Highlights
   2012  Big Three  79% of Total New
    Construction

   2009  2012 - Big Three - 74% of Total
    New Construction over the past 4 years

   2011 and 2012  Solar accounted for
    49% and 48% of New Construction vs.
    Total Big 3 Construction
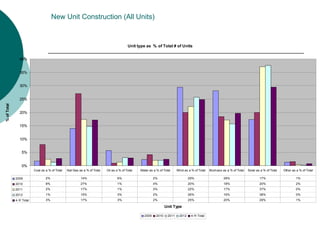
New Unit Construction (All Units)


                                                                                          Unit type as % of Total # of Units


                40%


                35%


                30%


                25%
% of Total


                20%


                15%


                10%


                 5%


                 0%
                          Coal as a % of Total   Nat Gas as a % of Total   Oil as a % of Total   Water as a % of Total     Wind as a % of Total   Biomass as a % of Total   Solar as a % of Total   Other as a % of Total

             2009                 2%                      14%                     6%                      2%                       29%                     28%                      17%                     1%
             2010                 8%                      27%                     1%                      4%                       20%                     18%                      20%                     2%
             2011                 2%                      17%                     1%                      2%                       22%                     17%                      37%                     0%
             2012                 1%                      15%                     3%                      2%                       26%                     16%                      38%                     0%
             4-Yr Total           3%                      17%                     3%                      2%                       25%                     20%                      29%                     1%

                                                                                                                   Unit Type

                                                                                                   2009     2010    2011    2012     4-Yr Total
New Construction Highlights
   Renewable Energy  Represented Double Digit %
    of Total New Construction over the Last 4 Yrs

   Conventional Energy  Represented Single Digit
    % of Total New Construction over the Last 4 Yrs

   In 2011 and 2012, Solar Represented 37% and
    38% of All New Construction Build Up vs. All
    Other Facilities

   Natural Gas Represented 15% of Total New
    Construction in 2012
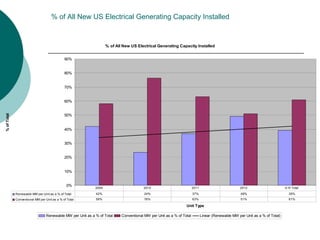
% of All New US Electrical Generating Capacity Installed


                                                                    % of All New US Electrical Generating Capacity Installed


                                              90%


                                              80%


                                              70%


                                              60%
% of Total


                                              50%


                                              40%


                                              30%


                                              20%


                                              10%


                                                0%
                                                             2009                       2010                           2011                         2012                       4-Yr Total
             Renewable MW per Unit as a % of Total           42%                         24%                           37%                           49%                         39%
             Conventional MW per Unit as a % of Total        58%                         76%                           63%                           51%                         61%

                                                                                                                 Unit Type

                                  Renewable MW per Unit as a % of Total     Conventional MW per Unit as a % of Total          Linear (Renewable MW per Unit as a % of Total)
New Energy Generation
   In 2012, renewable resources
    represented 49% of all new US
    electrical generating capacity
    installed

   From 2009 to 2012, renewable
    resources represented 39% of all
    new US electrical generating
    capacity installed

More Related Content

Energy infrastructure construction ferc data

  • 1. By The Numbers Energy Infrastructure Update Federal Energy Regulatory Commission Office of Energy Projects Energy Infrastructure Update 2009 2012 Data Compiled by Harsh Singh
  • 2. Part One New Power Plant Construction From 2009 to 2012
  • 3. New Unit Construction % Y/Y (All Unit Types) % Y/Y - # of New Units Constructed - All Unit Types 250% 200% 150% 100% % Y/Y 50% 0% -50% -100% -150% Co al Co nst % Y/Y Nat Gas Co nst % Y/Y Oil Co nst % Y/Y Water Co nst % Y/Y Wind Co nst % Y/Y B io mass Co nst % Y/Y So lar Co nst % Y/Y 2010 178% 20% -90% 8% -58% -59% -28% 2011 -48% 8% 133% -15% 87% 57% 213% 2012 -38% 2% 1 % 71 18% 39% 10% 22% 4-Yr CA GR -2.9% 7.3% -10.0% 2.0% 2.3% -8.6% 28.5% Unit Type 2010 2011 2012 4-Yr CAGR
  • 4. Big Three New Unit Construction % Y/Y (W, B, S) % Y/Y - # of New Units Constructed - Big 3 250% 200% 150% 100% % Y/Y 50% 0% -50% -100% 2010 2011 2012 4-Yr CAGR Wind Const % Y/Y -58% 87% 39% 2.3% Biomass Const % Y/Y -59% 57% 10% -8.6% Solar Const % Y/Y -28% 213% 22% 28.5% Unit Type Wind Const % Y/Y Biomass Const % Y/Y Solar Const % Y/Y
  • 5. New Construction Highlights 4 Yr CAGR of Solar 28% Fastest growth rate in new energy facility construction 2011 New Solar Construction 211% Increase Triple digit growth Y/Y from 2010 to 2011
  • 6. Part Two Big Three Plant Construction From 2009 to 2012
  • 7. Big Three New Unit Construction (W, B, S) vs. Conventional New Unit Construction Big Three as a Total % Of All Const 90% 80% 70% 60% % of Total 50% 40% 30% 20% 10% 0% 2009 2010 2011 2012 4-Yr Total Conventional Facilities Const 21% 36% 21% 19% 23% Big Three Facilities Const 75% 58% 76% 79% 74% Other Renewable Resources 4% 6% 2% 2% 3% Unit Type Conventional Facilities Const Big Three Facilities Const Other Renewable Resources
  • 8. Big Three New Unit Construction (W, B, S) New Renewable Construction as a % of New Renewable Plants- Big Three (Solar, Wind Biomass) 60% 50% 40% % of Total 30% 20% 10% 0% 2009 2010 2011 2012 4-Yr Total Wind as a % of Big 3 Renewable Const 39% 34% 29% 33% 34% Biomass as a % of Big 3 Renewable Const 38% 32% 22% 20% 27% Solar as a % of Big 3 Renewable Const 23% 34% 49% 48% 40% Unit Type Wind as a % of Big 3 Renewable Const Biomass as a % of Big 3 Renewable Const Solar as a % of Big 3 Renewable Const
  • 9. New Construction Highlights 2012 Big Three 79% of Total New Construction 2009 2012 - Big Three - 74% of Total New Construction over the past 4 years 2011 and 2012 Solar accounted for 49% and 48% of New Construction vs. Total Big 3 Construction
  • 10. New Unit Construction (All Units) Unit type as % of Total # of Units 40% 35% 30% 25% % of Total 20% 15% 10% 5% 0% Coal as a % of Total Nat Gas as a % of Total Oil as a % of Total Water as a % of Total Wind as a % of Total Biomass as a % of Total Solar as a % of Total Other as a % of Total 2009 2% 14% 6% 2% 29% 28% 17% 1% 2010 8% 27% 1% 4% 20% 18% 20% 2% 2011 2% 17% 1% 2% 22% 17% 37% 0% 2012 1% 15% 3% 2% 26% 16% 38% 0% 4-Yr Total 3% 17% 3% 2% 25% 20% 29% 1% Unit Type 2009 2010 2011 2012 4-Yr Total
  • 11. New Construction Highlights Renewable Energy Represented Double Digit % of Total New Construction over the Last 4 Yrs Conventional Energy Represented Single Digit % of Total New Construction over the Last 4 Yrs In 2011 and 2012, Solar Represented 37% and 38% of All New Construction Build Up vs. All Other Facilities Natural Gas Represented 15% of Total New Construction in 2012
  • 12. % of All New US Electrical Generating Capacity Installed % of All New US Electrical Generating Capacity Installed 90% 80% 70% 60% % of Total 50% 40% 30% 20% 10% 0% 2009 2010 2011 2012 4-Yr Total Renewable MW per Unit as a % of Total 42% 24% 37% 49% 39% Conventional MW per Unit as a % of Total 58% 76% 63% 51% 61% Unit Type Renewable MW per Unit as a % of Total Conventional MW per Unit as a % of Total Linear (Renewable MW per Unit as a % of Total)
  • 13. New Energy Generation In 2012, renewable resources represented 49% of all new US electrical generating capacity installed From 2009 to 2012, renewable resources represented 39% of all new US electrical generating capacity installed