ESRL/GMD 2012 poster
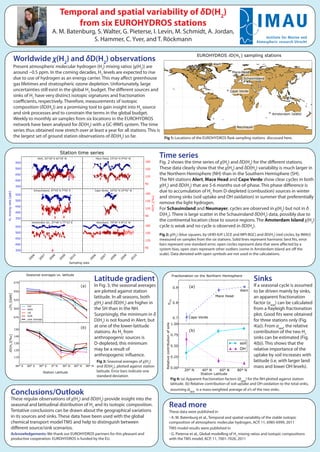
- 1. Temporal and spatial variability of ÎīD(H2) from six EUROHYDROS stations A. M. Batenburg, S. Walter, G. Pieterse, I. Levin, M. Schmidt, A. Jordan, S. Hammer, C. Yver, and T. RÃķckmann Worldwide Ï(H2) and ÎīD(H2) observations Present atmospheric molecular hydrogen (H2) mixing ratios (Ï(H2)) are around ~0.5 ppm. In the coming decades, H2 levels are expected to rise due to use of hydrogen as an energy carrier. This may affect greenhouse gas lifetimes and stratospheric ozone depletion. Unfortunately, large uncertainties still exist in the global H2 budget. The different sources and sinks of H2 have very distinct isotopic signatures and fractionation coefficients, respectively. Therefore, measurements of isotopic composition (ÎīD(H2)) are a promising tool to gain insight into H2 source and sink processes and to constrain the terms in the global budget. Weekly to monthly air samples from six locations in the EUROHYDROS network have been analysed for ÎīD(H2) with a GC-IRMS system. The time series thus obtained now stretch over at least a year for all stations. This is the largest set of ground station observations of ÎīD(H2) so far. Fig 1: Locations of the EUROHYDROS flask sampling stations discussed here. Time series Fig. 2 shows the time series of Ï(H2) and ÎīD(H2) for the different stations. These data clearly show that the Ï(H2) and ÎīD(H2) variability is much larger in the Northern Hemisphere (NH) than in the Southern Hemisphere (SH). The NH stations Alert, Mace Head and Cape Verde show clear cycles in both Ï(H2) and ÎīD(H2) that are 5-6 months out-of-phase. This phase difference is due to accumulation of H2 from D-depleted (combustion) sources in winter and strong sinks (soil uptake and OH oxidation) in summer that preferentially remove the light hydrogen. For Schauinsland and Neumayer, cycles are observed in Ï(H2) but not in Îī D(H2). There is large scatter in the Schauinsland ÎīD(H2) data, possibly due to the continental location close to source regions. The Amsterdam Island Ï(H2) cycle is weak and no cycle is observed in ÎīD(H2). Fig 2: Ï(H2) (blue squares, by UHEI-IUP, LSCE and MPI-BGC) and ÎīD(H2) (red circles, by IMAU) measured on samples from the six stations. Solid lines represent harmonic best fits, error bars represent one standard error, open circles represent data that were affected by a system bias, open stars represent other outliers (some in Amsterdam Island are off the scale). Data denoted with open symbols are not used in the calculations. Latitude gradient Sinks In Fig. 3, the seasonal averages If a seasonal cycle is assumed are plotted against station to be driven mainly by sinks, latitude. In all seasons, both an apparent fractionation Ï(H2) and ÎīD(H2) are higher in factor (Îąapp) can be calculated the SH than in the NH. from a Rayleigh fractionation Surprisingly, the minimum in Îī plot. Good fits were obtained D(H2) is not found in Alert, but for three stations only (Fig. at one of the lower-latitude 4(a)). From Îąapp, the relative stations. As H2 from contribution of the two H2 anthropogenic sources is sinks can be estimated (Fig. D-depleted, this minimum 4(b)). This shows that the may be a result of relative importance of the anthropogenic influence. uptake by soil increases with Fig 3: Seasonal averages of Ï(H2) latitude (i.e. with larger land and ÎīD(H2), plotted against station mass and lower OH levels). latitude. Error bars indicate one standard deviation Fig 4: (a) Apparent fractionation factors (Îąapp) for the NH plotted against station latitude. (b) Relative contribution of soil uptake and OH oxidation to the total sinks, assuming Îąapp is a mass-weighted average of Îąâs of the two sinks. Conclusions/Outlook These regular observations of Ï(H2) and ÎīD(H2) provide insight into the seasonal and latitudinal distribution of H2 and its isotopic composition. Read more Tentative conclusions can be drawn about the geographical variations These data were published in in its sources and sinks. These data have been used with the global - A. M. Batenburg et al., Temporal and spatial variability of the stable isotopic chemical transport model TM5 and help to distinguish between composition of atmospheric molecular hydrogen, ACP, 11, 6985-6999, 2011 different source/sink scenarios. TM5 model results were published in Acknowledgements: We thank our EUROHYDROS partners for this pleasant and - G. Pieterse et al., Global modelling of H2 mixing ratios and isotopic compositions productive cooperation. EUROHYDROS is funded by the EU. with the TM5 model, ACP, 11, 7001-7026, 2011

