Evaluating Data Quality using Sensor Metadata and Provenance
- 1. Evaluating Quality using Sensor Metadata and Provenance (or why Hannah Foreman is not on the bus!) Chris Baillie, Pete Edwards and Edoardo Pignotti c.baillie@abdn.ac.uk http://inf.abdn.ac.uk/~cbaillie
- 2. Overview  Motivation  What is quality and how do we assess it?  Work to date  Example scenario  Future work c.baillie@abdn.ac.uk http://inf.abdn.ac.uk/~cbaillie
- 3. Motivation  “we don’t know whether the information we find [on the Web] is accurate or not. So we have to teach people how to assess what they’ve found’’ Vint Cerf, 2010  Web of Documents has become the Web of documents, people, services and data.  Anyone can publish anything so we need a way to evaluate quality. c.baillie@abdn.ac.uk http://inf.abdn.ac.uk/~cbaillie
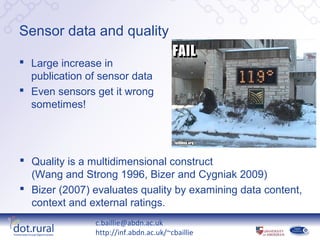
- 4. Sensor data and quality  Large increase in publication of sensor data  Even sensors get it wrong sometimes!  Quality is a multidimensional construct (Wang and Strong 1996, Bizer and Cygniak 2009)  Bizer (2007) evaluates quality by examining data content, context and external ratings. c.baillie@abdn.ac.uk http://inf.abdn.ac.uk/~cbaillie
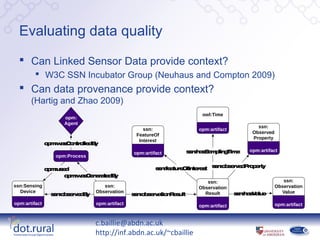
- 5. Evaluating data quality  Can Linked Sensor Data provide context?  W3C SSN Incubator Group (Neuhaus and Compton 2009)  Can data provenance provide context? (Hartig and Zhao 2009) owl:Time opm: Agent ssn: ssn: opm:artifact Observed FeatureOf Property Interest o m aC n o d y p :w s o tr lle B s n a S m lin Tim s :h s a p g e opm:artifact opm:artifact opm:Process om sd p :u e s n a r O te e t s n b e v d r p r s :fe tu e fIn r s s :o s r e P o e ty o m a G n r te B p :w s e e a d y ssn: ssn: ssn:Sensing ssn: Observation Observation Device Observation Result s n a V lu s :h s a e Value s n b ev d y s :o s r e B s n b e v tio R s lt s :o s r a n e u opm:artifact opm:artifact opm:artifact opm:artifact c.baillie@abdn.ac.uk http://inf.abdn.ac.uk/~cbaillie
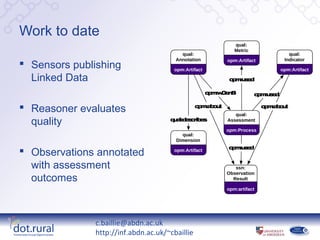
- 6. Work to date qual: Metric qual: qual: Annotation opm:Artifact Indicator  Sensors publishing opm:Artifact opm:Artifact Linked Data om sd p :u e om Gn p :w e B om sd p :u e  Reasoner evaluates om bu p :a o t qual: om bu p :a o t quality q a e c ib s u l:d s r e Assessment opm:Process qual: Dimension om sd p :u e  Observations annotated opm:Artifact with assessment ssn: Observation outcomes Result opm:artifact c.baillie@abdn.ac.uk http://inf.abdn.ac.uk/~cbaillie
- 7. Example scenario Data describing Observation Datadata  New location “route 17” available Feature: “Route 17” is suggests bus via SPARQL end- 500m away from point route! Recorded: 13/9/11, 11:27  Location Source: GPS Receiver observations published by iPhone app Accuracy: ±15m Relevance: Poor! c.baillie@abdn.ac.uk http://inf.abdn.ac.uk/~cbaillie
- 8. Summary  We are investigating whether linked sensor data and provenance can provide the context required by quality assessment.  Quality is highly subjective: can policies be used to guide the assessment process?  Can quality assessments use previous quality outcomes to enhance performance? c.baillie@abdn.ac.uk http://inf.abdn.ac.uk/~cbaillie
Editor's Notes
- #3: In this talk I will outline: why the need for quality assessment exists describe how quality is perceived outline our approach to quality assessment provide an example scenario and outline our future work.
- #4: Vint Cerf, one of the fathers of the Internet, stated recently that “we don’t whether the information we find [on the Web] is accurate or not. So we have to teach people how to assess what they’ve found. This problem is exacerbated by the fact the Web has evolved from what was a collection of static HTML documents to a vast ecosystem of services, data and even people (through social networks). However, the web has always been inherently open and therefore people can publish any content they wish. As a result there exists enormous variation in the quality of information. However, the Web is big and so we decided that we needed to find a smaller field in which to evaluate our approach.
- #5: Recently, there has been large increase in the publication of sensor data. We’re also seeing multiple sensors embedded in every-day objects like vehicles, mobile phones and even clothing. For example, we have determined that an individual iPhone 4 has at least 7 sensors within it (light, GPS, sound, accelerometer, gyroscope, camera, temperature). Crucially for us, however, sensors sometimes get it wrong and therefore we have somewhere to test our approach to quality assessment. For example, the sensor output in this image is reporting a temperature of 119 deg F; for those of you reaching for your calculators it’s around 48 deg C. Now, it is difficult to argue with the observation on its own but taking the snow on the ground into consideration the observation’s quality begins to look uncertain. Conversely, if I then tell you that this sensor is monitoring a sauna within the building, the observation starts to look a bit more believable. From this example it is clear to see that context is extremely important in evaluating data quality. We began tackling this problem by investigating how quality is perceived and quickly learned that rather than a discrete value; it is a multidimensional construct consisting of multiple quality dimensions. Different authors give dimensions different definitions, some examples are timeliness, which considers the age of a product, relevance which considers how applicable the data is to the task at hand, and believability which considers how true and credible the data is. Bizer’s WIQA framework is an example of a platform which performs quality assessment on data on the Web by examining the content, its context and external ratings of the data (similar to eBay’s member rating system).
- #6: Sensor observations alone have very little context and so we need a way to describe the situation in which a particular observation was created. A number of sensor platforms are now being programmed to publish their observations as Linked Data, which has created the Web of Linked Sensor Data. In 2009 the W3C chartered an Incubator Group to capture the capabilities of sensors and sensor networks. After a survey of existing sensor ontologies, they have created their own sensor describing ontology that can be used to annotate sensor observations with metadata describing the observation’s context. the feature of interest (i.e. Sports Direct Arena!) or the observed property (i.e. AirTemperature). This first diagram provides an example of a sensor observation annotated using the SSN ontology; the observation is observed by a SensingDevice and has properties describing the time it was created, its FeatureOfInterest (e.g. the Sports Direct Arena(!)) and the ObservedProperty (e.g. air temperature). This context could be further enhanced by capturing observation provenance – a record detailing the entities and processes associated with the observation. Due to the diverse number of sensor platforms and data available we require a generic model provenance and have therefore selected the Open Provenance Model as it is completely technology agnostic and can represent Agents such as sensor owners, Artifacts such as sensor observations and the processes involved in producing observations. This second diagram illustrates the capture of sensor data provenance whereby an observation is generated by a Sensing Process which used a Sensing Device and was controlled by an Agent. By examining records such as this we argue that we can consider how sensors perform over time and even use trust or reputation models to evaluate the impact individual agents could have on an observation.
- #7: We currently have a number of sensors publishing Linked Sensor Data in line with the W3C SSN Ontology. These are stored on a Web server and are accessible via our visualisation Web service. This service can display observations from a specific sensor within a given time window on a 2D plot. Clicking on individual observation triggers a quality assessment on the selected observation. This assessment is performed by a rule-based reasoner that operates over sensor metadata to produce a number of quality annotations described in our quality ontology. This diagram provides an example of such an assessment process which uses a number of quality indicators, or values that are indicative of data quality (e.g. the age of a the data). Quality metrics describe how quality indicators impact on quality dimensions and are therefore representative of the rules used by the reasoning mechanism. Finally, the assessment process outputs a Quality Annotation which describes a certain quality dimension. At present, these are qualitative, e.g. “Not timely” or “low accuracy” but we will consider quantitative values in the future. Once assessment is complete, observations are annotated with the quality annotations which could facilitate data re-use in the future.
- #8: This example stems from a demonstration of the Informed Rural Passenger project to members of the Digital Economy programme team. This project uses sensors within iPhones on public transport to provide real time information on bus locations (via GPS) . Users use an iPhone app to tell us when they are on a bus and the app starts monitoring their location. This map displays part of bus route 17 through Aberdeen, data that is available from one of the project ’ s SPARQL end-points. The system monitors buses along route 17 and plots their location on the map. In this instance, the red markers indicate previous bus locations along the route. At this point in the demonstration, an iPhone with the app loaded was passed to Hannah Foreman who proceeded to press the “ I ’ m on the bus ” button. The map then began to display the new observation but rather than displaying the bus further along route 17, it displayed it…  … here Some 500 metres from the bus route! We can begin to examine the metadata associated with the observation to try to work why this has happened. The observation describes a bus along route 17 and it had been recorded only a few seconds prior to being displayed, so there is no problem with the timeliness dimension. Because the observation is some distance from the route, the issue may lie with the accuracy dimension. One problem that can be present using mobile phones for this task is that they may use the Cell triangulation in favour of the built-in GPS – resulting in a significant loss of accuracy. However, in this instance the observation used the GPS received. Moreover, the accuracy associated with this observation, pm15m, is relatively good for a GPS device and so accuracy is good. From this, we can conclude that the iPhone is, in fact, nowhere near route 17 and so the issue lies with the relevance dimension: the observation is just not relevant to the wider context (route 17). So this takes us full circle to the alternate title of this talk and explains why Hannah Foreman is not on the bus! This is an example of how people may provide erroneous data but there are others: GPS readings could be inaccurate, or a time difference between sensor data being transmitted and received. As we’ve seen, this can give rise to low quality data and therefore we need some method to discern between data that is usable and data that is not.
- #9: The work we still plan to do begins with looking how provenance of sensor data can be used to evaluate quality. In particular, we wish to investigate whether there are certain quality dimensions that require provenance information for evaluation. We will also investigate whether the results of past quality assessments can be re-used rather than performing quality assessments every time someone wishes to use data by examining the provenance of existing quality annotations. Finally, we believe quality assessment to be highly subjective; everyone will have their own perception of quality data. As such, we intend to investigate the use of policies to guide the assessment process. This could be as simple as placing a single constraint on a particular sensor characteristic or as complex as re-defining how each quality dimension is evaluated.

![Motivation
 “we don’t know whether the information we find [on the
Web] is accurate or not. So we have to teach people
how to assess what they’ve found’’
Vint Cerf, 2010
 Web of Documents has become the Web of documents,
people, services and data.
 Anyone can publish anything so we need a way to
evaluate quality.
c.baillie@abdn.ac.uk
http://inf.abdn.ac.uk/~cbaillie](https://image.slidesharecdn.com/de2011-nov14-121026161943-phpapp01/85/Evaluating-Data-Quality-using-Sensor-Metadata-and-Provenance-3-320.jpg)
