Soil Steady-State Evaporation
•Download as PPTX, PDF•
1 like•998 views

In this presentation, an exact analytical solution to steady state evaporation from porous media is introduced. The solution is presented in terms of a set of infinite series. An advantage of this solution compared to previous derivations is that the infinite series can be very closely approximated using a closed-form solution (i.e., excluding integrals or series).


![Results & Discussions
Suction head distribution
3.0
2.5
z/hb
2.0
1.5
Warrick [1988], Brooks-Corey K(h)
Warrick [1988], Gardner K(h)
New solution, Exact
New solution, Approximate
Salvucci [1993]
h=h
h = he
b
1.0
0.5
0.0
0.001
0.01
0.1
1
h/hb
10
100](https://image.slidesharecdn.com/evaporation-140115205828-phpapp01/85/Soil-Steady-State-Evaporation-15-320.jpg)
![Results & Discussions
Suction head distribution
3.0
2.5
z/hb
2.0
1.5
Warrick [1988], Brooks-Corey K(h)
Warrick [1988], Gardner K(h)
New solution, Exact
New solution, Approximate
Salvucci [1993]
1.0
0.5
0.0
0.001
0.01
0.1
1
h/hb
10
100](https://image.slidesharecdn.com/evaporation-140115205828-phpapp01/85/Soil-Steady-State-Evaporation-16-320.jpg)
![Results & Discussions
Suction head distribution
2.0
z/hb
1.5
1.0
Warrick [1988], Brooks-Corey K(h)
Warrick [1988], Gardner K(h)
New solution, Exact
New solution, Approximate
Salvucci [1993]
0.5
0.0
0.01
0.1
1
h/hb
10
100](https://image.slidesharecdn.com/evaporation-140115205828-phpapp01/85/Soil-Steady-State-Evaporation-17-320.jpg)


Soil Steady-State Evaporation
- 1. An Analytical Solution to Soil Steady-State Evaporation Morteza Sadeghi Utah State University Ferdowsi University of Mashhad Nima Shokri Boston University Scott B. Jones Utah State University
- 2. Motivation
- 3. Unsaturated soil Surface water Water table Ground water
- 4. Steady State Evaporation 1 – Near surface water table (Phase one): 2- Deeper water table (Phase two):
- 5. Darcy’s law: e Drying Front Film Region z Saturated Region Suction Air-entry Liquid flow region (Dmax) Water table depth (D) Gas Region dh K ( h) 1 dz
- 6. ÔÉò When D < Dmax (phase one), evaporation rate is high. ÔÉò When D > Dmax (phase two), evaporation rate significantly decreases due to the hydraulic discontinuity between water table and soil surface.
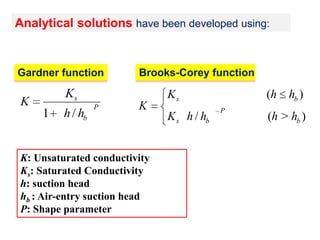
- 7. Analytical solutions have been developed using: Gardner function Ks K 1 h / hb P Brooks-Corey function K K: Unsaturated conductivity Ks: Saturated Conductivity h: suction head hb : Air-entry suction head P: Shape parameter Ks K s h / hb (h P hb ) (h > hb )
- 10. Mathematical Derivations Darcy: K dh K e z z: depth to water table K: Unsaturated Conductivity h: suction head e: evaporation rate hb : Air-entry suction head he : h (K=e) hDF : h at the Drying front Defining variables: T e/ K (hb <h he ) U K /e (he <h hDF ) Applying Brooks-Corey model for K(h): K Ks K s h / hb (h P hb ) (h > hb )
- 11. Mathematical Derivations 1 1 e / Ks z 1 1 e / Ks 1 1 e / Ks h (h hb ) dh hb 1 T he dh hb 1 T h h h ( hb< h he) h he Udh 1 U (he < h hDF ) Maclaurin series expansion for |x| < 1 as (1 – x)-1 = 1 + x + x2 + x3 +… 1 e / Ks z 1 e / Ks 1 e / Ks 1 1 1 h h h (h hb ) h hb he hb 1 T T 2 ... dh 1 T T 2 ... dh (hb <h he ) h he U U 2 U 3 ... dh (he <h hDF )
- 12. Mathematical Derivations Exact Solution 1 e 1 Ks z h 1 e 1 Ks z he (h hb ) hb 1 he n h / he i 0 1 he i 1 1 iP h / he 1 iP 1 he 1 iP i 1 1 iP i 0 1 he i 1 n hb / he 1 iP (hb <h he ) 1 iP i 1 1 iP (he <h hDF ) Suction head distribution above the water table as a function of hydraulic properties and
- 13. Mathematical Derivations Closed-form Solution 1 e 1 Ks h hb e e ) Ks Ks e 1 P 1 Ks hb e e ln(1 ) Ks Ks e 1 P 1 Ks (h ln(1 z 1 P 1 h 1 P e Ks Ks h ln 1 (h / hb ) e P 1/ P 1 e h ln 1 (h / hb ) P Ks ln 2 1 P hb ) (hb <h he ) 2 /12 ln 2 ln 2 1 P 1 P 1 P (he <h hDF )
- 14. Dmax hb e e ln(1 ) Ks Ks e 1 P 1 Ks 2 e Ks 1/ P Gas Region Film Region z Saturated Region Suction Dmax Drying Front ln 2 1 P ln 2 12 P 1 P ln 2 1 1 P
- 15. Results & Discussions Suction head distribution 3.0 2.5 z/hb 2.0 1.5 Warrick [1988], Brooks-Corey K(h) Warrick [1988], Gardner K(h) New solution, Exact New solution, Approximate Salvucci [1993] h=h h = he b 1.0 0.5 0.0 0.001 0.01 0.1 1 h/hb 10 100
- 16. Results & Discussions Suction head distribution 3.0 2.5 z/hb 2.0 1.5 Warrick [1988], Brooks-Corey K(h) Warrick [1988], Gardner K(h) New solution, Exact New solution, Approximate Salvucci [1993] 1.0 0.5 0.0 0.001 0.01 0.1 1 h/hb 10 100
- 17. Results & Discussions Suction head distribution 2.0 z/hb 1.5 1.0 Warrick [1988], Brooks-Corey K(h) Warrick [1988], Gardner K(h) New solution, Exact New solution, Approximate Salvucci [1993] 0.5 0.0 0.01 0.1 1 h/hb 10 100
- 18. Results & Discussions Dmax (cm), Approximate solution Liquid flow region 200 Chino Pachappa 1.02 mm 0.48 mm 0.16 mm coarse sand fine sand silt 150 100 50 0 0 50 100 150 Dmax (cm), Exact solution 200
- 19. Results & Discussions When D > Dmax, evaporation rate decreases significantly due to hydraulic discontinuity. 1.0 D = Dmax Chino Pachappa 1.02 mm 0.48 mm 0.16 mm coarse sand fine sand silt 0.8 e/e0 0.6 0.4 0.2 0.0 0 1 2 D/Dmax 3 4 5
- 20. Conclusions
- 21. For more Details read: