Exam2
1 like403 views

This document provides instructions for completing an exam in Excel that involves analyzing pedestrian fatality data from 1994 in the United States. The exam involves calculating totals and percentages of fatalities by time of day and day of week, creating a bar graph of the percentage of fatalities by time of day, and writing a memo in Word discussing the most and least dangerous times and importing the completed spreadsheet and bar graph.
1 of 2
Download to read offline

Ad
Recommended
Atmosphere and Air Temperature Web Quest
Atmosphere and Air Temperature Web Questwhitneyhgodfrey
╠²
The document contains questions about atmosphere and air temperature that direct the reader to various online resources. It asks the reader to draw and describe how the sun's angle affects temperatures in different parts of the world. It also asks the reader to explain why temperature decreases with increased altitude in the atmosphere and list three facts about the troposphere. Further questions ask the reader to identify air pressure, where we experience standard air pressure, and why breathing can be difficult at higher altitudes due to differences in air pressure. The final question asks the reader to identify the components of weather and explain each.ANALYSIS OF HISTORICAL WEATHER DATA
ANALYSIS OF HISTORICAL WEATHER DATAAlex Balistrieri
╠²
This document analyzes historical weather data from January 1949 to 2015 for seven US cities: Seattle, Portland, Sacramento, Fargo, Green Bay, Boston, and Atlanta. It describes the source and timeframe of the data, defines the fields in the dataset, and discusses how the cities and data were selected. Tables in the Excel data section show average snowfall and maximum temperatures by city for January during 1949-2015 and from 1950-1955 specifically.2 textbook schmalleger, f., & hall, d. e. (2016).╠²criminal la
2 textbook schmalleger, f., & hall, d. e. (2016).╠²criminal lasmile790243
╠²
This document outlines assignments for summarizing chapters and appendices from a criminal law textbook, reflecting on weekly videos, analyzing a capstone case with questions, and reviewing a legal resources website. It includes summarizing 3-5 paragraphs from chapters 8 and 9 as well as several appendices of the Model Penal Code covering various criminal offenses. Students are also asked to write one paragraph summaries for four videos and fully answer questions about a capstone case involving stalking. Finally, the document instructs students to visit a mock trial website, describe its features and content, and offer an opinion on its usefulness in one paragraph.Event Sourcing 101 (Vienna, 21. 2. 2019)
Event Sourcing 101 (Vienna, 21. 2. 2019)Jan Kuchař
╠²
This document summarizes a presentation about event sourcing. Event sourcing involves storing a chronological record of events that describe state changes rather than storing the current state. Storing events allows reconstructing past states and enables complex queries. It is more optimized for writes than a traditional database but allows for many projections to optimize reads. Examples of companies using event sourcing include LinkedIn and BlaBlaCar. Advice includes not putting everything in one event stream and ensuring events represent real-world actions.Bootstrap with liferay
Bootstrap with liferaySendhil Kumar Kannan
╠²
The document discusses integrating Bootstrap version 2.3.2 and 3.0 with Liferay 6.2. It explains that Liferay 6.2 includes Bootstrap 2.3.2 by default. While Bootstrap 3.0 was released around the same time, it was not included because it dropped support for older browsers and required major changes that could introduce bugs. The document provides an overview of the differences between Bootstrap 2.3.2 and 3.0 grids and classes. It also discusses steps to create a Liferay theme with either Bootstrap version, and lists CSS classes that may conflict and need overrides when using Bootstrap 3.0 with Liferay 6.2.2024 Trend Updates: What Really Works In SEO & Content Marketing
2024 Trend Updates: What Really Works In SEO & Content MarketingSearch Engine Journal
╠²
The document outlines key SEO and content marketing trends for 2024, emphasizing the impact of AI, the importance of E-E-A-T (Experience, Expertise, Authoritativeness, Trustworthiness), and a shift towards user-centric content strategies. It advises against focusing on outdated trends like voice search and stresses the need for creating value-driven, authoritative content. Additionally, it highlights the need to leverage AI as a supportive tool rather than relying solely on it for content creation.Storytelling For The Web: Integrate Storytelling in your Design Process
Storytelling For The Web: Integrate Storytelling in your Design ProcessChiara Aliotta
╠²
The document outlines a livestream presentation by Chiara Aliotta on integrating storytelling into web design to enhance user experiences. It covers the storytelling process for designers, emphasizing aspects such as understanding the audience, structuring narratives, and creating emotional connections. The presentation also includes case studies and practical examples to demonstrate effective storytelling in UX/UI design.On-Device AI: Is It Time to Go All-In, or Do We Still Need the Cloud?
On-Device AI: Is It Time to Go All-In, or Do We Still Need the Cloud?Hassan Abid
╠²
As mobile hardware becomes more powerful, the promise of running advanced AI directly on-device is closer than ever. With GoogleŌĆÖs latest on-device model Gemini Nano, accessible through the new ML Kit GenAI APIs and AI Edge SDK, alongside the open-source Gemma-3n models, developers can now integrate lightweight, multimodal intelligence that works even without an internet connection. But does this mean we no longer need cloud-based AI? This session explores the practical trade-offs between on-device and cloud AI for mobile apps.Key Challenges in Troubleshooting Customer On-Premise Applications
Key Challenges in Troubleshooting Customer On-Premise ApplicationsTier1 app
╠²
When applications are deployed in customer-managed environments, resolving performance issues becomes a hidden battle. Limited access to logs, delayed responses, and vague problem descriptions make root cause analysis incredibly challenging.
In this presentation, we walk through:
The six most common hurdles faced in on-prem troubleshooting
A practical 360┬░ artifact collection strategy using the open-source yc-360 script
Real-world case studies covering transaction timeouts, CPU spikes, and intermittent HTTP 502 errors
Benefits of structured data capture in reducing investigation time and improving communication with customers
Ō£ģ Whether you're supporting enterprise clients or building tools for distributed environments, this deck offers a practical roadmap to make on-prem issue resolution faster and less frustrating.A Guide to Telemedicine Software Development.pdf
A Guide to Telemedicine Software Development.pdfOlivero Bozzelli
╠²
Learn how telemedicine software is built from the ground upŌĆöstarting with idea validation, followed by tech selection, feature integration, and deployment.
Know more about this: https://www.yesitlabs.com/a-guide-to-telemedicine-software-development/Foundations of Marketo Engage - Programs, Campaigns & Beyond - June 2025
Foundations of Marketo Engage - Programs, Campaigns & Beyond - June 2025BradBedford3
╠²
Join us for an exciting introductory session on, Foundations of Marketo Engage: Programs, Campaigns & Beyond. Ideal for new and early-stage users looking to build confidence and capability in Marketo Engage.
Our speakers for this session will be:
AJ Navarro
Marketing Operations Manager - Sprout Social
Bobby Coppola
Marketing Manager - Blue Yonder
This event will guide you through the essential steps to build strong, scalable Programs, Channels, Tags, Smart Campaigns, and Reporting Basics in Marketo Engage.
Attendees will gain practical knowledge on how to structure and launch marketing initiatives, leverage templates for efficiency, and implement best practices for campaign execution and measurement. You'll leave with actionable insights you can immediately apply to your own Marketo instance to improve organization, automation, and reporting. Marketo Engage.
Learn how to create impactful programs and understand the best practices for seamless campaign management and effective reporting.
DonŌĆÖt miss out on this opportunity to gain hands-on guidance from experienced practitioners and to connect with peers who are also new to the platform. Secure your spot today and start building your path to becoming a Marketo pro!
Please feel free to invite colleagues who you think would also benefit from this session.Modern Platform Engineering with Choreo - The AI-Native Internal Developer Pl...
Modern Platform Engineering with Choreo - The AI-Native Internal Developer Pl...WSO2
╠²
Building and operating internal platforms has become increasingly complex ŌĆö sprawling toolchains, rising costs, and fragmented developer experiences are slowing teams down. ItŌĆÖs time for a new approach.
This slide deck explores modern platform engineering with Choreo, WSO2ŌĆÖs AI-native Internal Developer Platform as a Service. Discover how you can streamline platform operations, empower your developers, and drive faster innovation ŌĆö all while reducing complexity and cost.
Learn more: https://wso2.com/choreo/platform-engineering/Azure AI Foundry: The AI app and agent factory
Azure AI Foundry: The AI app and agent factoryMaxim Salnikov
╠²
Discover how Azure AI Foundry is transforming the way organizations innovate and operate. This session explores the pivotal role of AI in reshaping business processes, enhancing employee experiences, and redefining customer engagement. Attendees will gain insights into the strategic value of AI investments, including the measurable returns and the growing momentum behind generative AI experimentation.
The talk introduces the emerging paradigm of agentic AI - intelligent agents that are revolutionizing how we build, manage, and interact with software. Through real-world examples, the session demonstrates how Azure AI Foundry empowers teams to design, customize, and scale AI applications and agents, unlocking new levels of efficiency and creativity across industries.How Automation in Claims Handling Streamlined Operations
How Automation in Claims Handling Streamlined OperationsInsurance Tech Services
╠²
Claims processing automation reduces manual work, cuts errors, and speeds up resolutions. Using AI, RPA, and OCR, it enables faster data handling and smoother workflowsŌĆöboosting efficiency and customer satisfaction. Visit https://www.damcogroup.com/insurance/claims-processing-automation for more details! Simplify Task, Team, and Project Management with Orangescrum Work
Simplify Task, Team, and Project Management with Orangescrum WorkOrangescrum
╠²
Streamline project workflows, team collaboration, and time tracking with orangescrum work, your all-in-one tool for smarter and faster project execution.Heat Treatment Process Automation in India
Heat Treatment Process Automation in IndiaReckers Mechatronics
╠²
Automate your heat treatment processes for superior precision, consistency, and cost savings. Explore solutions for furnaces, quench systems. Heat treatment is a critical manufacturing process that alters the microstructure and properties of materials, typically metals, to achieve desired characteristics such as hardness, strength, ductility, and wear resistance. HYBRIDIZATION OF ALKANES AND ALKENES ...
HYBRIDIZATION OF ALKANES AND ALKENES ...karishmaduhijod1
╠²
Hybridization happens when atomic orbitals mix to form a new atomic orbital. ERP Systems in the UAE: Driving Business Transformation with Smart Solutions
ERP Systems in the UAE: Driving Business Transformation with Smart Solutionsdheeodoo
╠²
ERP solutions are driving innovative change for businesses across the UAE through improved efficiency, reduced operational costs, and provide real-time visibility of operational data. By offering native Arabic language support, VAT compliance, and some level of cloud readiness, ERP solutions also supports and are consistent with the initiative for Smart Dubai 2030. Odoo is an example of a flexible & scalable solution. If you're looking for expert support with implementation contact Banibro. www.banibro.com
declaration of Variables and constants.pptx
declaration of Variables and constants.pptxmeemee7378
╠²
Rules of declaration of variables and constantsBest Software Development at Best Prices
Best Software Development at Best Pricessoftechies7
╠²
Welcome to Softechies SolutionsŌĆöyour ultimate resource for all technology and software needs. We specialize in delivering expert solutions and guidance to help you tackle everyday tech challenges. WeŌĆÖve got you covered, from software troubleshooting and website development to digital marketing. Whether you need technology upgrades, mobile app development, cloud-managed services, or IT consulting, Softechies Solutions is here to enhance your digital experience. https://softechies.net/
Test Case Design Techniques ŌĆō Practical Examples & Best Practices in Software...
Test Case Design Techniques ŌĆō Practical Examples & Best Practices in Software...Muhammad Fahad Bashir
╠²
This presentation was part of the SQA & PM Bootcamp, where I served as a trainer. It focuses on effective test case design techniques, blending theoretical knowledge with practical application, especially useful for manual testers and QA beginners.
Video Lecture Recording : https://www.facebook.com/share/v/1Z44DiXN5v/
WhatŌĆÖs Covered:
¤¦Š Definition and Purpose of Test Case Design
¤ÜĆ Importance of Structured Test Design
¤¦Ā Test Case Design Techniques Overview:
Ō£ģ Black Box Techniques
Ō£ģ White Box Techniques
Ō£ģ Experience-Based Techniques
¤ōØ Manual Test Case Design in Detail
¤öÉ Real-World Example: Login Page Test Case
¤¦® Black Box Methods Explained with Examples:
Equivalence Partitioning (EP)
Boundary Value Analysis (BVA)
Difference Between EP & BVA
¤ōŖ Decision Table Testing
¤ÆĪ Experience-Based Testing: Error Guessing, Exploratory Testing
¤ōé White Box Techniques (Introductory Overview)
Ō×Ģ Much More to Help You Build Strong Manual Testing Skills
This resource is especially helpful for students, aspiring QA professionals, and junior testers looking to master test design fundamentals with clarity and practical insight.IObit Driver Booster Pro 12 Crack Latest Version Download
IObit Driver Booster Pro 12 Crack Latest Version Downloadpcprocore
╠²
¤æēØŚĪØŚ╝ØśüØŚ▓:ØŚ¢ØŚ╝ØŚĮØśå ØŚ╣ØŚČØŚ╗ØŚĖ & ØŚĮØŚ«ØśĆØśüØŚ▓ ØŚČØŚ╗ØśüØŚ╝ ØŚÜØŚ╝ØŚ╝ØŚ┤ØŚ╣ØŚ▓ ØŚ╗ØŚ▓Øśä ØśüØŚ«ØŚ»¤ö┤Ō¢Č https://pcprocore.com/ ŌŚĆŌ£ģ
IObit Driver Booster Pro is the solution. It automatically downloads and updates drivers with just one click, avoiding hardware failures, system instability, and security vulnerabilities.Decipher SEO Solutions for your startup needs.
Decipher SEO Solutions for your startup needs.mathai2
╠²
A solution deck that gives you an idea of how you can use Decipher SEO to target keywords, build authority and generate high ranking content.
With features like images to product you can create a E-commerce pipeline that is optimized to help your store rank.
With integrations with shopify, woocommerce and wordpress theres a seamless way get your content to your website or storefront.
View more at decipherseo.comOpenChain Webinar - AboutCode - Practical Compliance in One Stack ŌĆō Licensing...
OpenChain Webinar - AboutCode - Practical Compliance in One Stack ŌĆō Licensing...Shane Coughlan
╠²
OpenChain Webinar - AboutCode - Practical Compliance in One Stack ŌĆō Licensing, Vulnerabilities, and MoreCodeCleaner: Mitigating Data Contamination for LLM Benchmarking
CodeCleaner: Mitigating Data Contamination for LLM Benchmarkingarabelatso
╠²
The pdf-version of "CodeCleaner: Mitigating Data Contamination for LLM Benchmarking" presented in Internetware 2025.Complete Guideliness to Build an Effective Maintenance Plan.ppt
Complete Guideliness to Build an Effective Maintenance Plan.pptQualityzeInc1
╠²
Building an effective maintenance plan with Qualityze Maintenance Management Software begins with a structured asset assessment. The software enables organizations to catalog all equipment, tools, and infrastructure, assigning detailed profiles that include manufacturer details, maintenance history, and risk categories. This centralization ensures accurate tracking and allows maintenance teams to prioritize assets based on criticality, condition, and usage frequency.
Once assets are categorized, Qualityze helps define maintenance strategiesŌĆösuch as preventive, predictive, or condition-based approachesŌĆöbased on industry best practices. With customizable templates and workflows, organizations can schedule recurring maintenance tasks, set alert notifications for due services, and automate work order creation. This proactive scheduling reduces equipment downtime, boosts productivity, and ensures regulatory compliance.
Qualityze also simplifies documentation and reporting. All maintenance activities are recorded with time stamps, technician credentials, and task details. This not only improves accountability but also aids in audits and inspections. The software's real-time dashboards and analytics provide visibility into maintenance performance, helping decision-makers identify trends, gaps, and opportunities for process improvements.
Finally, the Qualityze system promotes team collaboration and compliance. Integrated training modules ensure technicians are certified for assigned tasks, while role-based access controls protect data integrity. With its cloud-based architecture, Qualityze enables remote access, making it ideal for multi-site operations and mobile maintenance teams. The result is a robust, data-driven maintenance plan that extends asset life, reduces risk, and supports continuous improvement.
Best AI-Powered Wearable Tech for Remote Health Monitoring in 2025
Best AI-Powered Wearable Tech for Remote Health Monitoring in 2025SEOLIFT - SEO Company London
╠²
Introduction In 2025, the fusion of artificial intelligence (AI) with wearable technology is redefining how we monitor health remotely. With the rise in chronic illnesses and the need for proactive health tracking, AI-powered wearables have emerged as essential tools. These devices offer real-time health insights, predictive alerts, and seamless integration with telehealth services.Artificial Intelligence, Data and Competition ŌĆō SCHREPEL ŌĆō June 2024 OECD dis...
Artificial Intelligence, Data and Competition ŌĆō SCHREPEL ŌĆō June 2024 OECD dis...OECD Directorate for Financial and Enterprise Affairs
╠²
This presentation by Thibault Schrepel, Associate Professor of Law at Vrije Universiteit Amsterdam University, was made during the discussion ŌĆ£Artificial Intelligence, Data and CompetitionŌĆØ held at the 143rd meeting of the OECD Competition Committee on 12 June 2024. More papers and presentations on the topic can be found at oe.cd/aicomp.
This presentation was uploaded with the authorŌĆÖs consent.
How to Leverage AI to Boost Employee Wellness - Lydia Di Francesco - SocialHR...
How to Leverage AI to Boost Employee Wellness - Lydia Di Francesco - SocialHR...SocialHRCamp
╠²
The document discusses leveraging AI to enhance employee wellness through data analytics, automating tasks, and personalized wellness apps, emphasizing the shared responsibility of employee well-being between leaders and organizations. It outlines best practices for using AI in wellness strategies, including ensuring data privacy and security, understanding employee needs, and promoting inclusivity. Lydia Di Francesco, a wellness specialist, shares insights to optimize workplace wellness strategy using AI-driven data analytics and encourages collaboration and transparency.More Related Content
Recently uploaded (20)
On-Device AI: Is It Time to Go All-In, or Do We Still Need the Cloud?
On-Device AI: Is It Time to Go All-In, or Do We Still Need the Cloud?Hassan Abid
╠²
As mobile hardware becomes more powerful, the promise of running advanced AI directly on-device is closer than ever. With GoogleŌĆÖs latest on-device model Gemini Nano, accessible through the new ML Kit GenAI APIs and AI Edge SDK, alongside the open-source Gemma-3n models, developers can now integrate lightweight, multimodal intelligence that works even without an internet connection. But does this mean we no longer need cloud-based AI? This session explores the practical trade-offs between on-device and cloud AI for mobile apps.Key Challenges in Troubleshooting Customer On-Premise Applications
Key Challenges in Troubleshooting Customer On-Premise ApplicationsTier1 app
╠²
When applications are deployed in customer-managed environments, resolving performance issues becomes a hidden battle. Limited access to logs, delayed responses, and vague problem descriptions make root cause analysis incredibly challenging.
In this presentation, we walk through:
The six most common hurdles faced in on-prem troubleshooting
A practical 360┬░ artifact collection strategy using the open-source yc-360 script
Real-world case studies covering transaction timeouts, CPU spikes, and intermittent HTTP 502 errors
Benefits of structured data capture in reducing investigation time and improving communication with customers
Ō£ģ Whether you're supporting enterprise clients or building tools for distributed environments, this deck offers a practical roadmap to make on-prem issue resolution faster and less frustrating.A Guide to Telemedicine Software Development.pdf
A Guide to Telemedicine Software Development.pdfOlivero Bozzelli
╠²
Learn how telemedicine software is built from the ground upŌĆöstarting with idea validation, followed by tech selection, feature integration, and deployment.
Know more about this: https://www.yesitlabs.com/a-guide-to-telemedicine-software-development/Foundations of Marketo Engage - Programs, Campaigns & Beyond - June 2025
Foundations of Marketo Engage - Programs, Campaigns & Beyond - June 2025BradBedford3
╠²
Join us for an exciting introductory session on, Foundations of Marketo Engage: Programs, Campaigns & Beyond. Ideal for new and early-stage users looking to build confidence and capability in Marketo Engage.
Our speakers for this session will be:
AJ Navarro
Marketing Operations Manager - Sprout Social
Bobby Coppola
Marketing Manager - Blue Yonder
This event will guide you through the essential steps to build strong, scalable Programs, Channels, Tags, Smart Campaigns, and Reporting Basics in Marketo Engage.
Attendees will gain practical knowledge on how to structure and launch marketing initiatives, leverage templates for efficiency, and implement best practices for campaign execution and measurement. You'll leave with actionable insights you can immediately apply to your own Marketo instance to improve organization, automation, and reporting. Marketo Engage.
Learn how to create impactful programs and understand the best practices for seamless campaign management and effective reporting.
DonŌĆÖt miss out on this opportunity to gain hands-on guidance from experienced practitioners and to connect with peers who are also new to the platform. Secure your spot today and start building your path to becoming a Marketo pro!
Please feel free to invite colleagues who you think would also benefit from this session.Modern Platform Engineering with Choreo - The AI-Native Internal Developer Pl...
Modern Platform Engineering with Choreo - The AI-Native Internal Developer Pl...WSO2
╠²
Building and operating internal platforms has become increasingly complex ŌĆö sprawling toolchains, rising costs, and fragmented developer experiences are slowing teams down. ItŌĆÖs time for a new approach.
This slide deck explores modern platform engineering with Choreo, WSO2ŌĆÖs AI-native Internal Developer Platform as a Service. Discover how you can streamline platform operations, empower your developers, and drive faster innovation ŌĆö all while reducing complexity and cost.
Learn more: https://wso2.com/choreo/platform-engineering/Azure AI Foundry: The AI app and agent factory
Azure AI Foundry: The AI app and agent factoryMaxim Salnikov
╠²
Discover how Azure AI Foundry is transforming the way organizations innovate and operate. This session explores the pivotal role of AI in reshaping business processes, enhancing employee experiences, and redefining customer engagement. Attendees will gain insights into the strategic value of AI investments, including the measurable returns and the growing momentum behind generative AI experimentation.
The talk introduces the emerging paradigm of agentic AI - intelligent agents that are revolutionizing how we build, manage, and interact with software. Through real-world examples, the session demonstrates how Azure AI Foundry empowers teams to design, customize, and scale AI applications and agents, unlocking new levels of efficiency and creativity across industries.How Automation in Claims Handling Streamlined Operations
How Automation in Claims Handling Streamlined OperationsInsurance Tech Services
╠²
Claims processing automation reduces manual work, cuts errors, and speeds up resolutions. Using AI, RPA, and OCR, it enables faster data handling and smoother workflowsŌĆöboosting efficiency and customer satisfaction. Visit https://www.damcogroup.com/insurance/claims-processing-automation for more details! Simplify Task, Team, and Project Management with Orangescrum Work
Simplify Task, Team, and Project Management with Orangescrum WorkOrangescrum
╠²
Streamline project workflows, team collaboration, and time tracking with orangescrum work, your all-in-one tool for smarter and faster project execution.Heat Treatment Process Automation in India
Heat Treatment Process Automation in IndiaReckers Mechatronics
╠²
Automate your heat treatment processes for superior precision, consistency, and cost savings. Explore solutions for furnaces, quench systems. Heat treatment is a critical manufacturing process that alters the microstructure and properties of materials, typically metals, to achieve desired characteristics such as hardness, strength, ductility, and wear resistance. HYBRIDIZATION OF ALKANES AND ALKENES ...
HYBRIDIZATION OF ALKANES AND ALKENES ...karishmaduhijod1
╠²
Hybridization happens when atomic orbitals mix to form a new atomic orbital. ERP Systems in the UAE: Driving Business Transformation with Smart Solutions
ERP Systems in the UAE: Driving Business Transformation with Smart Solutionsdheeodoo
╠²
ERP solutions are driving innovative change for businesses across the UAE through improved efficiency, reduced operational costs, and provide real-time visibility of operational data. By offering native Arabic language support, VAT compliance, and some level of cloud readiness, ERP solutions also supports and are consistent with the initiative for Smart Dubai 2030. Odoo is an example of a flexible & scalable solution. If you're looking for expert support with implementation contact Banibro. www.banibro.com
declaration of Variables and constants.pptx
declaration of Variables and constants.pptxmeemee7378
╠²
Rules of declaration of variables and constantsBest Software Development at Best Prices
Best Software Development at Best Pricessoftechies7
╠²
Welcome to Softechies SolutionsŌĆöyour ultimate resource for all technology and software needs. We specialize in delivering expert solutions and guidance to help you tackle everyday tech challenges. WeŌĆÖve got you covered, from software troubleshooting and website development to digital marketing. Whether you need technology upgrades, mobile app development, cloud-managed services, or IT consulting, Softechies Solutions is here to enhance your digital experience. https://softechies.net/
Test Case Design Techniques ŌĆō Practical Examples & Best Practices in Software...
Test Case Design Techniques ŌĆō Practical Examples & Best Practices in Software...Muhammad Fahad Bashir
╠²
This presentation was part of the SQA & PM Bootcamp, where I served as a trainer. It focuses on effective test case design techniques, blending theoretical knowledge with practical application, especially useful for manual testers and QA beginners.
Video Lecture Recording : https://www.facebook.com/share/v/1Z44DiXN5v/
WhatŌĆÖs Covered:
¤¦Š Definition and Purpose of Test Case Design
¤ÜĆ Importance of Structured Test Design
¤¦Ā Test Case Design Techniques Overview:
Ō£ģ Black Box Techniques
Ō£ģ White Box Techniques
Ō£ģ Experience-Based Techniques
¤ōØ Manual Test Case Design in Detail
¤öÉ Real-World Example: Login Page Test Case
¤¦® Black Box Methods Explained with Examples:
Equivalence Partitioning (EP)
Boundary Value Analysis (BVA)
Difference Between EP & BVA
¤ōŖ Decision Table Testing
¤ÆĪ Experience-Based Testing: Error Guessing, Exploratory Testing
¤ōé White Box Techniques (Introductory Overview)
Ō×Ģ Much More to Help You Build Strong Manual Testing Skills
This resource is especially helpful for students, aspiring QA professionals, and junior testers looking to master test design fundamentals with clarity and practical insight.IObit Driver Booster Pro 12 Crack Latest Version Download
IObit Driver Booster Pro 12 Crack Latest Version Downloadpcprocore
╠²
¤æēØŚĪØŚ╝ØśüØŚ▓:ØŚ¢ØŚ╝ØŚĮØśå ØŚ╣ØŚČØŚ╗ØŚĖ & ØŚĮØŚ«ØśĆØśüØŚ▓ ØŚČØŚ╗ØśüØŚ╝ ØŚÜØŚ╝ØŚ╝ØŚ┤ØŚ╣ØŚ▓ ØŚ╗ØŚ▓Øśä ØśüØŚ«ØŚ»¤ö┤Ō¢Č https://pcprocore.com/ ŌŚĆŌ£ģ
IObit Driver Booster Pro is the solution. It automatically downloads and updates drivers with just one click, avoiding hardware failures, system instability, and security vulnerabilities.Decipher SEO Solutions for your startup needs.
Decipher SEO Solutions for your startup needs.mathai2
╠²
A solution deck that gives you an idea of how you can use Decipher SEO to target keywords, build authority and generate high ranking content.
With features like images to product you can create a E-commerce pipeline that is optimized to help your store rank.
With integrations with shopify, woocommerce and wordpress theres a seamless way get your content to your website or storefront.
View more at decipherseo.comOpenChain Webinar - AboutCode - Practical Compliance in One Stack ŌĆō Licensing...
OpenChain Webinar - AboutCode - Practical Compliance in One Stack ŌĆō Licensing...Shane Coughlan
╠²
OpenChain Webinar - AboutCode - Practical Compliance in One Stack ŌĆō Licensing, Vulnerabilities, and MoreCodeCleaner: Mitigating Data Contamination for LLM Benchmarking
CodeCleaner: Mitigating Data Contamination for LLM Benchmarkingarabelatso
╠²
The pdf-version of "CodeCleaner: Mitigating Data Contamination for LLM Benchmarking" presented in Internetware 2025.Complete Guideliness to Build an Effective Maintenance Plan.ppt
Complete Guideliness to Build an Effective Maintenance Plan.pptQualityzeInc1
╠²
Building an effective maintenance plan with Qualityze Maintenance Management Software begins with a structured asset assessment. The software enables organizations to catalog all equipment, tools, and infrastructure, assigning detailed profiles that include manufacturer details, maintenance history, and risk categories. This centralization ensures accurate tracking and allows maintenance teams to prioritize assets based on criticality, condition, and usage frequency.
Once assets are categorized, Qualityze helps define maintenance strategiesŌĆösuch as preventive, predictive, or condition-based approachesŌĆöbased on industry best practices. With customizable templates and workflows, organizations can schedule recurring maintenance tasks, set alert notifications for due services, and automate work order creation. This proactive scheduling reduces equipment downtime, boosts productivity, and ensures regulatory compliance.
Qualityze also simplifies documentation and reporting. All maintenance activities are recorded with time stamps, technician credentials, and task details. This not only improves accountability but also aids in audits and inspections. The software's real-time dashboards and analytics provide visibility into maintenance performance, helping decision-makers identify trends, gaps, and opportunities for process improvements.
Finally, the Qualityze system promotes team collaboration and compliance. Integrated training modules ensure technicians are certified for assigned tasks, while role-based access controls protect data integrity. With its cloud-based architecture, Qualityze enables remote access, making it ideal for multi-site operations and mobile maintenance teams. The result is a robust, data-driven maintenance plan that extends asset life, reduces risk, and supports continuous improvement.
Best AI-Powered Wearable Tech for Remote Health Monitoring in 2025
Best AI-Powered Wearable Tech for Remote Health Monitoring in 2025SEOLIFT - SEO Company London
╠²
Introduction In 2025, the fusion of artificial intelligence (AI) with wearable technology is redefining how we monitor health remotely. With the rise in chronic illnesses and the need for proactive health tracking, AI-powered wearables have emerged as essential tools. These devices offer real-time health insights, predictive alerts, and seamless integration with telehealth services.Test Case Design Techniques ŌĆō Practical Examples & Best Practices in Software...
Test Case Design Techniques ŌĆō Practical Examples & Best Practices in Software...Muhammad Fahad Bashir
╠²
Featured (20)
Artificial Intelligence, Data and Competition ŌĆō SCHREPEL ŌĆō June 2024 OECD dis...
Artificial Intelligence, Data and Competition ŌĆō SCHREPEL ŌĆō June 2024 OECD dis...OECD Directorate for Financial and Enterprise Affairs
╠²
This presentation by Thibault Schrepel, Associate Professor of Law at Vrije Universiteit Amsterdam University, was made during the discussion ŌĆ£Artificial Intelligence, Data and CompetitionŌĆØ held at the 143rd meeting of the OECD Competition Committee on 12 June 2024. More papers and presentations on the topic can be found at oe.cd/aicomp.
This presentation was uploaded with the authorŌĆÖs consent.
How to Leverage AI to Boost Employee Wellness - Lydia Di Francesco - SocialHR...
How to Leverage AI to Boost Employee Wellness - Lydia Di Francesco - SocialHR...SocialHRCamp
╠²
The document discusses leveraging AI to enhance employee wellness through data analytics, automating tasks, and personalized wellness apps, emphasizing the shared responsibility of employee well-being between leaders and organizations. It outlines best practices for using AI in wellness strategies, including ensuring data privacy and security, understanding employee needs, and promoting inclusivity. Lydia Di Francesco, a wellness specialist, shares insights to optimize workplace wellness strategy using AI-driven data analytics and encourages collaboration and transparency.2024 State of Marketing Report ŌĆō by Hubspot
2024 State of Marketing Report ŌĆō by HubspotMarius Sescu
╠²
The State of Marketing 2024 report highlights the transformative impact of AI and automation, emphasizing the importance of personalization and engagement to drive growth in a competitive landscape. Marketers are focusing on optimizing budgets, leveraging social media for brand awareness, and utilizing AI tools to enhance efficiency across tasks. Key trends for 2024 include the rise of experiential marketing, content creation that meets user needs, and strengthened connections through personalized customer experiences.Everything You Need To Know About ChatGPT
Everything You Need To Know About ChatGPTExpeed Software
╠²
ChatGPT is an AI chatbot developed by OpenAI, built on advanced language models to facilitate human-like conversational interactions. Launched in November 2022, it utilizes a transformer architecture to understand and generate text, with applications ranging from content creation to customer service. Despite its capabilities, there are concerns about potential misuse and biases in its responses, which OpenAI aims to mitigate through moderation and user feedback.Product Design Trends in 2024 | Teenage Engineerings
Product Design Trends in 2024 | Teenage EngineeringsPixeldarts
╠²
The realm of product design is a constantly changing environment where technology and style intersect. Every year introduces fresh challenges and exciting trends that mold the future of this captivating art form. In this piece, we delve into the significant trends set to influence the look and functionality of product design in the year 2024.How Race, Age and Gender Shape Attitudes Towards Mental Health
How Race, Age and Gender Shape Attitudes Towards Mental HealthThinkNow
╠²
The November 2023 mental health report indicates that 70% of respondents rate their mental health as 'good' or 'excellent,' with higher diagnoses reported among African Americans and non-Hispanic whites compared to Hispanics and Asians. Younger generations, particularly Gen Z and millennials, are more likely to experience mental health challenges, seek information online, and report that their mental health impacts their work and relationships. Half of the respondents feel comfortable discussing their mental health with professionals, although Gen Z shows the least comfort in this area.AI Trends in Creative Operations 2024 by Artwork Flow.pdf
AI Trends in Creative Operations 2024 by Artwork Flow.pdfmarketingartwork
╠²
Creative operations teams expect increased AI use in 2024. Currently, over half of tasks are not AI-enabled, but this is expected to decrease in the coming year. ChatGPT is the most popular AI tool currently. Business leaders are more actively exploring AI benefits than individual contributors. Most respondents do not believe AI will impact workforce size in 2024. However, some inhibitions still exist around AI accuracy and lack of understanding. Creatives primarily want to use AI to save time on mundane tasks and boost productivity.Skeleton Culture Code
Skeleton Culture CodeSkeleton Technologies
╠²
Organizational culture includes values, norms, systems, symbols, language, assumptions, beliefs, and habits that influence employee behaviors and how people interpret those behaviors. It is important because culture can help or hinder a company's success. Some key aspects of Netflix's culture that help it achieve results include hiring smartly so every position has stars, focusing on attitude over just aptitude, and having a strict policy against peacocks, whiners, and jerks.PEPSICO Presentation to CAGNY Conference Feb 2024
PEPSICO Presentation to CAGNY Conference Feb 2024Neil Kimberley
╠²
PepsiCo provided a safe harbor statement noting that any forward-looking statements are based on currently available information and are subject to risks and uncertainties. It also provided information on non-GAAP measures and directing readers to its website for disclosure and reconciliation. The document then discussed PepsiCo's business overview, including that it is a global beverage and convenient food company with iconic brands, $91 billion in net revenue in 2023, and nearly $14 billion in core operating profit. It operates through a divisional structure with a focus on local consumers.Content Methodology: A Best Practices Report (Webinar)
Content Methodology: A Best Practices Report (Webinar)contently
╠²
This document provides an overview of content methodology best practices. It defines content methodology as establishing objectives, KPIs, and a culture of continuous learning and iteration. An effective methodology focuses on connecting with audiences, creating optimal content, and optimizing processes. It also discusses why a methodology is needed due to the competitive landscape, proliferation of channels, and opportunities for improvement. Components of an effective methodology include defining objectives and KPIs, audience analysis, identifying opportunities, and evaluating resources. The document concludes with recommendations around creating a content plan, testing and optimizing content over 90 days.How to Prepare For a Successful Job Search for 2024
How to Prepare For a Successful Job Search for 2024Albert Qian
╠²
The document provides guidance on preparing a job search for 2024. It discusses the state of the job market, focusing on growth in AI and healthcare but also continued layoffs. It recommends figuring out what you want to do by researching interests and skills, then conducting informational interviews. The job search should involve building a personal brand on LinkedIn, actively applying to jobs, tailoring resumes and interviews, maintaining job hunting as a habit, and continuing self-improvement. Once hired, the document advises setting new goals and keeping skills and networking active in case of future opportunities.Social Media Marketing Trends 2024 // The Global Indie Insights
Social Media Marketing Trends 2024 // The Global Indie InsightsKurio // The Social Media Age(ncy)
╠²
The 2024 social media marketing trends report highlights significant shifts influenced by generative AI, including the emergence of personalized content, the rise of virtual influencers, and a stronger focus on user-generated content. Insights were gathered from 33 experts across 23 leading independent agencies, providing a perspective that emphasizes creativity and authenticity in marketing strategies. Key trends also include the blending of B2B and B2C approaches, reflecting changes in consumer behavior and the evolving landscape of social media engagement.Trends In Paid Search: Navigating The Digital Landscape In 2024
Trends In Paid Search: Navigating The Digital Landscape In 2024Search Engine Journal
╠²
The document discusses trends in paid search for 2024, highlighting changes in user behavior, the implications for financial services, and privacy challenges. It emphasizes the importance of adapting search strategies, utilizing AI-driven tools like performance max and smart bidding, and leveraging first-party data for better marketing efficacy. Key takeaways include holistic SEO and SEM approaches, monitoring shifting user intents, and the need for continuous performance evaluation.5 Public speaking tips from TED - Visualized summary
5 Public speaking tips from TED - Visualized summarySpeakerHub
╠²
The document outlines five public speaking tips from Chris Anderson, TED Talks curator, emphasizing the importance of eye contact, vulnerability, humor, humility, and storytelling. These skills are presented as essential for engaging audiences effectively and are increasingly valuable in today's economy. The article posits that mastering these techniques can enhance speakers' ability to communicate ideas powerfully.ChatGPT and the Future of Work - Clark Boyd
ChatGPT and the Future of Work - Clark Boyd Clark Boyd
╠²
The document provides an overview of generative AI, particularly focusing on ChatGPT and its implications for business and the job market. It discusses the rapid growth of generative AI, its applications in marketing, and the skills needed for the AI era while addressing potential job displacement and the need for adaptation. The agenda includes a Q&A session and emphasizes rethinking work in collaboration with AI technology.Getting into the tech field. what next
Getting into the tech field. what next Tessa Mero
╠²
The document provides career advice for getting into the tech field, including:
- Doing projects and internships in college to build a portfolio.
- Learning about different roles and technologies through industry research.
- Contributing to open source projects to build experience and network.
- Developing a personal brand through a website and social media presence.
- Networking through events, communities, and finding a mentor.
- Practicing interviews through mock interviews and whiteboarding coding questions.Google's Just Not That Into You: Understanding Core Updates & Search Intent
Google's Just Not That Into You: Understanding Core Updates & Search IntentLily Ray
╠²
1. Core updates from Google periodically change how its algorithms assess and rank websites and pages. This can impact rankings through shifts in user intent, site quality issues being caught up to, world events influencing queries, and overhauls to search like the E-A-T framework.
2. There are many possible user intents beyond just transactional, navigational and informational. Identifying intent shifts is important during core updates. Sites may need to optimize for new intents through different content types and sections.
3. Responding effectively to core updates requires analyzing "before and after" data to understand changes, identifying new intents or page types, and ensuring content matches appropriate intents across video, images, knowledge graphs and more.How to have difficult conversations
How to have difficult conversations Rajiv Jayarajah, MAppComm, ACC
╠²
The document provides essential tips on how to handle difficult conversations in a workplace setting, emphasizing the importance of preparation, environment, and timing. It highlights that many employees dread such conversations, often leading to avoidance and worsening situations. Ultimately, the guide aims to promote positive outcomes while maintaining professional relationships.Introduction to Data Science
Introduction to Data ScienceChristy Abraham Joy
╠²
The document discusses the rise and importance of data science and machine learning, highlighting the growing demand for data scientists and the challenges they face. It explains machine learning concepts such as supervised and unsupervised learning, along with various real-world applications and the necessary steps involved in a machine learning workflow. Additionally, the document emphasizes the iterative process of model improvement and feature engineering used to enhance machine learning outcomes.Time Management & Productivity - Best Practices
Time Management & Productivity - Best PracticesVit Horky
╠²
The document outlines best practices for time management and productivity, focusing on effective meeting habits, structured work blocks, and the importance of reflection and goal setting. It emphasizes the need for proper planning, the use of appropriate tools, and prioritizing tasks to enhance both personal and team efficiency. Additionally, personal anecdotes and strategies are shared to encourage a positive mindset and enjoyment in achieving work-related goals.Artificial Intelligence, Data and Competition ŌĆō SCHREPEL ŌĆō June 2024 OECD dis...
Artificial Intelligence, Data and Competition ŌĆō SCHREPEL ŌĆō June 2024 OECD dis...OECD Directorate for Financial and Enterprise Affairs
╠²
Ad
Exam2
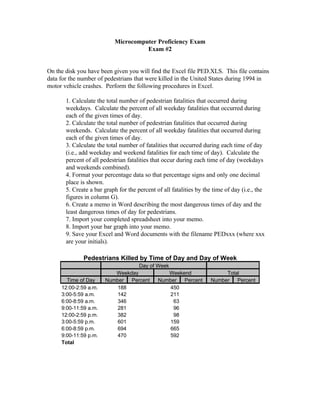
- 1. Microcomputer Proficiency Exam Exam #2 On the disk you have been given you will find the Excel file PED.XLS. This file contains data for the number of pedestrians that were killed in the United States during 1994 in motor vehicle crashes. Perform the following procedures in Excel. 1. Calculate the total number of pedestrian fatalities that occurred during weekdays. Calculate the percent of all weekday fatalities that occurred during each of the given times of day. 2. Calculate the total number of pedestrian fatalities that occurred during weekends. Calculate the percent of all weekday fatalities that occurred during each of the given times of day. 3. Calculate the total number of fatalities that occurred during each time of day (i.e., add weekday and weekend fatalities for each time of day). Calculate the percent of all pedestrian fatalities that occur during each time of day (weekdays and weekends combined). 4. Format your percentage data so that percentage signs and only one decimal place is shown. 5. Create a bar graph for the percent of all fatalities by the time of day (i.e., the figures in column G). 6. Create a memo in Word describing the most dangerous times of day and the least dangerous times of day for pedestrians. 7. Import your completed spreadsheet into your memo. 8. Import your bar graph into your memo. 9. Save your Excel and Word documents with the filename PEDxxx (where xxx are your initials). Pedestrians Killed by Time of Day and Day of Week Day of Week Weekday Weekend Total Time of Day Number Percent Number Percent Number Percent 12:00-2:59 a.m. 188 450 3:00-5:59 a.m. 142 211 6:00-8:59 a.m. 346 63 9:00-11:59 a.m. 281 96 12:00-2:59 p.m. 382 98 3:00-5:59 p.m. 601 159 6:00-8:59 p.m. 694 665 9:00-11:59 p.m. 470 592 Total