際際滷

際際滷Share a Scribd company logo
2
Most read
5
Most read
10
Most read
ESM 3024 Lab: 
Experiment #1 
Measurements of Fluid Properties  Density and Viscosity 
Authors: 
Drew Lovell 
John Naessens 
Date: 9/9/14 Time: 2:00  4:50 p.m.
Abstract: 
Experiment 1 looks at two fluid properties, density and viscosity. Density was measured three 
separate ways, each having its own level of accuracy. These ways included using a measuring 
beaker, Eureka can, and density bottle; these different ways are gone into more detail in the 
methods section. Viscosity of these specimens was then found by using a falling sphere 
viscometer, which will also be explained in the methods section. The reason this experiment 
was conducted is that all fluids experience forces which cause motion throughout the flow. 
Understanding how fluids work and react to forces is important in many areas of life and across 
many fields. The results that were found displayed these characteristics and showed how 
density and viscosity can be calculated through a variety of procedures. 
Introduction: 
This experiment was performed to see how fluids are affected by their density and viscosity. 
Density is the measure of mass per unit volume and is denoted by the symbol, . This 
measurement allows Newtons Second Law to be applied to fluids on a per unit volume basis. 
The mass of the object is generally measured by a balance or scale, as where volume can be 
measured by water displacement, or by simply by calculating it using the objects parameters. 
Viscosity on the other hand is the measure of a fluids resistance to deformation. The more 
viscous a fluid is, the more resistance or thickness it will display. Viscosity is found through an 
equation which utilizes the objects radius, densities of both the fluid and object suspended, 
and gravitational force. Both of these fluid properties can be seen in daily life since everything 
has density and every fluid has a viscosity. 
Motivation: 
The reason for completing this experiment was to learn how to calculate these fluid properties 
and to gain a better knowledge on measuring them accurately. Knowing how density and 
viscosity work is important for flotation, mixing of materials, fluid dynamics, and many other 
real world cases one might come into contact with. When measuring densities, the error of the 
experiments calculations compared to actual values shows which method of taking density is 
more reliable. And when using the falling sphere viscometer it was also seen how accurate the 
gathered values were in comparison to actual known values. Comparing the data in this way 
indicates how close one can get to the actual values and how calculating viscosity and density is 
necessary for other practices.
Methods: 
1.1.1 Density of Water using Measuring Beaker 
Density of water was calculated using a measuring beaker. Density is mass over volume. 
The mass of water was determined by using a scale and finding the difference in the mass of 
the beaker and the mass of a beaker with a designated volume of water. 
a) Measure mass of beaker 
b) Fill beaker with water, record volume 
c) Measure mass of beaker and water 
d) Calculate mass H2O 
e) Calculate density (Mass/Volume) 
f) Record possible error sources 
1.1.2 Density of Water using Eureka Can 
Density of water was calculated using a Eureka can. A 
Eureka can is a metal can with a spout coming out the side. The 
can was filled with water until the water came out of the spout. 
The volume of three solid spheres was calculated by measuring 
their diameter and using the volume equation for a sphere. The 
volume of the spheres was the volume of water displaced from 
the Eureka can. The spheres were dropped into the Eureka can 
and the displaced water was collected in a beaker. The mass of 
water was determined by using a scale and finding the difference 
in the mass of the beaker and the mass of a beaker with a 
designated volume of water. The density was calculated using 
mass/volume. 
a) Calculate volume of three solid spheres provided 
b) Fill eureka can until water flows through spout, wait for flow to stop. 
c) Measure mass of beaker 
d) Place beaker under eureka can spout and place three spheres into eureka can. Allow 
beaker to collect water overflowing out of the spout and wait for the flow to stop. 
e) Measure mass of beaker and collected water. 
f) Calculate mass H2O 
g) Calculate density Mass/Volume 
h) Record possible error sources
1.1.3 Density of Water using Density Bottle 
Density of water was calculated using a density bottle. The 
mass of the dried density bottle was measured using a scale. The 
bottle was filled with water and the outside was dried. The mass of 
the density bottle and water was measured using a scale. The mass 
of water was determined by finding the difference in the mass of 
the density bottle and the mass of the density bottle filled with 
water. The volume of the density bottle was 25ml. The density of 
the water was calculated using mass/volume. 
a) Obtain 25 ml bottle and stopper, measure mass 
b) Fill density bottle with water until it overflows, place stopper on top 
c) Dry outside of density bottle 
d) Measure mass of density bottle with water 
e) Calculate mass H2O 
f) Calculate density Mass/Volume 
g) Record possible error sources 
1.1.4 Specific Weight of Glycerin and Castor Oil using a Hydrometer 
The specific weight of gylcerin and castor oil was 
calculated by using a hydrometer. A hydrometer was placed 
into each fluid to record the specific gravity. The specific gravity 
was used to calculate the density by multiplying the specific 
gravity by the density of water. The specific weight was 
calculated by multiplying the specific gravity with the specific 
weight of water. Calculated specific weight was compared to 
known specific weight to obtain percent error. 
a) Obtain two tall glass cylinders, one filled with castor oil and the other filled with glycerin 
b) Insert hydrometer into each fluid without contacting glass cylinder walls and wait for it 
to settle 
c) Record hydrometer level at bottom of meniscus 
d) Calculate density, specific weight, error
1.1.5 Data Analysis 
The three values for density of water obtained in methods 1.1.1-3 were compared to 
the standard density of water. The most accurate method was determined and explained. 
Specific weights of glycerin and castor oil were compared to standard specific weights. 
Percentage error was explained. 
1.3.1 Viscosity using falling spheres 
The viscosity of castor oil and glycerin were obtained using falling spheres. 
Spheres of three different sizes were individually dropped into each fluid. The 
distance they traveled through the fluid and the time it took to travel that distance 
was recorded. Each sized sphere was dropped three times in each fluid and the 
values were averaged. The velocities were calculated and used to determine the 
dynamic and kinematic velocities. 
a) Measure the mass of 10 spheres of each size and record, calculate mass of a single 
sphere and record. Calculate the volume of each sized sphere and record. 
b) Measure distance between timing bands on each cylinder (castor oil and glycerin) and 
record 
c) Drop each sized ball three times in each fluid. For every drop record the time it takes the 
ball to drop from one timing band to the other 
d) Calculate viscocity, dynamic and kinematic 
Results & Discussions 
1.1.1 Density of Water using Measuring Beaker 
See Table 1.2 in appendix for data 
Mass of water = Mass of Beaker and Water  Mass of Empty Beaker 
Density of water = Mass Water / Volume Water * 103 
Density of water = 963.83 kg/m3 
1.1.2 Density of Water using Eureka Can 
See table 1.3 in appendix for data 
Volume of sphere = 4/3**r3 
Mass of Displaced Water = Mass of Beaker and Water  Mass of Empty Beaker 
Density of water = Mass Water / Volume Water * 103 
Density of water = 938.06 kg/m3 
1.1.3 Density of Water using Density Bottle
See table 1.4 in appendix for data 
Mass of water = Mass of Bottle and Water  Mass of Empty Bottle 
Density of water = Mass Water / Volume Water * 103 
Density of water = 988.08 kg/m3 
1.1.4 Specific Weight of Glycerin and Castor Oil using a Hydrometer 
See table 1.5 in appendix for data 
Density Calculated = Specific Gravity * 1000 kg/m3 
Specific Weight Calculated = Specific Gravity * 981 N/m3 
% error = abs((Actual  Calculated)/Actual) 
Specific Weight Glycerin Calculated = 9466.65 %Error = .521 
Specific Weight Castor Oil Calculated = 12360.6 %Error = .318 
Error due to accuracy of meniscus reading 
1.1.5 Data Analysis 
The most accurate density achieved was the density of water using the density bottle. 
The true density of water is 1000 kg/m3. The second most accurate density achieved was the 
density of water using a measuring beaker. The least accurate density achieved was the density 
of water using a Eureka can. The most accurate density was the density bottle because the 
density bottle is built to have an exact volume of water, removing human error in reading a 
meniscus, which is done using the measuring beaker of Eureka can. 
1.3.1 Viscosity using falling spheres 
See Table 1.6 in Appendix for Sphere density data 
Volume of sphere = 4/3**r3 
Density of Sphere = Mass of one sphere / Volume * 102 
See Table 1.7 in appendix for Viscosity of Glycerin data, 1.8 for Castor Oil 
Velocity = Distance/Time 
亮 = 2/(9u)*r2*(9.81)(s- f) f = 1126.1 kg/m3 
僚 = 亮/ 
Re = UD/亮 
亮 calculated Glycerin = 1.00, 1.08, 1.08 
% error = 32.9, 27.5, 27.5 
亮 calculated Castor Oil = .891, .961, .966 
% error = 9.6, 9.5, 9.5 
Glycerin held a high percentage error. This was due to human error in recording the 
time it took to travel through the time bands and a low level of glycerin (there was no more 
glycerin to raise the level). The low level of glycerin caused the spheres to drop past the first 
time band very quickly and prevent an accurate starting time. The percentage error of Castor oil 
was relatively low compared to that of Glycerin.
Conclusion 
The density of water was calculated using a measuring beaker, eureka can, and density 
bottle. The density bottle was the most accurate way to measure the density of the water with 
a density of 988.08 kg/m3. The density bottle accuracy was followed by the measuring beaker 
then eureka can, which had error due to reading the meniscus. The specific weight of glycerin 
and castor oil were measured using a hydrometer. The hydrometer was very accurate with a 
percentage of error for glycerin of .521% and .318% for castor oil. The specific weight values 
obtained were 9467 (unitless) for castor oil and 12361 (unitless) for glycerin. The viscosities of 
glycerin and castor oil were measured using falling spheres. The viscosity of glycerin had a high 
average percentage error of 29.3% due to a lack of glycerin, which caused a misreading of the 
time it took to travel from time band to time band. Castor oil had a low average percentage 
error, relative to glycerin, at 9.5%. The values for viscosities and Reynolds numbers can be seen 
in tables 1.7 and 1.8 of the appendix.
References: 
i. For Accepted Standard Values 
A. www.simmetric.co.uk/si_liquids.htm 
B. www.science.uwaterloo.ca/~cchieh/caet/c123/liquid.htm 
ii. Virginia Tech ESM 3024 Experiment 1 Lab Manual 
iii. Pictures 
A. Eureka Can 
http://www.andersonscientific.co.uk/images/medium/6165-01.jpg 
B. Density Bottle http://www.mrs-scientific. 
com/images/products/pics/WJ76.jpg 
C. Hydrometer http://avogadro-lab-supply. 
com/images/eBay/Hydrometer%20Reading.JPG 
D. Falling Sphere 
http://upload.wikimedia.org/wikipedia/commons/7/7b/Falling_Sphe 
re_Viscometer.gif
Appendix 
Castor Oil Density at 25C,  956.12 kg/m^3 
Absolute Viscocity 亮 .986 kg/(ms) 
Glycerin Density at 25C,  1126.10 kg/m^3 
Absolute Viscocity 亮 1.49 kg/(ms) 
Table 1.1: Accepted Standard Values 
Mass of Empty 
Beaker 
Measured (g) 
Volume of 
Water in 
Beaker 
Measured (ml) 
Mass of Beaker 
and Water 
Measured (g) 
Mass of 
Water 
Calculated (g) 
Density of 
Water 
Calculated 
(kg/m) 
52.705 80 129.811 77.106 963.825 
Table 1.2: Water Density Using the Measuring Beaker 
Volume of 
Solid Object 
Calculated 
from 
Measured 
Dimensions 
(cm^3) 
Mass of Empty 
Beaker 
Measured (g) 
Mass of Beaker 
and Water 
Measured (g) 
Mass of 
Displaced 
Water 
Calculated (g) 
Density of 
Water 
Calculated 
(kg/m^3) 
20.0424 52.705 71.506 18.801 938.061 
Table 1.3: Water Density Using the Eureka Can 
Volume of 
Density Bottle 
known (ml) 
Mass of Bottle 
Measured (g) 
Mass of bottle, 
stopper, and 
water 
Measured (g) 
Mass of 
Water 
Calculated (g) 
Density of 
Water 
Calculated 
(kg/m^3) 
25 21.802 46.504 24.702 988.08 
Table 1.4: Water Density Using the Density Bottle
Liquid 
Specific 
Gravity 
Measured 
(unit-less) 
Density 
Calculated 
(kg/m^3) 
Specific 
Weight 
Calculated 
(N/m^3) 
Standard 
Specific 
Weight 
Known 
(N/m^3) 
% Error 
Between 
Stand and 
Calculated 
S.W. 
Calculated 
Castor Oil 0.965 965 9466.65 9417.6 0.521 
Glycerin 1.26 1260 12360.6 12400 0.318 
Table 1.5: Specific Weights of Glycerin and Castor Oil 
Diameter 
Measured 
(cm^3) 
Volume 
Calculated 
(cm^3) 
Number of 
Spheres 
Massed 
Total Mass of 
all Spheres 
Measured (g) 
Mass of 
one 
Sphere 
Calculated 
(g) 
Density of 
Spheres 
Calculated 
(kg/m^3) 
0.199 0.00413 10 0.3 0.03 7270.49 
0.299 0.0139 10 1.1 0.11 7859.24 
0.399 0.0333 10 2.6 0.26 7817.29 
Table 1.6: Data Sheet for Sphere Density 
Diameter 
Measured 
(cm) 
Time 
i (s) 
Time 
ii (s) 
Time 
iii (s) 
Table 1.7: Viscosity of Glycerin 
Dist. 
Sphere 
Falls 
(mm) 
Table 1.8: Viscosity of Castor Oil 
Vel I 
(m/s) 
Vel ii 
(m/s) 
Vel iii 
(m/s) 
Mean 
Vel 
(m/s) 
亮 
(Ns/ 
m^2) 
僚 (m^2/s) 
Re 
Calc'd 
Stand 
ard 亮 
(Ns/ 
m^2) 
% 
Error 
for 亮 
0.199 18.06 18.4 18.47 242 0.0134 0.0132 0.0131 0.013 1.00 8.88*10^-4 0.0296 1.49 32.9 
0.299 7.93 7.97 7.94 242 0.0305 0.0304 0.0305 0.031 1.08 9.59*10^-4 0.0951 1.49 27.5 
0.399 4.53 4.47 4.47 242 0.0534 0.0541 0.0541 0.054 1.08 9.59*10^-4 0.2240 1.49 27.5 
Diameter 
Measured 
(cm) 
Time 
i (s) 
Time 
ii (s) 
Time 
iii (s) 
Dist. 
Sphere 
Falls 
(mm) 
Vel I 
(m/s) 
Vel ii 
(m/s) 
Vel iii 
(m/s) 
Mean 
Vel 
(m/s) 
亮 
(Ns/ 
m^2) 
僚 (m^2/s) 
Re 
Calc'd 
Stand 
ard 亮 
(Ns/ 
m^2) 
% 
Error 
for 亮 
0.199 15.75 16.13 16.06 250 0.0150 0.015 0.016 0.015 0.89 9.32*10^-4 0.0327 0.986 9.6 
0.299 7.93 7.97 7.94 242 0.0305 0.0304 0.0305 0.031 1.08 1.01*10^-3 0.0807 0.986 9.5 
0.399 4.53 4.47 4.47 242 0.0534 0.0541 0.0541 0.054 1.08 1.01*10^-3 0.1904 0.986 9.5
Ad

Recommended

Mga kasangkapan at kagamitan sa paggawa
Joemarie Araneta
Sources of finance
Sources of finance
Robert Jose
Lathe operations
Lathe operations
Muddassar Awan
Introduction to Offshore Oil and Gas Surface Facilities
Ir. Puput Risanto, IPM, PMP, PMI-RMP, ASEAN Eng
LAB REPORT HYDRAULIC EXP 1 : PROPERTIES OF FLUID.
YASMINE HASLAN
Structural Analysis 8th Edition Solutions Manual
Bahzad5
Introduction to Biology
Adriel Padernal
Water-Code-of-the-Philippines (1).pptx
BalindoaJom
Reynolds Number Final Report in LAB 1
Nicely Jane Eleccion
Unconfined compression test
Natalie Ulza
Sieve analysis test report
Pavitrah Segaran
flow through venturimeter
Pulkit Shukla
Flow through orifice meter
Pulkit Shukla
Fluid Mechanic Lab - Reynold's Number Experiment
MuhammadSRaniYah
Sieving Final Report
Nicely Jane Eleccion
Discharge Over a broad Crested Weir | Jameel Academy
Jameel Academy
3_hydrostatic-force_tutorial-solution(1)
Diptesh Dash
Fluid Mechanic Lab - Bernoulli Equation
MuhammadSRaniYah
Fluid Mechanic Lab - Venturi Meter
MuhammadSRaniYah
Fluid Flow Rate & Bernoullis Theorem Demonstration
Raboon Redar
Fluid mechanics Lab Report
Muhammad Bilal
Unit 3 Fluid Static
Unit 3 Fluid Static
Malaysia
friction loss along a pipe
Saif al-din ali
Fluid Mechanic Lab - Hydrostatic Pressure
MuhammadSRaniYah
Atterberg
Atterberg
Natalie Ulza
Lab Report 1
Lab Report 1
Blayr Downey
TENSILE TEST REPORT
TENSILE TEST REPORT
musadoto
Fluid Mechanics Chapter 2. Fluid Statics
Addisu Dagne Zegeye
CLASS 8 PHYSICAL QUANTITY & MEASUREMENT
SouvikChatterjee53
Determination of DensityRequired materials provided in t
mackulaytoni

More Related Content

What's hot (20)

Reynolds Number Final Report in LAB 1
Nicely Jane Eleccion
Unconfined compression test
Natalie Ulza
Sieve analysis test report
Pavitrah Segaran
flow through venturimeter
Pulkit Shukla
Flow through orifice meter
Pulkit Shukla
Fluid Mechanic Lab - Reynold's Number Experiment
MuhammadSRaniYah
Sieving Final Report
Nicely Jane Eleccion
Discharge Over a broad Crested Weir | Jameel Academy
Jameel Academy
3_hydrostatic-force_tutorial-solution(1)
Diptesh Dash
Fluid Mechanic Lab - Bernoulli Equation
MuhammadSRaniYah
Fluid Mechanic Lab - Venturi Meter
MuhammadSRaniYah
Fluid Flow Rate & Bernoullis Theorem Demonstration
Raboon Redar
Fluid mechanics Lab Report
Muhammad Bilal
Unit 3 Fluid Static
Unit 3 Fluid Static
Malaysia
friction loss along a pipe
Saif al-din ali
Fluid Mechanic Lab - Hydrostatic Pressure
MuhammadSRaniYah
Atterberg
Atterberg
Natalie Ulza
Lab Report 1
Lab Report 1
Blayr Downey
TENSILE TEST REPORT
TENSILE TEST REPORT
musadoto
Fluid Mechanics Chapter 2. Fluid Statics
Addisu Dagne Zegeye
Reynolds Number Final Report in LAB 1
Nicely Jane Eleccion
Unconfined compression test
Natalie Ulza
Sieve analysis test report
Pavitrah Segaran
flow through venturimeter
Pulkit Shukla
Flow through orifice meter
Pulkit Shukla
Fluid Mechanic Lab - Reynold's Number Experiment
MuhammadSRaniYah
Discharge Over a broad Crested Weir | Jameel Academy
Jameel Academy
3_hydrostatic-force_tutorial-solution(1)
Diptesh Dash
Fluid Mechanic Lab - Bernoulli Equation
MuhammadSRaniYah
Fluid Mechanic Lab - Venturi Meter
MuhammadSRaniYah
Fluid Flow Rate & Bernoullis Theorem Demonstration
Raboon Redar
Fluid mechanics Lab Report
Muhammad Bilal
Unit 3 Fluid Static
Unit 3 Fluid Static
Malaysia
friction loss along a pipe
Saif al-din ali
Fluid Mechanic Lab - Hydrostatic Pressure
MuhammadSRaniYah
TENSILE TEST REPORT
TENSILE TEST REPORT
musadoto
Fluid Mechanics Chapter 2. Fluid Statics
Addisu Dagne Zegeye

Similar to Experiment 1 (20)

CLASS 8 PHYSICAL QUANTITY & MEASUREMENT
SouvikChatterjee53
Determination of DensityRequired materials provided in t
mackulaytoni
E1.docx
E1.docx
JustineBatuyong
Physical quantities and mesurment
ArushDeep1
Density measurement
Density measurement
Sruthy K S
1. Density and Specific Gravity Laboratory.pptx
xkarimtarek
Density(bpp)
Density(bpp)
Chaiporn Pattanajak
Density 1
Density 1
Solomon Ojiemudia
Petroleum Properties - Density and relative density
Student
14.NIPERA2325PA16 vaibhav paithane - Vaibhav Paithane.pptx
Rushikesh Tamhane
Master Thesis Defence: Density of Oil-related Systems at High Pressures - Exp...
Vasilis Vasou
# 3 properties of matter 1.docx
Colegio La inmaculada
1.4 form 4 density
1.4 form 4 density
chris lembalemba
Biology density
Biology density
M, Michelle Jeannite
Biology density quiz
M, Michelle Jeannite
Density
Density
rbrindley
2 8 density
2 8 density
Paul Cuaresma
Fluid mechanic
Fluid mechanic
Z Emmanuel Gweh III
Hydrometer
Hydrometer
Aree Salah
Density, Mass, & Weight
Gary Abud Jr
CLASS 8 PHYSICAL QUANTITY & MEASUREMENT
SouvikChatterjee53
Determination of DensityRequired materials provided in t
mackulaytoni
Physical quantities and mesurment
ArushDeep1
Density measurement
Density measurement
Sruthy K S
1. Density and Specific Gravity Laboratory.pptx
xkarimtarek
Petroleum Properties - Density and relative density
Student
14.NIPERA2325PA16 vaibhav paithane - Vaibhav Paithane.pptx
Rushikesh Tamhane
Master Thesis Defence: Density of Oil-related Systems at High Pressures - Exp...
Vasilis Vasou
Density, Mass, & Weight
Gary Abud Jr
Ad

Experiment 1

  • 1. ESM 3024 Lab: Experiment #1 Measurements of Fluid Properties Density and Viscosity Authors: Drew Lovell John Naessens Date: 9/9/14 Time: 2:00 4:50 p.m.
  • 2. Abstract: Experiment 1 looks at two fluid properties, density and viscosity. Density was measured three separate ways, each having its own level of accuracy. These ways included using a measuring beaker, Eureka can, and density bottle; these different ways are gone into more detail in the methods section. Viscosity of these specimens was then found by using a falling sphere viscometer, which will also be explained in the methods section. The reason this experiment was conducted is that all fluids experience forces which cause motion throughout the flow. Understanding how fluids work and react to forces is important in many areas of life and across many fields. The results that were found displayed these characteristics and showed how density and viscosity can be calculated through a variety of procedures. Introduction: This experiment was performed to see how fluids are affected by their density and viscosity. Density is the measure of mass per unit volume and is denoted by the symbol, . This measurement allows Newtons Second Law to be applied to fluids on a per unit volume basis. The mass of the object is generally measured by a balance or scale, as where volume can be measured by water displacement, or by simply by calculating it using the objects parameters. Viscosity on the other hand is the measure of a fluids resistance to deformation. The more viscous a fluid is, the more resistance or thickness it will display. Viscosity is found through an equation which utilizes the objects radius, densities of both the fluid and object suspended, and gravitational force. Both of these fluid properties can be seen in daily life since everything has density and every fluid has a viscosity. Motivation: The reason for completing this experiment was to learn how to calculate these fluid properties and to gain a better knowledge on measuring them accurately. Knowing how density and viscosity work is important for flotation, mixing of materials, fluid dynamics, and many other real world cases one might come into contact with. When measuring densities, the error of the experiments calculations compared to actual values shows which method of taking density is more reliable. And when using the falling sphere viscometer it was also seen how accurate the gathered values were in comparison to actual known values. Comparing the data in this way indicates how close one can get to the actual values and how calculating viscosity and density is necessary for other practices.
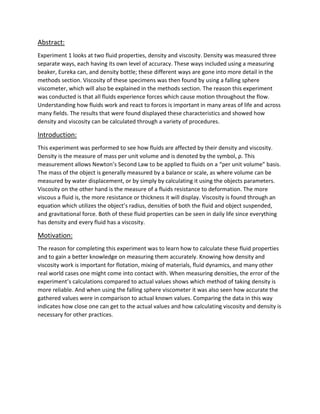
  • 3. Methods: 1.1.1 Density of Water using Measuring Beaker Density of water was calculated using a measuring beaker. Density is mass over volume. The mass of water was determined by using a scale and finding the difference in the mass of the beaker and the mass of a beaker with a designated volume of water. a) Measure mass of beaker b) Fill beaker with water, record volume c) Measure mass of beaker and water d) Calculate mass H2O e) Calculate density (Mass/Volume) f) Record possible error sources 1.1.2 Density of Water using Eureka Can Density of water was calculated using a Eureka can. A Eureka can is a metal can with a spout coming out the side. The can was filled with water until the water came out of the spout. The volume of three solid spheres was calculated by measuring their diameter and using the volume equation for a sphere. The volume of the spheres was the volume of water displaced from the Eureka can. The spheres were dropped into the Eureka can and the displaced water was collected in a beaker. The mass of water was determined by using a scale and finding the difference in the mass of the beaker and the mass of a beaker with a designated volume of water. The density was calculated using mass/volume. a) Calculate volume of three solid spheres provided b) Fill eureka can until water flows through spout, wait for flow to stop. c) Measure mass of beaker d) Place beaker under eureka can spout and place three spheres into eureka can. Allow beaker to collect water overflowing out of the spout and wait for the flow to stop. e) Measure mass of beaker and collected water. f) Calculate mass H2O g) Calculate density Mass/Volume h) Record possible error sources
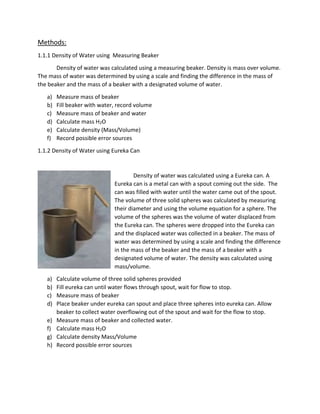
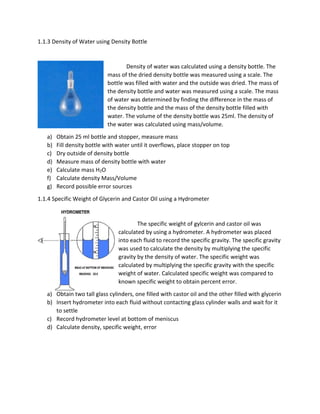
  • 4. 1.1.3 Density of Water using Density Bottle Density of water was calculated using a density bottle. The mass of the dried density bottle was measured using a scale. The bottle was filled with water and the outside was dried. The mass of the density bottle and water was measured using a scale. The mass of water was determined by finding the difference in the mass of the density bottle and the mass of the density bottle filled with water. The volume of the density bottle was 25ml. The density of the water was calculated using mass/volume. a) Obtain 25 ml bottle and stopper, measure mass b) Fill density bottle with water until it overflows, place stopper on top c) Dry outside of density bottle d) Measure mass of density bottle with water e) Calculate mass H2O f) Calculate density Mass/Volume g) Record possible error sources 1.1.4 Specific Weight of Glycerin and Castor Oil using a Hydrometer The specific weight of gylcerin and castor oil was calculated by using a hydrometer. A hydrometer was placed into each fluid to record the specific gravity. The specific gravity was used to calculate the density by multiplying the specific gravity by the density of water. The specific weight was calculated by multiplying the specific gravity with the specific weight of water. Calculated specific weight was compared to known specific weight to obtain percent error. a) Obtain two tall glass cylinders, one filled with castor oil and the other filled with glycerin b) Insert hydrometer into each fluid without contacting glass cylinder walls and wait for it to settle c) Record hydrometer level at bottom of meniscus d) Calculate density, specific weight, error
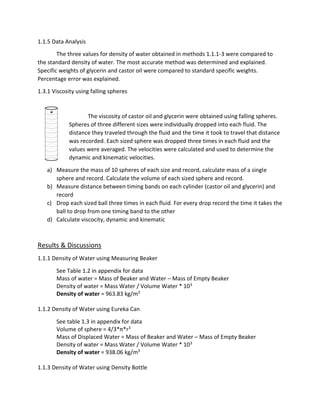
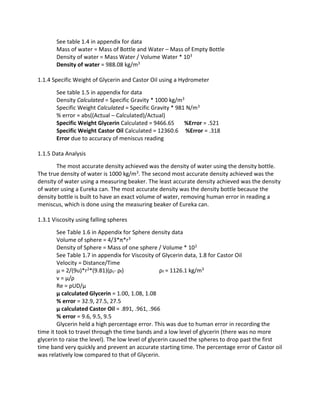
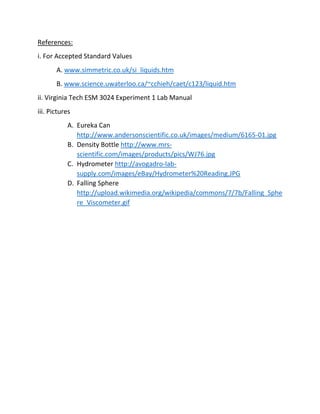
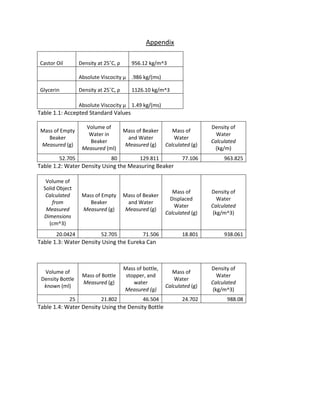
  • 5. 1.1.5 Data Analysis The three values for density of water obtained in methods 1.1.1-3 were compared to the standard density of water. The most accurate method was determined and explained. Specific weights of glycerin and castor oil were compared to standard specific weights. Percentage error was explained. 1.3.1 Viscosity using falling spheres The viscosity of castor oil and glycerin were obtained using falling spheres. Spheres of three different sizes were individually dropped into each fluid. The distance they traveled through the fluid and the time it took to travel that distance was recorded. Each sized sphere was dropped three times in each fluid and the values were averaged. The velocities were calculated and used to determine the dynamic and kinematic velocities. a) Measure the mass of 10 spheres of each size and record, calculate mass of a single sphere and record. Calculate the volume of each sized sphere and record. b) Measure distance between timing bands on each cylinder (castor oil and glycerin) and record c) Drop each sized ball three times in each fluid. For every drop record the time it takes the ball to drop from one timing band to the other d) Calculate viscocity, dynamic and kinematic Results & Discussions 1.1.1 Density of Water using Measuring Beaker See Table 1.2 in appendix for data Mass of water = Mass of Beaker and Water Mass of Empty Beaker Density of water = Mass Water / Volume Water * 103 Density of water = 963.83 kg/m3 1.1.2 Density of Water using Eureka Can See table 1.3 in appendix for data Volume of sphere = 4/3**r3 Mass of Displaced Water = Mass of Beaker and Water Mass of Empty Beaker Density of water = Mass Water / Volume Water * 103 Density of water = 938.06 kg/m3 1.1.3 Density of Water using Density Bottle
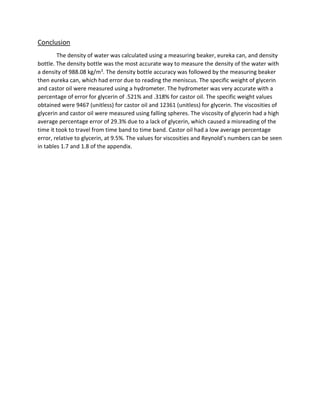
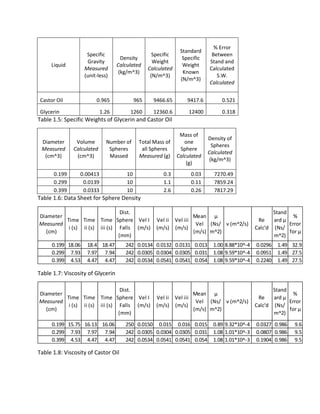
  • 6. See table 1.4 in appendix for data Mass of water = Mass of Bottle and Water Mass of Empty Bottle Density of water = Mass Water / Volume Water * 103 Density of water = 988.08 kg/m3 1.1.4 Specific Weight of Glycerin and Castor Oil using a Hydrometer See table 1.5 in appendix for data Density Calculated = Specific Gravity * 1000 kg/m3 Specific Weight Calculated = Specific Gravity * 981 N/m3 % error = abs((Actual Calculated)/Actual) Specific Weight Glycerin Calculated = 9466.65 %Error = .521 Specific Weight Castor Oil Calculated = 12360.6 %Error = .318 Error due to accuracy of meniscus reading 1.1.5 Data Analysis The most accurate density achieved was the density of water using the density bottle. The true density of water is 1000 kg/m3. The second most accurate density achieved was the density of water using a measuring beaker. The least accurate density achieved was the density of water using a Eureka can. The most accurate density was the density bottle because the density bottle is built to have an exact volume of water, removing human error in reading a meniscus, which is done using the measuring beaker of Eureka can. 1.3.1 Viscosity using falling spheres See Table 1.6 in Appendix for Sphere density data Volume of sphere = 4/3**r3 Density of Sphere = Mass of one sphere / Volume * 102 See Table 1.7 in appendix for Viscosity of Glycerin data, 1.8 for Castor Oil Velocity = Distance/Time 亮 = 2/(9u)*r2*(9.81)(s- f) f = 1126.1 kg/m3 僚 = 亮/ Re = UD/亮 亮 calculated Glycerin = 1.00, 1.08, 1.08 % error = 32.9, 27.5, 27.5 亮 calculated Castor Oil = .891, .961, .966 % error = 9.6, 9.5, 9.5 Glycerin held a high percentage error. This was due to human error in recording the time it took to travel through the time bands and a low level of glycerin (there was no more glycerin to raise the level). The low level of glycerin caused the spheres to drop past the first time band very quickly and prevent an accurate starting time. The percentage error of Castor oil was relatively low compared to that of Glycerin.
  • 7. Conclusion The density of water was calculated using a measuring beaker, eureka can, and density bottle. The density bottle was the most accurate way to measure the density of the water with a density of 988.08 kg/m3. The density bottle accuracy was followed by the measuring beaker then eureka can, which had error due to reading the meniscus. The specific weight of glycerin and castor oil were measured using a hydrometer. The hydrometer was very accurate with a percentage of error for glycerin of .521% and .318% for castor oil. The specific weight values obtained were 9467 (unitless) for castor oil and 12361 (unitless) for glycerin. The viscosities of glycerin and castor oil were measured using falling spheres. The viscosity of glycerin had a high average percentage error of 29.3% due to a lack of glycerin, which caused a misreading of the time it took to travel from time band to time band. Castor oil had a low average percentage error, relative to glycerin, at 9.5%. The values for viscosities and Reynolds numbers can be seen in tables 1.7 and 1.8 of the appendix.
  • 8. References: i. For Accepted Standard Values A. www.simmetric.co.uk/si_liquids.htm B. www.science.uwaterloo.ca/~cchieh/caet/c123/liquid.htm ii. Virginia Tech ESM 3024 Experiment 1 Lab Manual iii. Pictures A. Eureka Can http://www.andersonscientific.co.uk/images/medium/6165-01.jpg B. Density Bottle http://www.mrs-scientific. com/images/products/pics/WJ76.jpg C. Hydrometer http://avogadro-lab-supply. com/images/eBay/Hydrometer%20Reading.JPG D. Falling Sphere http://upload.wikimedia.org/wikipedia/commons/7/7b/Falling_Sphe re_Viscometer.gif
  • 9. Appendix Castor Oil Density at 25C, 956.12 kg/m^3 Absolute Viscocity 亮 .986 kg/(ms) Glycerin Density at 25C, 1126.10 kg/m^3 Absolute Viscocity 亮 1.49 kg/(ms) Table 1.1: Accepted Standard Values Mass of Empty Beaker Measured (g) Volume of Water in Beaker Measured (ml) Mass of Beaker and Water Measured (g) Mass of Water Calculated (g) Density of Water Calculated (kg/m) 52.705 80 129.811 77.106 963.825 Table 1.2: Water Density Using the Measuring Beaker Volume of Solid Object Calculated from Measured Dimensions (cm^3) Mass of Empty Beaker Measured (g) Mass of Beaker and Water Measured (g) Mass of Displaced Water Calculated (g) Density of Water Calculated (kg/m^3) 20.0424 52.705 71.506 18.801 938.061 Table 1.3: Water Density Using the Eureka Can Volume of Density Bottle known (ml) Mass of Bottle Measured (g) Mass of bottle, stopper, and water Measured (g) Mass of Water Calculated (g) Density of Water Calculated (kg/m^3) 25 21.802 46.504 24.702 988.08 Table 1.4: Water Density Using the Density Bottle
  • 10. Liquid Specific Gravity Measured (unit-less) Density Calculated (kg/m^3) Specific Weight Calculated (N/m^3) Standard Specific Weight Known (N/m^3) % Error Between Stand and Calculated S.W. Calculated Castor Oil 0.965 965 9466.65 9417.6 0.521 Glycerin 1.26 1260 12360.6 12400 0.318 Table 1.5: Specific Weights of Glycerin and Castor Oil Diameter Measured (cm^3) Volume Calculated (cm^3) Number of Spheres Massed Total Mass of all Spheres Measured (g) Mass of one Sphere Calculated (g) Density of Spheres Calculated (kg/m^3) 0.199 0.00413 10 0.3 0.03 7270.49 0.299 0.0139 10 1.1 0.11 7859.24 0.399 0.0333 10 2.6 0.26 7817.29 Table 1.6: Data Sheet for Sphere Density Diameter Measured (cm) Time i (s) Time ii (s) Time iii (s) Table 1.7: Viscosity of Glycerin Dist. Sphere Falls (mm) Table 1.8: Viscosity of Castor Oil Vel I (m/s) Vel ii (m/s) Vel iii (m/s) Mean Vel (m/s) 亮 (Ns/ m^2) 僚 (m^2/s) Re Calc'd Stand ard 亮 (Ns/ m^2) % Error for 亮 0.199 18.06 18.4 18.47 242 0.0134 0.0132 0.0131 0.013 1.00 8.88*10^-4 0.0296 1.49 32.9 0.299 7.93 7.97 7.94 242 0.0305 0.0304 0.0305 0.031 1.08 9.59*10^-4 0.0951 1.49 27.5 0.399 4.53 4.47 4.47 242 0.0534 0.0541 0.0541 0.054 1.08 9.59*10^-4 0.2240 1.49 27.5 Diameter Measured (cm) Time i (s) Time ii (s) Time iii (s) Dist. Sphere Falls (mm) Vel I (m/s) Vel ii (m/s) Vel iii (m/s) Mean Vel (m/s) 亮 (Ns/ m^2) 僚 (m^2/s) Re Calc'd Stand ard 亮 (Ns/ m^2) % Error for 亮 0.199 15.75 16.13 16.06 250 0.0150 0.015 0.016 0.015 0.89 9.32*10^-4 0.0327 0.986 9.6 0.299 7.93 7.97 7.94 242 0.0305 0.0304 0.0305 0.031 1.08 1.01*10^-3 0.0807 0.986 9.5 0.399 4.53 4.47 4.47 242 0.0534 0.0541 0.0541 0.054 1.08 1.01*10^-3 0.1904 0.986 9.5