Fin 600_Radio one-Team 3_ final slides.pptx
- 1. TEAM 3 Boyega Ajayi Ines Chen Damon Delorenzis Jessica Jusuf Doreen Marcher
- 2. ´ü¢ Opportunity for Radio One as a result of divestures by Clear Channel Communications. ´ü¢ Potential acquisitions of 21 stations ´ü¢ What is the right price?
- 3. ´ü¢ The consolidation trend in the radio station industry. ´ü¢ Reduced expenses ´ü¢ Increased prices for radio stations ´ü¢ Divestiture by Clear Channel
- 4. ´ü¢ Evaluate the Broadcast Cash Flows (BCF) of the targeted radio stations ´ü¢ Determine and evaluate appropriate multiples that can be used to evaluate the potential acquisitions ´ü¢ Determine an appropriate offer price for the targeted radio stations
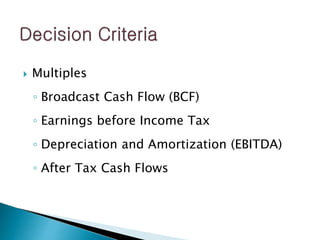
- 5. ´ü¢ Multiples Ôùª Broadcast Cash Flow (BCF) Ôùª Earnings before Income Tax Ôùª Depreciation and Amortization (EBITDA) Ôùª After Tax Cash Flows
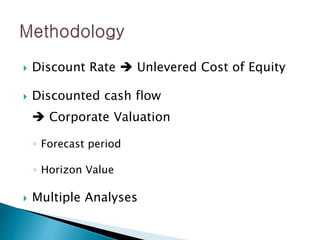
- 6. ´ü¢ Discount Rate ´â¿ Unlevered Cost of Equity ´ü¢ Discounted cash flow ´â¿ Corporate Valuation Ôùª Forecast period Ôùª Horizon Value ´ü¢ Multiple Analyses
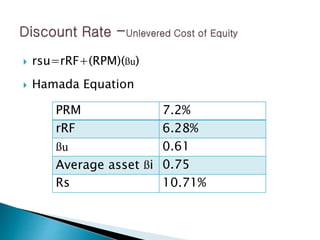
- 7. ´ü¢ rsu=rRF+(RPM)(├ƒu) ´ü¢ Hamada Equation PRM 7.2% rRF 6.28% ├ƒu 0.61 Average asset ├ƒi 0.75 Rs 10.71%
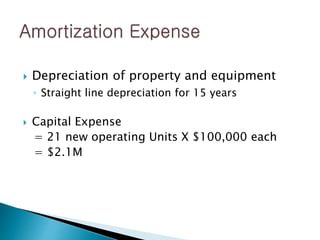
- 8. ´ü¢ Depreciation of property and equipment Ôùª Straight line depreciation for 15 years ´ü¢ Capital Expense = 21 new operating Units X $100,000 each = $2.1M
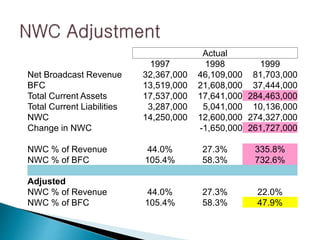
- 9. Actual 1997 1998 1999 Net Broadcast Revenue 32,367,000 46,109,000 81,703,000 BFC 13,519,000 21,608,000 37,444,000 Total Current Assets 17,537,000 17,641,000 284,463,000 Total Current Liabilities 3,287,000 5,041,000 10,136,000 NWC 14,250,000 12,600,000 274,327,000 Change in NWC -1,650,000 261,727,000 NWC % of Revenue 44.0% 27.3% 335.8% NWC % of BFC 105.4% 58.3% 732.6% Adjusted NWC % of Revenue 44.0% 27.3% 22.0% NWC % of BFC 105.4% 58.3% 47.9%
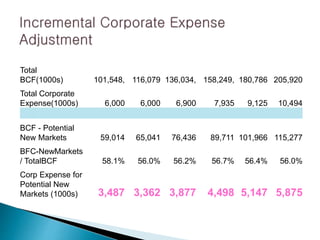
- 10. Total BCF(1000s) 101,548, 116,079 136,034, 158,249, 180,786 205,920 Total Corporate Expense(1000s) 6,000 6,000 6,900 7,935 9,125 10,494 BCF - Potential New Markets 59,014 65,041 76,436 89,711 101,966 115,277 BFC-NewMarkets / TotalBCF 58.1% 56.0% 56.2% 56.7% 56.4% 56.0% Corp Expense for Potential New Markets (1000s) 3,487 3,362 3,877 4,498 5,147 5,875
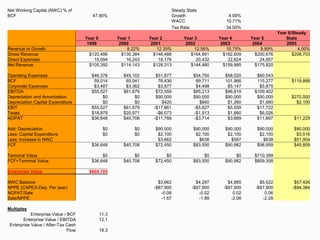
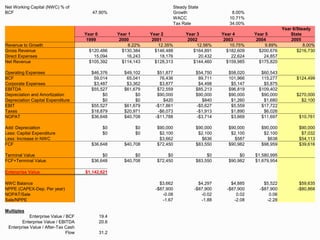
- 11. Net Working Capital (NWC) % of BCF 47.90% Steady State Growth 4.00% WACC 10.71% Tax Rate 34.00% Year 0 Year 1 Year 2 Year 3 Year 4 Year 5 Year 6/Steady State 1999 2000 2001 2002 2003 2004 2005 Revenue to Growth 8.22% 12.35% 12.56% 10.75% 9.89% 4.00% Gross Revenue $120,486 $130,384 $146,488 $164,891 $182,609 $200,676 $208,703 Direct Expenses 15,094 16,243 18,176 20,432 22,624 24,857 Net Revenue $105,392 $114,143 $128,313 $144,460 $159,985 $175,820 Operating Expenses $46,376 $49,102 $51,877 $54,750 $58,020 $60,543 BCF 59,014 65,041 76,436 89,711 101,966 115,277 $119,888 Corporate Expenses $3,487 $3,362 $3,877 $4,498 $5,147 $5,875 EBITDA $55,527 $61,679 $72,559 $85,213 $96,819 $109,402 Depreciation and Amortization $0 $0 $90,000 $90,000 $90,000 $90,000 $270,000 Depreciation Capital Expenditure $0 $0 $420 $840 $1,260 $1,680 $2,100 EBIT $55,527 $61,679 -$17,861 -$5,627 $5,559 $17,722 Taxes $18,879 $20,971 -$6,073 -$1,913 $1,890 $6,026 NOPAT $36,648 $40,708 -$11,788 -$3,714 $3,669 $11,697 $11,229 Add: Depreciation $0 $0 $90,000 $90,000 $90,000 $90,000 $90,000 Less: Capital Expenditure $0 $0 $2,100 $2,100 $2,100 $2,100 $3,516 Less: Increase in NWC $3,662 $636 $587 $638 $51,904 FCF $36,648 $40,708 $72,450 $83,550 $90,982 $98,959 $45,809 Terminal Value $0 $0 $0 $0 $0 $710,399 FCF+Terminal Value $36,648 $40,708 $72,450 $83,550 $90,982 $809,358 Enterprise Value $669,705 NWC Balance $3,662 $4,297 $4,885 $5,522 $57,426 NPPE (CAPEX-Dep. Per year) -$87,900 -$87,900 -$87,900 -$87,900 -$84,384 NOPAT/Sale -0.08 -0.02 0.02 0.06 Sale/NPPE -1.67 -1.88 -2.08 -2.28 Multiples Enterprise Value / BCF 11.3 Enterprise Value / EBITDA 12.1 Enterprise Value / After-Tax Cash Flow 18.3
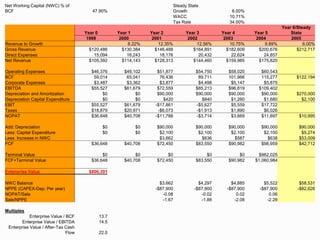
- 12. Net Working Capital (NWC) % of BCF 47.90% Steady State Growth 6.00% WACC 10.71% Tax Rate 34.00% Year 0 Year 1 Year 2 Year 3 Year 4 Year 5 Year 6/Steady State 1999 2000 2001 2002 2003 2004 2005 Revenue to Growth 8.22% 12.35% 12.56% 10.75% 9.89% 6.00% Gross Revenue $120,486 $130,384 $146,488 $164,891 $182,609 $200,676 $212,717 Direct Expenses 15,094 16,243 18,176 20,432 22,624 24,857 Net Revenue $105,392 $114,143 $128,313 $144,460 $159,985 $175,820 Operating Expenses $46,376 $49,102 $51,877 $54,750 $58,020 $60,543 BCF 59,014 65,041 76,436 89,711 101,966 115,277 $122,194 Corporate Expenses $3,487 $3,362 $3,877 $4,498 $5,147 $5,875 EBITDA $55,527 $61,679 $72,559 $85,213 $96,819 $109,402 Depreciation and Amortization $0 $0 $90,000 $90,000 $90,000 $90,000 $270,000 Depreciation Capital Expenditure $0 $0 $420 $840 $1,260 $1,680 $2,100 EBIT $55,527 $61,679 -$17,861 -$5,627 $5,559 $17,722 Taxes $18,879 $20,971 -$6,073 -$1,913 $1,890 $6,026 NOPAT $36,648 $40,708 -$11,788 -$3,714 $3,669 $11,697 $10,995 Add: Depreciation $0 $0 $90,000 $90,000 $90,000 $90,000 $90,000 Less: Capital Expenditure $0 $0 $2,100 $2,100 $2,100 $2,100 $5,274 Less: Increase in NWC $3,662 $636 $587 $638 $53,009 FCF $36,648 $40,708 $72,450 $83,550 $90,982 $98,959 $42,712 Terminal Value $0 $0 $0 $0 $0 $962,025 FCF+Terminal Value $36,648 $40,708 $72,450 $83,550 $90,982 $1,060,984 Enterprise Value $806,391 NWC Balance $3,662 $4,297 $4,885 $5,522 $58,531 NPPE (CAPEX-Dep. Per year) -$87,900 -$87,900 -$87,900 -$87,900 -$82,626 NOPAT/Sale -0.08 -0.02 0.02 0.06 Sale/NPPE -1.67 -1.88 -2.08 -2.28 Multiples Enterprise Value / BCF 13.7 Enterprise Value / EBITDA 14.5 Enterprise Value / After-Tax Cash Flow 22.0
- 13. Net Working Capital (NWC) % of BCF 47.90% Steady State Growth 8.00% WACC 10.71% Tax Rate 34.00% Year 0 Year 1 Year 2 Year 3 Year 4 Year 5 Year 6/Steady State 1999 2000 2001 2002 2003 2004 2005 Revenue to Growth 8.22% 12.35% 12.56% 10.75% 9.89% 8.00% Gross Revenue $120,486 $130,384 $146,488 $164,891 $182,609 $200,676 $216,730 Direct Expenses 15,094 16,243 18,176 20,432 22,624 24,857 Net Revenue $105,392 $114,143 $128,313 $144,460 $159,985 $175,820 Operating Expenses $46,376 $49,102 $51,877 $54,750 $58,020 $60,543 BCF 59,014 65,041 76,436 89,711 101,966 115,277 $124,499 Corporate Expenses $3,487 $3,362 $3,877 $4,498 $5,147 $5,875 EBITDA $55,527 $61,679 $72,559 $85,213 $96,819 $109,402 Depreciation and Amortization $0 $0 $90,000 $90,000 $90,000 $90,000 $270,000 Depreciation Capital Expenditure $0 $0 $420 $840 $1,260 $1,680 $2,100 EBIT $55,527 $61,679 -$17,861 -$5,627 $5,559 $17,722 Taxes $18,879 $20,971 -$6,073 -$1,913 $1,890 $6,026 NOPAT $36,648 $40,708 -$11,788 -$3,714 $3,669 $11,697 $10,761 Add: Depreciation $0 $0 $90,000 $90,000 $90,000 $90,000 $90,000 Less: Capital Expenditure $0 $0 $2,100 $2,100 $2,100 $2,100 $7,032 Less: Increase in NWC $3,662 $636 $587 $638 $54,113 FCF $36,648 $40,708 $72,450 $83,550 $90,982 $98,959 $39,616 Terminal Value $0 $0 $0 $0 $0 $1,580,995 FCF+Terminal Value $36,648 $40,708 $72,450 $83,550 $90,982 $1,679,954 Enterprise Value $1,142,621 NWC Balance $3,662 $4,297 $4,885 $5,522 $59,635 NPPE (CAPEX-Dep. Per year) -$87,900 -$87,900 -$87,900 -$87,900 -$80,868 NOPAT/Sale -0.08 -0.02 0.02 0.06 Sale/NPPE -1.67 -1.88 -2.08 -2.28 Multiples Enterprise Value / BCF 19.4 Enterprise Value / EBITDA 20.6 Enterprise Value / After-Tax Cash Flow 31.2
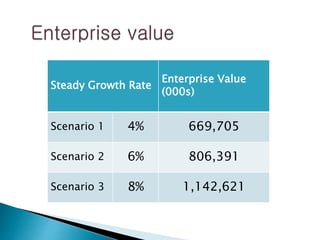
- 14. Steady Growth Rate Enterprise Value (000s) Scenario 1 4% 669,705 Scenario 2 6% 806,391 Scenario 3 8% 1,142,621
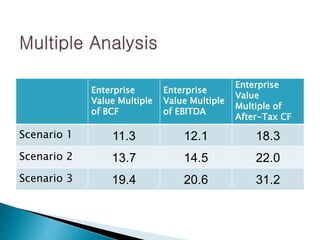
- 15. Enterprise Value Multiple of BCF Enterprise Value Multiple of EBITDA Enterprise Value Multiple of After-Tax CF Scenario 1 11.3 12.1 18.3 Scenario 2 13.7 14.5 22.0 Scenario 3 19.4 20.6 31.2
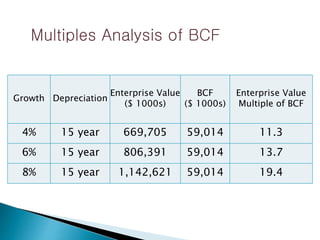
- 17. Growth Depreciation Enterprise Value ($ 1000s) BCF ($ 1000s) Enterprise Value Multiple of BCF 4% 15 year 669,705 59,014 11.3 6% 15 year 806,391 59,014 13.7 8% 15 year 1,142,621 59,014 19.4 Multiples Analysis of BCF
- 18. ´ü¢ Too many factors make it very difficult to assess an Acquisition proposal accurately ´ü¢ The Cost of Capital for the targeted stations is an assumption that could be changed ´ü¢ Expenses such as corporate expense and net working capital are based on assumptions that the targeted radio stations will have ratios similar to Radio One
- 19. ´ü¢ As revealed by the risk analysis, some of the stations may be overvalued ´ü¢ Radio One should acquire all 21 stations and we recommend an offer not greater than 21 x BCF ´ü¢ The management should capitalize on their high stock price when structuring the acquisition of the 21 targeted radio stations