際際滷

際際滷Share a Scribd company logo
+


    Simulation Analysis
    New Product Development
    Team 5
    July 30, 2012
+ Agenda   Market Conditions
           Initial Objectives and Strategy
           Changes
           Competition
           Firms Success in The Industry
           Indicative Variables Forecast
           Price vs. Sales Force Cost vs. Profits Forecast
           Advertising campaign
           Indicative Variables
           Decision Analysis
           Learning Takeaways
+
    Market Conditions

                           Low market barriers

                           High customer readiness

                           Long product life cycle

                           Low switching costs
+
    Initial Objectives

       Maximum Profits in the
        middle segment

       Market share within top
        three firms

       Moderate competitive pricing

       Achieve breakeven by the
        4th period of the game

       Achieve cumulative
        breakeven by the 6th period
        of the game
+
    Initial Strategy


                         Purchase of
                                         Entry price of $0.45 in
     Test marketing        market
                                                Period 2
                          research


      Advertising to       $90K in
                                         Target middle market
          create           channel
                                          segment with a first
     awareness and      promotions for
                                           mover advantage
      stimulate trial      period 2
+
    Changes

       Price adjustment by a maximum limit
        of $0.4
       Continuously monitor the performance
        of our competitors
       Calculation of next periods sales
        forecast using indicative variables to
        determine production quantity
       Re-allocation of advertising budget to
        increase initial sales and consumption
        rate.
+
    Competition

       Larger firms have lesser risk taking capability.
             Firm 2 switched from segment 1 to 3 in the 3rd period.
             Firm 6 switched from segment 1 to segment 2 in the 3rd period.

       Firms when in their nascent formation stage are willing to take
        greater risk and this have a greater chance of success.

       Large firms are not willing to take risks since
             If they fail in the strategy they have a lot to lose.
                  Profit
                  Market share
                  Shareholders
+
    Firms success in the industry


        Company 2                Company 4                Company 6
     Entered the third     Initial strategy: wait    Medium size
      segment creating a  Competitive                  segment
      competitive            advantage with            Effective
      advantage              market and                 combination of
     Small market, the      competitors                price, advertising
      volume of unit sales   information                and production
      achieved at the end  Best results in its         strategies
      of period 7 was not    segment with the          Leader in the
      enough to generate     highest market             segment
      cumulative profits     share and
                             cumulative profits
+
    Indicative variables forecast

    1.2
     1
    0.8
                                    Availability
    0.6
                                    Initial Purchase
    0.4                             Repurchase rate
    0.2
     0
          Q1 Q2 Q3 Q4 Q5 Q6 Q7 Q8
                                     20

                                     15

                                     10                             Consumption
                                                                    rate
                                      5

                                      0
                                          Q1 Q2 Q3 Q4 Q5 Q6 Q7 Q8
+
    Price vs. Sales Forecast


                                                                     Sales (units)
               Price (in $)                                             Sales (units)

                    Pr ice (in $)
                                                                                                6,738
      0.58
             0.45                                                                                     4,352
                    0.41
                       0.37                                                                   3,448
                              0.33 0.29
                                       0.25                                           2,770
                                          0.21
                                                                              1,900
                                                                      1,100

                                                      2        189
    Q1 Q2 Q3 Q4 Q5 Q6 Q7 Q8                      Q1       Q2     Q3     Q4      Q5      Q6      Q7      Q8
+
    Sales vs. Profits Forecast
                                 Sales vs Profits
                                 Sales (in $ 000)    Profits (in $ 000)

                                                                                                  1415

                                                                                     1088
                                                                     1000
                                                     914
                                    703
                         451                                                                             367
                                                            212                210          246
                 85
       1

       Q1        Q2       Q3           Q4              Q5                 Q6          Q7           Q8
           -49    -340     -96         -15


    Initial Investment: $2,171,000                  Profits: $535,000                       ROI: 25%
+
    Advertising Campaign
+
    Advertising Campaign
+
    Indicative Variables

       Variables are different in the      After selecting a sample size
        data and analysis they               we can analyze their buying
        provide to a company but             habits and determine the
        have the same approach in
                                             important variables to
        determining their value.
                                             identify stand in the market.


                                            Future of the market
                                             competition also can
                                             assessed by doing this.
+
    Decision Analysis

    Viable to observe the market and analyze
    the results

       Increase the accuracy of forecasting for
       the launch of product on the full scale

           Scope for refinement of the product prior
           to full scale launch

               Greater chances of success meeting
               companys objectives

                  Reduce the investment risk
+
    Learning Takeaways - Simulation


     Have knowledge            The initial strategy       Communicating           Data analysis is not
         about the              will have a huge         clearly under time        only related to the
    market, customers        impact on the future      pressure is the basis     past and presence.
      needs and the            of the product, the           for a good             Its all about the
    product prior to the        company and its             cooperation.                  future.
     decision making              departments.
        processes.


                     Document the          Simulation reflected          Constructive
                    decision making         the work of many of          feedback is
                      process in a           us in the past and         motivating and
                  clear, cohesive and        has shown others           enlightening.
                 understandable way.       what their work might
                                                  look like.
+
    Learning Takeaways - Lectures

      Correctly assessing key factors

      Situation analysis
       Internal analysis
       External analysis
       Goals

      Developing marketing strategies

      Market expansion strategies

      How to utilize an information system?
+
    Q&A

More Related Content

Final Presentation Yogo

  • 1. + Simulation Analysis New Product Development Team 5 July 30, 2012
  • 2. + Agenda Market Conditions Initial Objectives and Strategy Changes Competition Firms Success in The Industry Indicative Variables Forecast Price vs. Sales Force Cost vs. Profits Forecast Advertising campaign Indicative Variables Decision Analysis Learning Takeaways
  • 3. + Market Conditions Low market barriers High customer readiness Long product life cycle Low switching costs
  • 4. + Initial Objectives Maximum Profits in the middle segment Market share within top three firms Moderate competitive pricing Achieve breakeven by the 4th period of the game Achieve cumulative breakeven by the 6th period of the game
  • 5. + Initial Strategy Purchase of Entry price of $0.45 in Test marketing market Period 2 research Advertising to $90K in Target middle market create channel segment with a first awareness and promotions for mover advantage stimulate trial period 2
  • 6. + Changes Price adjustment by a maximum limit of $0.4 Continuously monitor the performance of our competitors Calculation of next periods sales forecast using indicative variables to determine production quantity Re-allocation of advertising budget to increase initial sales and consumption rate.
  • 7. + Competition Larger firms have lesser risk taking capability. Firm 2 switched from segment 1 to 3 in the 3rd period. Firm 6 switched from segment 1 to segment 2 in the 3rd period. Firms when in their nascent formation stage are willing to take greater risk and this have a greater chance of success. Large firms are not willing to take risks since If they fail in the strategy they have a lot to lose. Profit Market share Shareholders
  • 8. + Firms success in the industry Company 2 Company 4 Company 6 Entered the third Initial strategy: wait Medium size segment creating a Competitive segment competitive advantage with Effective advantage market and combination of Small market, the competitors price, advertising volume of unit sales information and production achieved at the end Best results in its strategies of period 7 was not segment with the Leader in the enough to generate highest market segment cumulative profits share and cumulative profits
  • 9. + Indicative variables forecast 1.2 1 0.8 Availability 0.6 Initial Purchase 0.4 Repurchase rate 0.2 0 Q1 Q2 Q3 Q4 Q5 Q6 Q7 Q8 20 15 10 Consumption rate 5 0 Q1 Q2 Q3 Q4 Q5 Q6 Q7 Q8
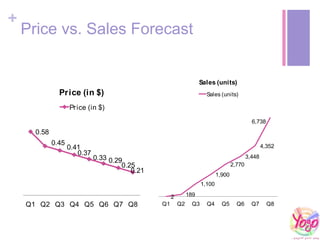
  • 10. + Price vs. Sales Forecast Sales (units) Price (in $) Sales (units) Pr ice (in $) 6,738 0.58 0.45 4,352 0.41 0.37 3,448 0.33 0.29 0.25 2,770 0.21 1,900 1,100 2 189 Q1 Q2 Q3 Q4 Q5 Q6 Q7 Q8 Q1 Q2 Q3 Q4 Q5 Q6 Q7 Q8
  • 11. + Sales vs. Profits Forecast Sales vs Profits Sales (in $ 000) Profits (in $ 000) 1415 1088 1000 914 703 451 367 212 210 246 85 1 Q1 Q2 Q3 Q4 Q5 Q6 Q7 Q8 -49 -340 -96 -15 Initial Investment: $2,171,000 Profits: $535,000 ROI: 25%
  • 12. + Advertising Campaign
  • 13. + Advertising Campaign
  • 14. + Indicative Variables Variables are different in the After selecting a sample size data and analysis they we can analyze their buying provide to a company but habits and determine the have the same approach in important variables to determining their value. identify stand in the market. Future of the market competition also can assessed by doing this.
  • 15. + Decision Analysis Viable to observe the market and analyze the results Increase the accuracy of forecasting for the launch of product on the full scale Scope for refinement of the product prior to full scale launch Greater chances of success meeting companys objectives Reduce the investment risk
  • 16. + Learning Takeaways - Simulation Have knowledge The initial strategy Communicating Data analysis is not about the will have a huge clearly under time only related to the market, customers impact on the future pressure is the basis past and presence. needs and the of the product, the for a good Its all about the product prior to the company and its cooperation. future. decision making departments. processes. Document the Simulation reflected Constructive decision making the work of many of feedback is process in a us in the past and motivating and clear, cohesive and has shown others enlightening. understandable way. what their work might look like.
  • 17. + Learning Takeaways - Lectures Correctly assessing key factors Situation analysis Internal analysis External analysis Goals Developing marketing strategies Market expansion strategies How to utilize an information system?
  • 18. + Q&A