finalPPT
0 likes240 views

The document describes a data breach information visualization system created by Mayank Sardana, Pavitraa Parthasarathy, Prashanth Kumar, and Siddharth Coontoor. The system aims to visualize data about data breaches to investigate what information was compromised, how industries were breached, and when breaches occurred. It includes interactive visualizations of data sensitivity levels, industries affected, and breach timeline. User studies found the system helps reveal patterns and tells the story of data breaches through interaction.

finalPPT
- 1. DATA BREACH INFORMATION VISUALIZATION SYSTEM INTRODUCTION: A DATA BREACH is an incident in which sensitive, protected or confidential data has potentially been viewed, stolen or used by an individual unauthorized to do so. The potential impact that data leakage can have on any organization, can be wide reaching and POTENTIALLY CATASTROPHIC. cyber security is still in its nascent stages where there are no best practices established and research is STILL ONGOING. Mayank Sardana, Pavitraa Parthasarathy, Prashanth Kumar, Siddharth Coontoor
- 2. MOTIVATION : The objective of this project is to expose information about Data Breaches in Visualization to investigate What, Why and When of a Data Breach. The Visual Storytelling follows the following approach : We built a comprehensive comparison model that can guide the users to discover interesting patterns. What they all have in common is they usually contain Personal Identifying Information (PII) in a format easily read by thieves, in other words, not encrypted. ADDIONTAL FEATURE : We also provide a safety check feature that allows users to check if their details have been compromised in any recent data breaches. ? WHAT HAPPENED IN THE DATA BREACH? ? HOW THE INDUSTRIES WERE BREACHED? ? WHEN THE DATA BREACH HAPPENED? Mayank Sardana, Pavitraa Parthasarathy, Prashanth Kumar, Siddharth Coontoor
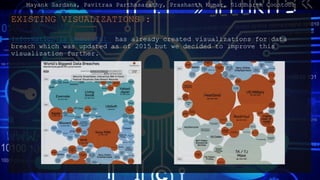
- 3. EXISTING VISUALIZATIONS : Information is beautiful has already created visualizations for data breach which was updated as of 2015 but we decided to improve this visualization further. Mayank Sardana, Pavitraa Parthasarathy, Prashanth Kumar, Siddharth Coontoor
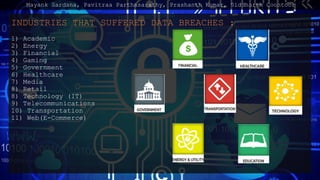
- 4. INDUSTRIES THAT SUFFERED DATA BREACHES : 1) Academic 2) Energy 3) Financial 4) Gaming 5) Government 6) Healthcare 7) Media 8) Retail 8) Technology (IT) 9) Telecommunications 10) Transportation 11) Web(E-Commerce) Mayank Sardana, Pavitraa Parthasarathy, Prashanth Kumar, Siddharth Coontoor
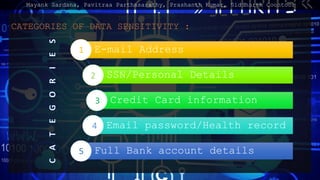
- 5. CATEGORIES OF DATA SENSITIVITY : Mayank Sardana, Pavitraa Parthasarathy, Prashanth Kumar, Siddharth Coontoor E-mail Address SSN/Personal Details Credit Card information Email password/Health record Full Bank account details 1 2 3 4 5
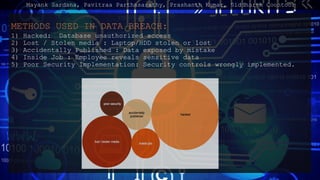
- 6. METHODS USED IN DATA BREACH: 1) Hacked: Database unauthorized access 2) Lost / Stolen media : Laptop/HDD stolen or lost 3) Accidentally Published : Data exposed by mistake 4) Inside Job : Employee reveals sensitive data 5) Poor Security Implementation: Security controls wrongly implemented. Mayank Sardana, Pavitraa Parthasarathy, Prashanth Kumar, Siddharth Coontoor
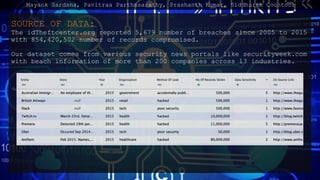
- 7. SOURCE OF DATA: The idTheftcenter.org reported 5,679 number of breaches since 2005 to 2015 with 854,420,502 number of records compromised. Our dataset comes from various security news portals like securityweek.com with beach information of more than 200 companies across 13 industries. Mayank Sardana, Pavitraa Parthasarathy, Prashanth Kumar, Siddharth Coontoor
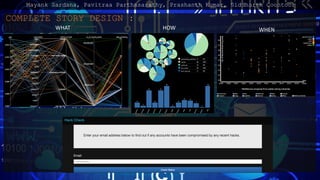
- 8. COMPLETE STORY DESIGN : WHAT HOW WHEN Mayank Sardana, Pavitraa Parthasarathy, Prashanth Kumar, Siddharth Coontoor
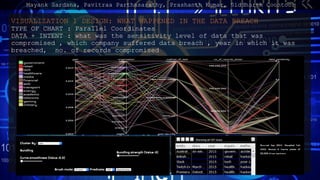
- 9. VISUALIZATION 1 DESIGN: WHAT HAPPENED IN THE DATA BREACH TYPE OF CHART : Parallel Coordinates DATA + INTENT : what was the sensitivity level of data that was compromised , which company suffered data breach , year in which it was breached, no. of records compromised Mayank Sardana, Pavitraa Parthasarathy, Prashanth Kumar, Siddharth Coontoor
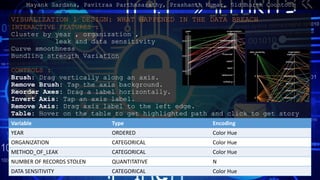
- 10. VISUALIZATION 1 DESIGN: WHAT HAPPENED IN THE DATA BREACH INTERACTIVE FEATURES : Cluster by year , organization , leak and data sensitivity Curve smoothness Bundling strength Variation CONTROLS : Brush: Drag vertically along an axis. Remove Brush: Tap the axis background. Reorder Axes: Drag a label horizontally. Invert Axis: Tap an axis label. Remove Axis: Drag axis label to the left edge. Table: Hover on the table to get highlighted path and click to get story Variable Type Encoding YEAR ORDERED Color Hue ORGANIZATION CATEGORICAL Color Hue METHOD_OF_LEAK CATEGORICAL Color Hue NUMBER OF RECORDS STOLEN QUANTITATIVE N DATA SENSITIVITY CATEGORICAL Color Hue Mayank Sardana, Pavitraa Parthasarathy, Prashanth Kumar, Siddharth Coontoor
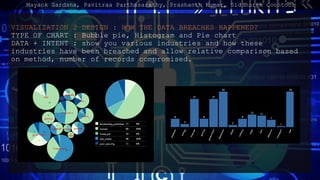
- 11. VISUALIZATION 2 DESIGN : HOW THE DATA BREACHES HAPPENED? TYPE OF CHART : Bubble pie, Histogram and Pie chart DATA + INTENT : show you various industries and how these industries have been breached and allow relative comparison based on method, number of records compromised. Mayank Sardana, Pavitraa Parthasarathy, Prashanth Kumar, Siddharth Coontoor
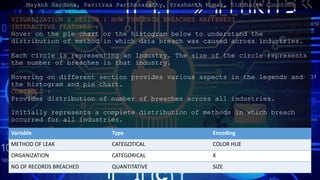
- 12. VISUALIZATION 2 DESIGN : HOW THE DATA BREACHES HAPPENED? INTERACTIVE FEATURES : Hover on the pie chart or the histogram below to understand the distribution of method in which data breach was caused across industries. Each circle is representing an Industry. The size of the circle represents the number of breaches in that industry. Hovering on different section provides various aspects in the legends and the histogram and pie chart. CONTROLS : Provides distribution of number of breaches across all industries. Initially represents a complete distribution of methods in which breach occurred for all industries. Variable Type Encoding METHOD OF LEAK CATEGOTICAL COLOR HUE ORGANIZATION CATEGORICAL X NO OF RECORDS BREACHED QUANTITATIVE SIZE Mayank Sardana, Pavitraa Parthasarathy, Prashanth Kumar, Siddharth Coontoor
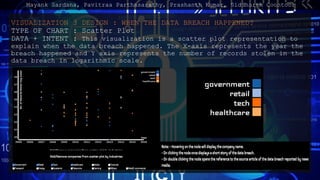
- 13. VISUALIZATION 3 DESIGN : WHEN THE DATA BREACH HAPPENED? TYPE OF CHART : Scatter Plot DATA + INTENT : This visualization is a scatter plot representation to explain when the data breach happened. The X-axis represents the year the breach happened and Y axis represents the number of records stolen in the data breach in logarithmic scale. Mayank Sardana, Pavitraa Parthasarathy, Prashanth Kumar, Siddharth Coontoor
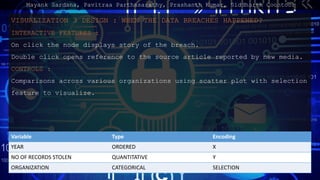
- 14. VISUALIZATION 3 DESIGN : WHEN THE DATA BREACHES HAPPENED? INTERACTIVE FEATURES : On click the node displays story of the breach. Double click opens reference to the source article reported by new media. CONTROLS : Comparisons across various organizations using scatter plot with selection feature to visualize. Variable Type Encoding YEAR ORDERED X NO OF RECORDS STOLEN QUANTITATIVE Y ORGANIZATION CATEGORICAL SELECTION Mayank Sardana, Pavitraa Parthasarathy, Prashanth Kumar, Siddharth Coontoor
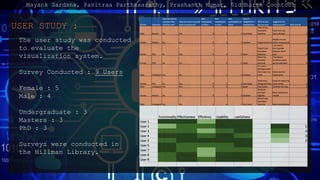
- 15. USER STUDY : The user study was conducted to evaluate the visualization system. Survey Conducted : 9 Users Female : 5 Male : 4 Undergraduate : 3 Masters : 3 PhD : 3 Surveys were conducted in the Hillman Library. Mayank Sardana, Pavitraa Parthasarathy, Prashanth Kumar, Siddharth Coontoor
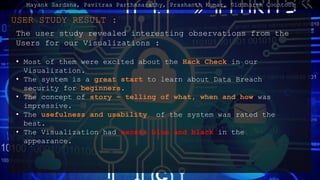
- 16. USER STUDY RESULT : The user study revealed interesting observations from the Users for our Visualizations : ? Most of them were excited about the Hack Check in our Visualization. ? The system is a great start to learn about Data Breach security for beginners. ? The concept of story ¨C telling of what, when and how was impressive. ? The usefulness and usability of the system was rated the best. ? The Visualization had excess blue and black in the appearance. Mayank Sardana, Pavitraa Parthasarathy, Prashanth Kumar, Siddharth Coontoor
- 17. ADVANTAGES OF THE VISUAL SYSTEM: ? The whole system gives a overview using different dimensions of data improving understanding. ? Using interaction for user to explore of data in detail. ? See relationship among data points to understand correlations among data points. ? See the parts to visualize different levels of data for better knowledge. Mayank Sardana, Pavitraa Parthasarathy, Prashanth Kumar, Siddharth Coontoor
- 18. CONCLUSIONS : ? Visualizations can help reveal patterns in data breaches. ? Data breach needs more research and information visualization seems to be a promising approach. ? User interaction with such visual systems can help the user immerse themselves into the story of the data breach thus being more comprehensive than news articles. ? Always be careful with your sensitive information when you register with an internet domain. Mayank Sardana, Pavitraa Parthasarathy, Prashanth Kumar, Siddharth Coontoor
- 19. APPLICATION : 1.Scale the visual system to include more companies by updating the same data file. 2. This system can be provided as a sampler for introduction to data breaches for spreading awareness about security and privacy of data. FUTURE WORK : 1. We can use better zooming abilities for charts. 2. Provide better dataset with data sensitivity levels. Mayank Sardana, Pavitraa Parthasarathy, Prashanth Kumar, Siddharth Coontoor
- 20. TECHNOLOGIES USED : We achieve our functions by using 1.D3.js 2.Javascript 3.Sweet alert 4.Bootstrap 5.CSS and HTML 6.Github 7.Interactive functions by using jQuery. Click here for Project Demo!! Questions? THANK YOU! Mayank Sardana, Pavitraa Parthasarathy, Prashanth Kumar, Siddharth Coontoor