Financial performance
Download as pptx, pdf0 likes687 views

This document analyzes and compares the financial performance of Pfizer and Novartis for 2013-2012. It includes analysis of profitability ratios like gross profit margin, operating profit margin and net profit margin. Liquidity ratios like current ratio and quick ratio are examined. Solvency is assessed using debt ratio and debt-to-equity. Efficiency is evaluated through total asset turnover, fixed asset turnover, receivables turnover and inventory turnover. Pfizer generally performed better than Novartis based on these financial metrics.


Financial performance
- 1. FINANCIAL PERFORMANCE For Pfizer & Novartis 2013-2012
- 2. AGENDA ŌĆó Intro ŌĆó Pfizer I.S & B.S ŌĆó Novartis I.S & B.S ŌĆó Profitability Analysis ŌĆó Liquidity Analysis ŌĆó Solvency Analysis ŌĆó Efficiency Analysis ŌĆó P/E Analysis
- 3. Intro
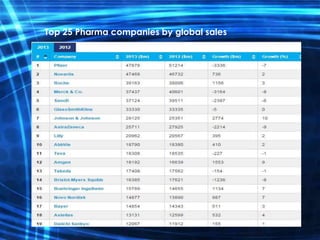
- 4. Top 25 Pharma companies by global sales
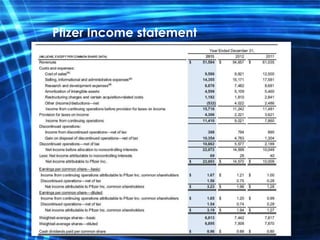
- 5. Pfizer I.S & B.S
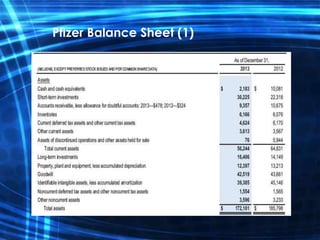
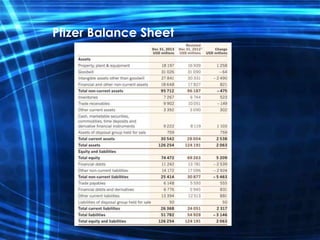
- 7. Pfizer Balance Sheet (1)
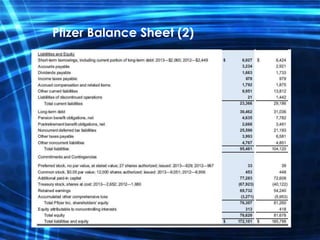
- 8. Pfizer Balance Sheet (2)
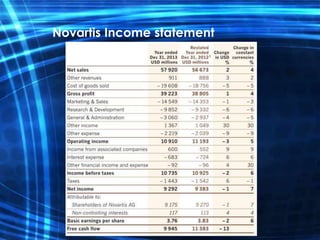
- 9. Novartis I.S & B.S
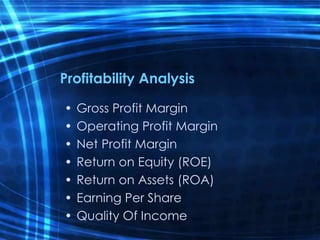
- 12. Profitability Analysis ŌĆó Gross Profit Margin ŌĆó Operating Profit Margin ŌĆó Net Profit Margin ŌĆó Return on Equity (ROE) ŌĆó Return on Assets (ROA) ŌĆó Earning Per Share ŌĆó Quality Of Income
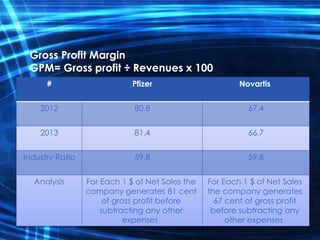
- 13. Gross Profit Margin GPM= Gross profit ├Ę Revenues x 100 NovartisPfizer# 67.480.82012 66.781.42013 59.859.8Industry Ratio For Each 1 $ of Net Sales the company generates 67 cent of gross profit before subtracting any other expenses For Each 1 $ of Net Sales the company generates 81 cent of gross profit before subtracting any other expenses Analysis
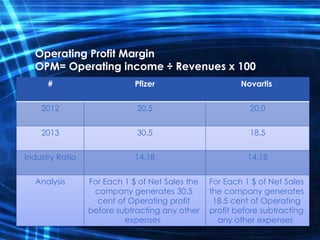
- 14. Operating Profit Margin OPM= Operating income ├Ę Revenues x 100 NovartisPfizer# 20.020.52012 18.530.52013 14.1814.18Industry Ratio For Each 1 $ of Net Sales the company generates 18.5 cent of Operating profit before subtracting any other expenses For Each 1 $ of Net Sales the company generates 30.5 cent of Operating profit before subtracting any other expenses Analysis
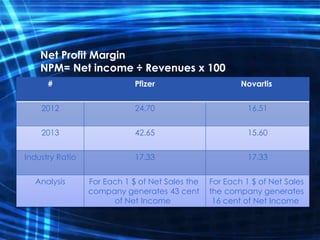
- 15. Net Profit Margin NPM= Net income ├Ę Revenues x 100 NovartisPfizer# 16.5124.702012 15.6042.652013 17.3317.33Industry Ratio For Each 1 $ of Net Sales the company generates 16 cent of Net Income For Each 1 $ of Net Sales the company generates 43 cent of Net Income Analysis
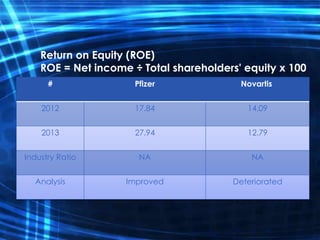
- 16. Return on Equity (ROE) ROE = Net income ├Ę Total shareholders' equity x 100 NovartisPfizer# 14.0917.842012 12.7927.942013 NANAIndustry Ratio DeterioratedImprovedAnalysis
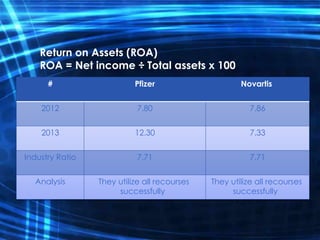
- 17. Return on Assets (ROA) ROA = Net income ├Ę Total assets x 100 NovartisPfizer# 7.867.802012 7.3312.302013 7.717.71Industry Ratio They utilize all recourses successfully They utilize all recourses successfully Analysis
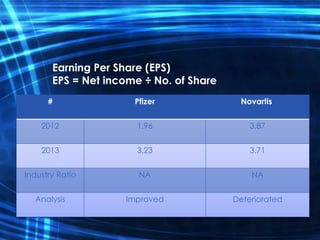
- 18. Earning Per Share (EPS) EPS = Net income ├Ę No. of Share NovartisPfizer# 3.871.962012 3.713.232013 NANAIndustry Ratio DeterioratedImprovedAnalysis
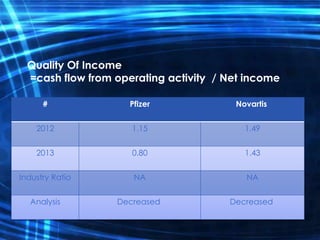
- 19. Quality Of Income =cash flow from operating activity / Net income NovartisPfizer# 1.491.152012 1.430.802013 NANAIndustry Ratio DecreasedDecreasedAnalysis
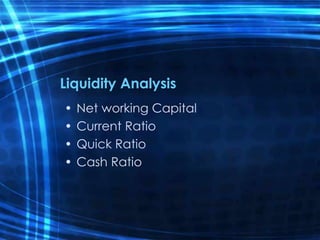
- 20. Liquidity Analysis ŌĆó Net working Capital ŌĆó Current Ratio ŌĆó Quick Ratio ŌĆó Cash Ratio
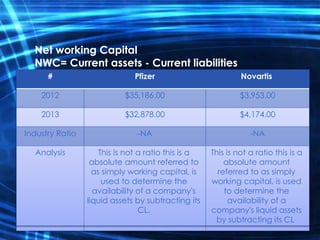
- 21. Net working Capital NWC= Current assets - Current liabilities NovartisPfizer# 1.16 : 12.2 : 12012 1.15 : 12.4 : 12013 --Industry Ratio This is not a ratio this is a absolute amount It means there are no unused assets This is not a ratio this is a absolute amount It means there are no unused assets Analysis NovartisPfizer# $3,953.00$35,186.002012 $4,174.00$32,878.002013 -NA-NAIndustry Ratio This is not a ratio this is a absolute amount referred to as simply working capital, is used to determine the availability of a company's liquid assets by subtracting its CL This is not a ratio this is a absolute amount referred to as simply working capital, is used to determine the availability of a company's liquid assets by subtracting its CL. Analysis
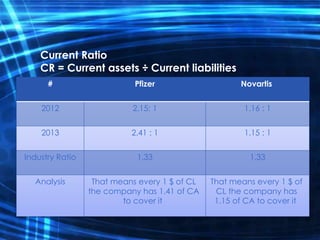
- 22. Current Ratio CR = Current assets ├Ę Current liabilities NovartisPfizer# 1.16 : 12.15: 12012 1.15 : 12.41 : 12013 1.331.33Industry Ratio That means every 1 $ of CL the company has 1.15 of CA to cover it That means every 1 $ of CL the company has 1.41 of CA to cover it Analysis
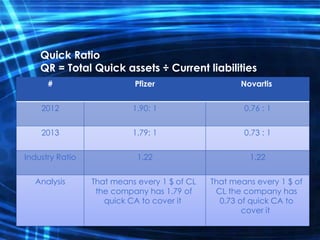
- 23. Quick Ratio QR = Total Quick assets ├Ę Current liabilities NovartisPfizer# 0.76 : 11.90: 12012 0.73 : 11.79: 12013 1.221.22Industry Ratio That means every 1 $ of CL the company has 0.73 of quick CA to cover it That means every 1 $ of CL the company has 1.79 of quick CA to cover it Analysis
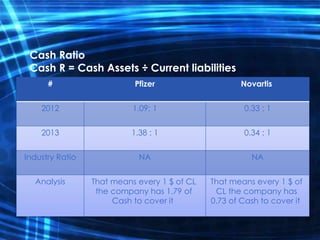
- 24. Cash Ratio Cash R = Cash Assets ├Ę Current liabilities NovartisPfizer# 0.33 : 11.09: 12012 0.34 : 11.38 : 12013 NANAIndustry Ratio That means every 1 $ of CL the company has 0.73 of Cash to cover it That means every 1 $ of CL the company has 1.79 of Cash to cover it Analysis
- 25. Solvency Analysis ŌĆó Debt Ratio ŌĆó Debt to Equity ŌĆó Equity Multiplier
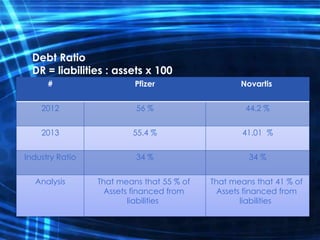
- 26. Debt Ratio DR = liabilities : assets x 100 NovartisPfizer# 44.2 %56 %2012 41.01 %55.4 %2013 34 %34 %Industry Ratio That means that 41 % of Assets financed from liabilities That means that 55 % of Assets financed from liabilities Analysis
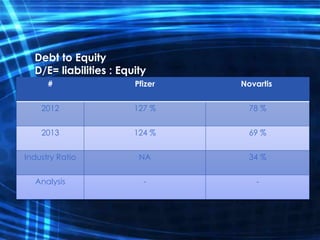
- 27. Debt to Equity D/E= liabilities : Equity NovartisPfizer# 78 %127 %2012 69 %124 %2013 34 %NAIndustry Ratio --Analysis
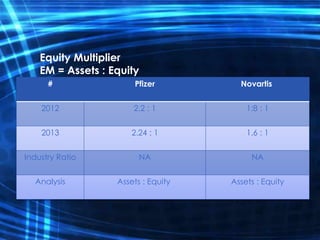
- 28. Equity Multiplier EM = Assets : Equity NovartisPfizer# 1:8 : 12.2 : 12012 1.6 : 12.24 : 12013 NANAIndustry Ratio Assets : EquityAssets : EquityAnalysis
- 29. Efficiency Analysis ŌĆó Total Asset Turnover ŌĆó Fixed Asset Turnover ŌĆó Receivables Turnover ŌĆó Average Collection Period ŌĆó Inventory Turnover ŌĆó Inventory Days On Hand
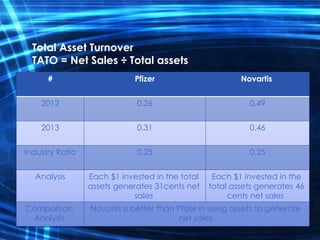
- 30. Total Asset Turnover TATO = Net Sales ├Ę Total assets NovartisPfizer# 0.490.262012 0.460.312013 0.250.25Industry Ratio Each $1 invested in the total assets generates 46 cents net sales Each $1 invested in the total assets generates 31cents net sales Analysis Novartis is better than Pfizer in using assets to generate net sales Comparison Analysis
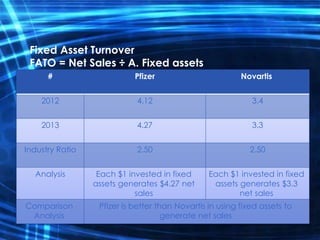
- 31. Fixed Asset Turnover FATO = Net Sales ├Ę A. Fixed assets NovartisPfizer# 3.44.122012 3.34.272013 2.502.50Industry Ratio Each $1 invested in fixed assets generates $3.3 net sales Each $1 invested in fixed assets generates $4.27 net sales Analysis Pfizer is better than Novartis in using fixed assets to generate net sales Comparison Analysis
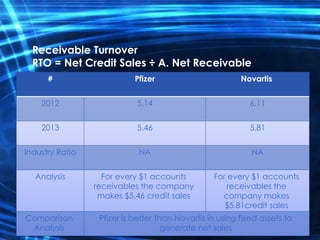
- 32. Receivable Turnover RTO = Net Credit Sales ├Ę A. Net Receivable NovartisPfizer# 6.115.142012 5.815.462013 NANAIndustry Ratio For every $1 accounts receivables the company makes $5.81credit sales For every $1 accounts receivables the company makes $5.46 credit sales Analysis Pfizer is better than Novartis in using fixed assets to generate net sales Comparison Analysis
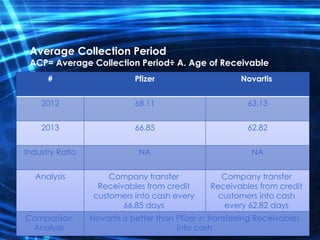
- 33. Average Collection Period ACP= Average Collection Period├Ę A. Age of Receivable NovartisPfizer# 63.1368.112012 62.8266.852013 NANAIndustry Ratio Company transfer Receivables from credit customers into cash every 62.82 days Company transfer Receivables from credit customers into cash every 66.85 days Analysis Novartis is better than Pfizer in transferring Receivables into cash Comparison Analysis
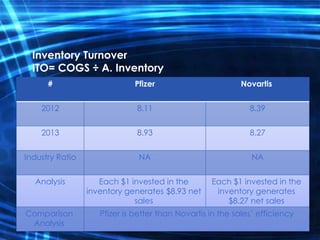
- 34. Inventory Turnover ITO= COGS ├Ę A. Inventory NovartisPfizer# 8.398.112012 8.278.932013 NANAIndustry Ratio Each $1 invested in the inventory generates $8.27 net sales Each $1 invested in the inventory generates $8.93 net sales Analysis Pfizer is better than Novartis in the salesŌĆÖ efficiencyComparison Analysis
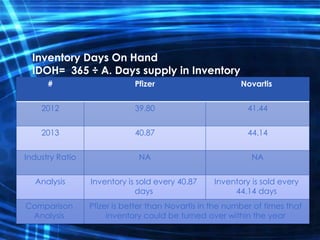
- 35. Inventory Days On Hand IDOH= 365 ├Ę A. Days supply in Inventory NovartisPfizer# 41.4439.802012 44.1440.872013 NANAIndustry Ratio Inventory is sold every 44.14 days Inventory is sold every 40.87 days Analysis Pfizer is better than Novartis in the number of times that inventory could be turned over within the year Comparison Analysis