Financial ratio analysis
Download as docx, pdf0 likes172 views

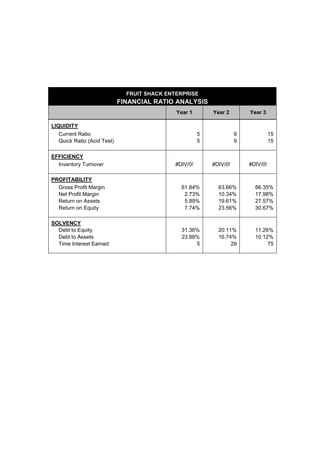
This document contains financial ratio analysis for Fruit Shack Enterprise over three years. It shows improving liquidity, efficiency, profitability, and solvency ratios from year 1 to year 3, indicating stronger financial performance over time as current ratio, inventory turnover, gross and net profit margins, returns on assets and equity, and debt ratios all increased from the first to third year.
1 of 1
Download to read offline
Ad
Recommended
Historic performance of income beneficiary remainder man trust from inception...
Historic performance of income beneficiary remainder man trust from inception...scherny
╠²
The document outlines annual performance data for a portfolio from 2004 to 2012, highlighting key metrics such as rate of return (RoR) and asset allocation percentages for cash, fixed income, and equities. It indicates fluctuating returns over the years, with a notable drop in 2008. The portfolio showcases varying compositions, reflecting market conditions and investment strategies over the specified period.Investment Performance Income Account Since Inception to 12/31/12
Investment Performance Income Account Since Inception to 12/31/12scherny
╠²
This document summarizes the annual performance of an investment portfolio from 2003 to 2012. It shows the portfolio's rate of return and asset allocation by year, with the largest allocations typically to equities, fixed income, and cash. Over the full period shown, the portfolio experienced positive cumulative returns despite a loss in 2008.N Mg Boost
N Mg BoostRuiDomingues
╠²
The document shows net margin and interest rate indicators from September 2008 to November 2009. From March 2009 onward, several actions were taken to boost net margins, including freezing internal Euribor rates, increasing spreads, and limiting applications from big players. These actions were successful, as net margins increased after March 2009 compared to before.MF category avg performance fy 2015 16
MF category avg performance fy 2015 16Gireesh Mathapati
╠²
The document provides performance metrics for various equity categories for fiscal year 2015-16, detailing one-week to five-year returns for small-cap, multi-cap, mid-cap, and large-cap investments. It also includes performance data for specific sectors such as technology, pharma, and banks, comparing returns across different timeframes. Additionally, it offers insights into debt-oriented and equity-oriented fund categories, highlighting their respective performance since inception.Q2 2015 global wholesaler peformance
Q2 2015 global wholesaler peformanceYuji Segawa
╠²
The document provides financial performance details for major pharmaceutical companies in both the global and Japanese markets for fiscal years 2014 and 2015. Key metrics such as revenue, gross profit, EBIT, and net profit are given in millions of US dollars for companies including Phoenix, Celesio, Walgreen-Alliance, AmerisourceBergen, McKesson, and Cardinal in the global market as well as Alfresa, Medipal, Suzuken, and Toho in the Japanese market. The document also lists major players in different sectors of the pharmaceutical industry including retailers, PBMs, US wholesalers, and EU wholesalers.Rentabilidade acumulada fundos imobili├Īrios setembro 2015
Rentabilidade acumulada fundos imobili├Īrios setembro 2015claudiusinhos
╠²
This document is a report listing the accumulated returns of various funds over the last 12 months. It shows returns ranging from 0.25% to 36.65% for over 50 different funds, including real estate, retail, office and healthcare property funds. The funds are listed in order of 12-month return from lowest to highest.Temporal Diversification in Real Estate Portfolios
Temporal Diversification in Real Estate PortfoliosBrad Case, PhD, CFA, CAIA
╠²
The document analyzes optimal portfolio allocations of listed REITs and private real estate funds from 1992 Q1 to 2013 Q3. It highlights that a blended portfolio can achieve higher risk-adjusted returns compared to investing in REITs or private equity real estate funds alone. Key findings include specific allocation percentages to maximize returns and minimize volatility across different portfolio strategies.Rentabilidade acumulada fundos imobili├Īrios maio 2015
Rentabilidade acumulada fundos imobili├Īrios maio 2015claudiusinhos
╠²
This document is a report listing the accumulated returns of various funds over the last 12 months. It shows the name of each fund and its corresponding return percentage ranging from 1.30% to 36.85%. There are over 100 funds listed in descending order from the highest to lowest returning fund over the past year.Missing value treatment
Missing value treatmentRahul Tiwari
╠²
The document discusses missing value treatment in data. It contains weather condition data with outlook, humidity, wind, and whether someone will play or not. It notes that missing values require treatment. It then shows statistics on records and percentage of playing cricket by humidity. Finally, it provides recommendations for treating missing values based on data type, such as removing if above 25% missing, or populating categorical data with the mode or numerical data with the mean or median.Rwsexpress Presentation
Rwsexpress Presentationabhishek choubisa
╠²
This document describes an investment plan offered by RWS Marketing Private Limited. There are two types of plans - a suite plan with a minimum investment of Rs. 10,500 that guarantees a 10% monthly return for 24 months, and a life insurance plan with Reliance Life Insurance minimum premium of Rs. 21,000. The document provides an example of returns on a Rs. 10,500 initial investment over 24 months. It also describes various income opportunities from direct referrals, binary income, and returns on investment in the insurance plan.Stat Arb Performance
Stat Arb PerformanceGDennin
╠²
The document summarizes the performance of a statistical arbitrage strategy compared to the S&P 500 index since inception on March 31, 2011. It shows that the stat arb strategy has underperformed the S&P 500 with lower annualized returns and higher volatility. Specifically, the stat arb strategy has returned -3.65% since inception compared to -3.07% for the S&P 500. It also has significantly lower risk than the overall market as measured by its beta of 0.07.WEEKLY EQUTY REPORT BY EPIC RESEARCH-23 APRIL 2012
WEEKLY EQUTY REPORT BY EPIC RESEARCH-23 APRIL 2012Epic Research Limited
╠²
The weekly equity report highlights significant developments in the Indian market, including a 50 basis point cut in the repo rate by the RBI and an inflation rate of 6.89% in March. Despite some optimism about a potential policy boost, the market remains volatile amid a challenging external environment and uncertainty regarding reforms until after the next elections. Key stock movements include gains from Tata Motors and Coal India, while BHEL and IDFC experienced losses.Stat Arb Performance
Stat Arb PerformanceGDennin
╠²
The statistical arbitrage fund has underperformed the S&P 500 index since inception in March 2011. It has lower annualized returns, lower monthly returns currently, and a larger maximum drawdown than the S&P 500. However, it also has significantly lower risk measures like volatility, beta, and correlation to the stock market. The statistical arbitrage strategy experienced its best days on different dates than large down days in the stock market, indicating it may provide diversification during market downturns.Stat Arb Performance
Stat Arb PerformanceGDennin
╠²
This document summarizes the performance of a statistical arbitrage strategy compared to the S&P 500 index since inception on March 31, 2011. The statistical arbitrage strategy has underperformed the S&P 500 on a cumulative and annualized return basis, but has significantly lower volatility, beta, and maximum drawdown. It has experienced negative returns on the S&P 500's best up days and positive returns on some of the S&P 500's worst down days, demonstrating an ability to achieve alpha in volatile markets.Stat Arb Performance
Stat Arb PerformanceGDennin
╠²
The statistical arbitrage strategy has underperformed the S&P 500 since inception in March 2011, with lower annualized returns and higher volatility. However, it has experienced smaller drawdowns than the market and has a near-zero correlation and beta to the S&P 500, demonstrating its ability to act as a hedge against general market moves.Stat Arb Performance
Stat Arb PerformanceGDennin
╠²
This document summarizes the performance of a statistical arbitrage strategy compared to the S&P 500 index since inception on March 31, 2011. It shows that the stat arb strategy has lower overall returns, volatility, maximum drawdown and beta than the S&P 500 over this period. Specifically, the stat arb strategy has returned -2.79% since inception compared to -5.48% for the S&P 500. It also has an annualized alpha of -3.98% compared to the S&P 500.Stat Arb Performance
Stat Arb PerformanceGDennin
╠²
This document summarizes the performance of a statistical arbitrage strategy compared to the S&P 500 index since inception on March 31, 2011. The statistical arbitrage strategy has underperformed the S&P 500 with lower annualized returns and lower risk as measured by volatility, beta, and maximum drawdown. On its best days, the strategy failed to outperform the market's gains, but on the market's worst days, the strategy either gained or had smaller losses than the S&P 500.Artifex folio model updates roe model
Artifex folio model updates roe modelDoug Kinsey, CFP, AIFA, CIMA
╠²
The document provides an update on the Artifex Folio Model, which is based on selecting companies with high Return on Equity (ROE) ratios. It lists the parameters for inclusion in the model as an ROE over 10%, price-to-sales ratio under 1, and a research ranking of 1 or an average broker rating of "hold" or better. The update provides statistics on the model holdings compared to the S&P 500, top holdings in the model portfolio, changes made to the portfolio including purchases and sales, and the rationale for those changes.More money at retirement by Steven Nathan
More money at retirement by Steven Nathan10X Investments
╠²
The document emphasizes strategies for increasing retirement savings, focusing on optimal investment portfolios that maximize risk-adjusted returns while addressing knowledge, behavior, and industry practice gaps. It highlights the importance of minimizing fees during investment and utilizing life-stage portfolios for better long-term outcomes. The piece also reviews historical investment returns and behavioral biases that affect investor decision-making.5640330202 ÓĖüÓĖźÓĖĖÓ╣łÓĖĪ 2
5640330202 ÓĖüÓĖźÓĖĖÓ╣łÓĖĪ 2Nanmanat Rujirawanit
╠²
The document presents statistical data on the distribution of different occupations across various industry sectors. It shows that the education sector has the highest percentage of people working as teachers at 23.5%, while the health sector employs the most health professionals at 15%. The public administration sector employs the most managers at 15% and the highest number of clerical support workers at 12%.Stat Arb Performance
Stat Arb PerformanceGDennin
╠²
The document summarizes the performance of a statistical arbitrage strategy compared to the S&P 500 index since inception on March 31, 2011. The statistical arbitrage strategy has underperformed the S&P 500 on a cumulative and annualized return basis but with lower volatility, beta, and maximum drawdown. It has experienced negative returns on the S&P 500's best up days but gains on some of its worst down days.Daily derivative report
Daily derivative reportMoney Classic Research
╠²
On June 18, 2015, Indian markets ended positively, with Nifty closing at 8078, up 31 points, and Sensex at 26832, up 146 points. A stock recommendation for Voltas Limited suggests buying above 342 with targets of 347 and 352, while cautioning about potential risks in equity trading. The document includes various trading statistics and highlights that the information may not be fully accurate and should be used at the investor's discretion.Stat Arb Performance
Stat Arb PerformanceGDennin
╠²
The statistical arbitrage fund reported lower returns than the S&P 500 since inception in March 2011, with annualized returns of -6.52% compared to -9.13% for the S&P 500. The fund exhibited much lower volatility than the market with an annualized volatility of 8.57% versus 26.37% for the S&P 500. While the fund lagged the sharply rising market in December, its maximum drawdown was lower than the S&P 500's at -9.39% versus -19.39%.Stat Arb Performance
Stat Arb PerformanceGDennin
╠²
The document summarizes the performance of a statistical arbitrage strategy compared to the S&P 500 index since inception on March 31, 2011. Some key points:
- The stat arb strategy has underperformed the S&P 500 since inception, with returns of -2.87% versus -8.33% for the index. It has lower annualized volatility and maximum drawdown.
- On a monthly basis the strategy is up 0.55% in October, compared to a 7.42% gain for the S&P 500.
- The strategy has experienced negative returns on its worst days but outperformed the market, while underperforming on the index's best days.[ļīĆĒĢÖļé┤ņØ╝20ļīĆņŚ░ĻĄ¼ņåī] ņ▓ŁļģäņØś ņ¦äņ¦£ Ē¢ēļ│ĄņØä ņ£äĒĢ£ ņ▓ŁļģäņĀĢņ▒ģņØä ņ░ŠņĢäņä£(ņŚ░ĻĄ¼ļ”¼ĒżĒŖĖ 2018-5)
[ļīĆĒĢÖļé┤ņØ╝20ļīĆņŚ░ĻĄ¼ņåī] ņ▓ŁļģäņØś ņ¦äņ¦£ Ē¢ēļ│ĄņØä ņ£äĒĢ£ ņ▓ŁļģäņĀĢņ▒ģņØä ņ░ŠņĢäņä£(ņŚ░ĻĄ¼ļ”¼ĒżĒŖĖ 2018-5) 20▓§▒¶▓╣▓·(ļīČ─ŪĻÖļé┤ņØ╝20ļīČ─ņŚ░ĻĄ¼ņåī)
╠²
The document presents survey results on various satisfaction levels, knowledge, and needs across different categories. It shows percentages relating to how well respondents understand certain topics, their satisfaction with services, and perceived necessity for various actions. Data reflects a range of responses, indicating varying degrees of satisfaction and engagement among participants.Daily derivative report money classic research
Daily derivative report money classic researchMoney Classic Research
╠²
On December 24, 2015, Indian markets experienced positive growth, with the Sensex rising 259 points to close at 25,850 and the Nifty increasing by 79 points to finish at 7,865. A stock recommendation for SKS Micro Finance Limited suggests selling below 494, targeting prices of 490 and 486, with a stop loss at 500. The document contains analytical market data and cautions investors about the risks involved in equity trading without guaranteeing the accuracy of the information provided.Stat Arb Performance
Stat Arb PerformanceGDennin
╠²
This document summarizes the performance of a statistical arbitrage strategy compared to the S&P 500 index since inception on March 31, 2011. The statistical arbitrage strategy has outperformed the S&P 500 with lower volatility, beta, correlation and maximum drawdown. Specifically, the statistical arbitrage strategy has returned -3.24% annually compared to -12.61% for the S&P 500.Format job application letter
Format job application letteruniversity technology mara, KK
╠²
The document outlines the standard format for a job application letter, including including contact information for the applicant and recipient, the date, a subject line stating the job being applied for, and a body that mentions the applicant's interest in and qualifications for the position, any relevant experience or skills, an attached resume, a willingness to interview, and a request for a reply. The letter should also include a complimentary close and the applicant's name and any enclosures.Job application letters & resume
Job application letters & resumeshakil2604
╠²
The document provides guidance on writing job application letters and resumes. It discusses the key components of cover letters, including the introduction, main body, and conclusion. It also outlines the important elements of a resume, such as personal information, education, work experience, activities, and references. Finally, it describes different types of resumes (chronological, functional, hybrid) and considerations for electronic resumes in ASCII and HTML formats. The overall purpose is to help job applicants effectively market their qualifications and motivate employers to grant an interview.JOb Application Writing
JOb Application WritingSadiya Naseem
╠²
The document provides examples of job application letters and resumes written by three friends - Ankita, Harry, and Jamshed - who saw suitable job openings in the newspaper. Their teacher reviewed and provided positive feedback on the applications and resumes they created for the positions of Quality Analyst, Customer Care Executive, and HR Manager respectively. She thanked the students for their good work and invited them to a lunch party the next day.More Related Content
What's hot (19)
Missing value treatment
Missing value treatmentRahul Tiwari
╠²
The document discusses missing value treatment in data. It contains weather condition data with outlook, humidity, wind, and whether someone will play or not. It notes that missing values require treatment. It then shows statistics on records and percentage of playing cricket by humidity. Finally, it provides recommendations for treating missing values based on data type, such as removing if above 25% missing, or populating categorical data with the mode or numerical data with the mean or median.Rwsexpress Presentation
Rwsexpress Presentationabhishek choubisa
╠²
This document describes an investment plan offered by RWS Marketing Private Limited. There are two types of plans - a suite plan with a minimum investment of Rs. 10,500 that guarantees a 10% monthly return for 24 months, and a life insurance plan with Reliance Life Insurance minimum premium of Rs. 21,000. The document provides an example of returns on a Rs. 10,500 initial investment over 24 months. It also describes various income opportunities from direct referrals, binary income, and returns on investment in the insurance plan.Stat Arb Performance
Stat Arb PerformanceGDennin
╠²
The document summarizes the performance of a statistical arbitrage strategy compared to the S&P 500 index since inception on March 31, 2011. It shows that the stat arb strategy has underperformed the S&P 500 with lower annualized returns and higher volatility. Specifically, the stat arb strategy has returned -3.65% since inception compared to -3.07% for the S&P 500. It also has significantly lower risk than the overall market as measured by its beta of 0.07.WEEKLY EQUTY REPORT BY EPIC RESEARCH-23 APRIL 2012
WEEKLY EQUTY REPORT BY EPIC RESEARCH-23 APRIL 2012Epic Research Limited
╠²
The weekly equity report highlights significant developments in the Indian market, including a 50 basis point cut in the repo rate by the RBI and an inflation rate of 6.89% in March. Despite some optimism about a potential policy boost, the market remains volatile amid a challenging external environment and uncertainty regarding reforms until after the next elections. Key stock movements include gains from Tata Motors and Coal India, while BHEL and IDFC experienced losses.Stat Arb Performance
Stat Arb PerformanceGDennin
╠²
The statistical arbitrage fund has underperformed the S&P 500 index since inception in March 2011. It has lower annualized returns, lower monthly returns currently, and a larger maximum drawdown than the S&P 500. However, it also has significantly lower risk measures like volatility, beta, and correlation to the stock market. The statistical arbitrage strategy experienced its best days on different dates than large down days in the stock market, indicating it may provide diversification during market downturns.Stat Arb Performance
Stat Arb PerformanceGDennin
╠²
This document summarizes the performance of a statistical arbitrage strategy compared to the S&P 500 index since inception on March 31, 2011. The statistical arbitrage strategy has underperformed the S&P 500 on a cumulative and annualized return basis, but has significantly lower volatility, beta, and maximum drawdown. It has experienced negative returns on the S&P 500's best up days and positive returns on some of the S&P 500's worst down days, demonstrating an ability to achieve alpha in volatile markets.Stat Arb Performance
Stat Arb PerformanceGDennin
╠²
The statistical arbitrage strategy has underperformed the S&P 500 since inception in March 2011, with lower annualized returns and higher volatility. However, it has experienced smaller drawdowns than the market and has a near-zero correlation and beta to the S&P 500, demonstrating its ability to act as a hedge against general market moves.Stat Arb Performance
Stat Arb PerformanceGDennin
╠²
This document summarizes the performance of a statistical arbitrage strategy compared to the S&P 500 index since inception on March 31, 2011. It shows that the stat arb strategy has lower overall returns, volatility, maximum drawdown and beta than the S&P 500 over this period. Specifically, the stat arb strategy has returned -2.79% since inception compared to -5.48% for the S&P 500. It also has an annualized alpha of -3.98% compared to the S&P 500.Stat Arb Performance
Stat Arb PerformanceGDennin
╠²
This document summarizes the performance of a statistical arbitrage strategy compared to the S&P 500 index since inception on March 31, 2011. The statistical arbitrage strategy has underperformed the S&P 500 with lower annualized returns and lower risk as measured by volatility, beta, and maximum drawdown. On its best days, the strategy failed to outperform the market's gains, but on the market's worst days, the strategy either gained or had smaller losses than the S&P 500.Artifex folio model updates roe model
Artifex folio model updates roe modelDoug Kinsey, CFP, AIFA, CIMA
╠²
The document provides an update on the Artifex Folio Model, which is based on selecting companies with high Return on Equity (ROE) ratios. It lists the parameters for inclusion in the model as an ROE over 10%, price-to-sales ratio under 1, and a research ranking of 1 or an average broker rating of "hold" or better. The update provides statistics on the model holdings compared to the S&P 500, top holdings in the model portfolio, changes made to the portfolio including purchases and sales, and the rationale for those changes.More money at retirement by Steven Nathan
More money at retirement by Steven Nathan10X Investments
╠²
The document emphasizes strategies for increasing retirement savings, focusing on optimal investment portfolios that maximize risk-adjusted returns while addressing knowledge, behavior, and industry practice gaps. It highlights the importance of minimizing fees during investment and utilizing life-stage portfolios for better long-term outcomes. The piece also reviews historical investment returns and behavioral biases that affect investor decision-making.5640330202 ÓĖüÓĖźÓĖĖÓ╣łÓĖĪ 2
5640330202 ÓĖüÓĖźÓĖĖÓ╣łÓĖĪ 2Nanmanat Rujirawanit
╠²
The document presents statistical data on the distribution of different occupations across various industry sectors. It shows that the education sector has the highest percentage of people working as teachers at 23.5%, while the health sector employs the most health professionals at 15%. The public administration sector employs the most managers at 15% and the highest number of clerical support workers at 12%.Stat Arb Performance
Stat Arb PerformanceGDennin
╠²
The document summarizes the performance of a statistical arbitrage strategy compared to the S&P 500 index since inception on March 31, 2011. The statistical arbitrage strategy has underperformed the S&P 500 on a cumulative and annualized return basis but with lower volatility, beta, and maximum drawdown. It has experienced negative returns on the S&P 500's best up days but gains on some of its worst down days.Daily derivative report
Daily derivative reportMoney Classic Research
╠²
On June 18, 2015, Indian markets ended positively, with Nifty closing at 8078, up 31 points, and Sensex at 26832, up 146 points. A stock recommendation for Voltas Limited suggests buying above 342 with targets of 347 and 352, while cautioning about potential risks in equity trading. The document includes various trading statistics and highlights that the information may not be fully accurate and should be used at the investor's discretion.Stat Arb Performance
Stat Arb PerformanceGDennin
╠²
The statistical arbitrage fund reported lower returns than the S&P 500 since inception in March 2011, with annualized returns of -6.52% compared to -9.13% for the S&P 500. The fund exhibited much lower volatility than the market with an annualized volatility of 8.57% versus 26.37% for the S&P 500. While the fund lagged the sharply rising market in December, its maximum drawdown was lower than the S&P 500's at -9.39% versus -19.39%.Stat Arb Performance
Stat Arb PerformanceGDennin
╠²
The document summarizes the performance of a statistical arbitrage strategy compared to the S&P 500 index since inception on March 31, 2011. Some key points:
- The stat arb strategy has underperformed the S&P 500 since inception, with returns of -2.87% versus -8.33% for the index. It has lower annualized volatility and maximum drawdown.
- On a monthly basis the strategy is up 0.55% in October, compared to a 7.42% gain for the S&P 500.
- The strategy has experienced negative returns on its worst days but outperformed the market, while underperforming on the index's best days.[ļīĆĒĢÖļé┤ņØ╝20ļīĆņŚ░ĻĄ¼ņåī] ņ▓ŁļģäņØś ņ¦äņ¦£ Ē¢ēļ│ĄņØä ņ£äĒĢ£ ņ▓ŁļģäņĀĢņ▒ģņØä ņ░ŠņĢäņä£(ņŚ░ĻĄ¼ļ”¼ĒżĒŖĖ 2018-5)
[ļīĆĒĢÖļé┤ņØ╝20ļīĆņŚ░ĻĄ¼ņåī] ņ▓ŁļģäņØś ņ¦äņ¦£ Ē¢ēļ│ĄņØä ņ£äĒĢ£ ņ▓ŁļģäņĀĢņ▒ģņØä ņ░ŠņĢäņä£(ņŚ░ĻĄ¼ļ”¼ĒżĒŖĖ 2018-5) 20▓§▒¶▓╣▓·(ļīČ─ŪĻÖļé┤ņØ╝20ļīČ─ņŚ░ĻĄ¼ņåī)
╠²
The document presents survey results on various satisfaction levels, knowledge, and needs across different categories. It shows percentages relating to how well respondents understand certain topics, their satisfaction with services, and perceived necessity for various actions. Data reflects a range of responses, indicating varying degrees of satisfaction and engagement among participants.Daily derivative report money classic research
Daily derivative report money classic researchMoney Classic Research
╠²
On December 24, 2015, Indian markets experienced positive growth, with the Sensex rising 259 points to close at 25,850 and the Nifty increasing by 79 points to finish at 7,865. A stock recommendation for SKS Micro Finance Limited suggests selling below 494, targeting prices of 490 and 486, with a stop loss at 500. The document contains analytical market data and cautions investors about the risks involved in equity trading without guaranteeing the accuracy of the information provided.Stat Arb Performance
Stat Arb PerformanceGDennin
╠²
This document summarizes the performance of a statistical arbitrage strategy compared to the S&P 500 index since inception on March 31, 2011. The statistical arbitrage strategy has outperformed the S&P 500 with lower volatility, beta, correlation and maximum drawdown. Specifically, the statistical arbitrage strategy has returned -3.24% annually compared to -12.61% for the S&P 500.[ļīĆĒĢÖļé┤ņØ╝20ļīĆņŚ░ĻĄ¼ņåī] ņ▓ŁļģäņØś ņ¦äņ¦£ Ē¢ēļ│ĄņØä ņ£äĒĢ£ ņ▓ŁļģäņĀĢņ▒ģņØä ņ░ŠņĢäņä£(ņŚ░ĻĄ¼ļ”¼ĒżĒŖĖ 2018-5)
[ļīĆĒĢÖļé┤ņØ╝20ļīĆņŚ░ĻĄ¼ņåī] ņ▓ŁļģäņØś ņ¦äņ¦£ Ē¢ēļ│ĄņØä ņ£äĒĢ£ ņ▓ŁļģäņĀĢņ▒ģņØä ņ░ŠņĢäņä£(ņŚ░ĻĄ¼ļ”¼ĒżĒŖĖ 2018-5) 20▓§▒¶▓╣▓·(ļīČ─ŪĻÖļé┤ņØ╝20ļīČ─ņŚ░ĻĄ¼ņåī)
╠²
Viewers also liked (6)
Format job application letter
Format job application letteruniversity technology mara, KK
╠²
The document outlines the standard format for a job application letter, including including contact information for the applicant and recipient, the date, a subject line stating the job being applied for, and a body that mentions the applicant's interest in and qualifications for the position, any relevant experience or skills, an attached resume, a willingness to interview, and a request for a reply. The letter should also include a complimentary close and the applicant's name and any enclosures.Job application letters & resume
Job application letters & resumeshakil2604
╠²
The document provides guidance on writing job application letters and resumes. It discusses the key components of cover letters, including the introduction, main body, and conclusion. It also outlines the important elements of a resume, such as personal information, education, work experience, activities, and references. Finally, it describes different types of resumes (chronological, functional, hybrid) and considerations for electronic resumes in ASCII and HTML formats. The overall purpose is to help job applicants effectively market their qualifications and motivate employers to grant an interview.JOb Application Writing
JOb Application WritingSadiya Naseem
╠²
The document provides examples of job application letters and resumes written by three friends - Ankita, Harry, and Jamshed - who saw suitable job openings in the newspaper. Their teacher reviewed and provided positive feedback on the applications and resumes they created for the positions of Quality Analyst, Customer Care Executive, and HR Manager respectively. She thanked the students for their good work and invited them to a lunch party the next day.Job applications
Job applicationskzabowski
╠²
This document provides guidance on creating job application materials, including a resume, cover letter, and application form. It outlines the key components of each document, such as personal information, education history, work experience, skills, and references. Tips are provided on writing concisely, using action verbs to describe experiences, and focusing the cover letter on matching qualifications to the job. Students are assigned to create a full application package tailored for a job at a local employer of their choice.Types of job application letter
Types of job application letterKiran Kurian Philip
╠²
This document discusses different types of job application documents, including letters, forms, cover letters, resumes, and CVs. It describes three types of job application letters: letter style, prescribed employer forms, and a covering letter with resume. It provides examples of the content and structure of cover letters, resumes in both chronological and functional styles, and CVs. The document serves as a guide for applicants on how to appropriately format and submit documents when applying for jobs.Teachers Application Letter
Teachers Application Letterlspu
╠²
Corina Garcia is applying for an open elementary teacher position at Liceo de Pakil. She recently graduated with a Bachelor's in Elementary Education from Laguna State Polytechnic University in 2009. During her studies, she participated in practice teaching programs to become an efficient and effective teacher. She requests an interview for the open position.Ad
Financial ratio analysis
- 1. FRUIT SHACK ENTERPRISE FINANCIAL RATIO ANALYSIS Year 1 Year 2 Year 3 LIQUIDITY Current Ratio Quick Ratio (Acid Test) EFFICIENCY Inventory Turnover 5 5 #DIV/0! 9 9 #DIV/0! 15 15 #DIV/0! PROFITABILITY Gross Profit Margin Net Profit Margin Return on Assets Return on Equity 61.84% 2.73% 5.89% 7.74% 63.66% 10.34% 19.61% 23.56% 66.35% 17.98% 27.57% 30.67% SOLVENCY Debt to Equity Debt to Assets Time Interest Earned 31.36% 23.88% 5 20.11% 16.74% 29 11.26% 10.12% 75