


More Related Content
Similar to Flow Chajhbhvhhhhhhhhhhhhhrts FOR BPE.pptx (20)
Recently uploaded (20)


Flow Chajhbhvhhhhhhhhhhhhhrts FOR BPE.pptx
- 1. FLOW CHARTS
- 3. ALGORITHM AND FLOW CHART ? able to define problem; ? able to define algorithm; ? write algorithms for simple problems; ? explain properties of an algorithm; ? the meaning of flowchart; ? explain the need of flow chart; ? explain different symbols used in flow chart; ? draw flow chart for simple problems; and convert a flow chart into an algorithm and vice versa. OBJECTIVES
- 4. ALGORITHM AND FLOW CHART Intelligence is one of the key characteristics which differentiate a human being from other living creatures on the earth. Basic intelligence covers day to day problem solving and making strategies to handle different situations which keep arising in day to day life. INTRODUCTION
- 5. ALGORITHM AND FLOW CHART One person goes Bank to withdraw money. After knowing the balance in his account, he/she decides to withdraw the entire amount from his account but he/she has to leave minimum balance in his account. INTRODUCTION
- 6. ALGORITHM AND FLOW CHART Here deciding about how much amount he/she may withdraw from the account is one of the example of the basic intelligence. During the process of solving any problem, one tries to find the necessary steps to be taken in a sequence. INTRODUCTION
- 7. ALGORITHM AND FLOW CHART What is Algorithm? Algorithm can be defined as: ˇ°A sequ ence of activities to be processed for getti ng desired output from a given input.ˇ±
- 8. ALGORITHM AND FLOW CHART What is Algorithm? Webopedia defines an algorithm as: ˇ°A formula or set of steps for solving a particularproblem. To be an algorithm, a set of rules must be unambiguous and have a cl ear stopping pointˇ±.
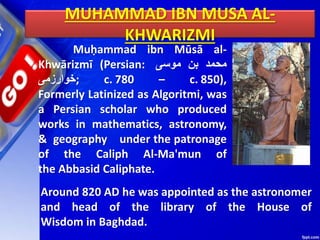
- 9. MUHAMMAD IBN MUSA AL- KHWARIZMI Mu?ammad ibn M¨±s¨ˇ al- Khw¨ˇrizm¨© (Persian: ?????? ???? ?????? ?;???????? c. 780 ¨C c. 850), Formerly Latinized as Algoritmi, was a Persian scholar who produced works in mathematics, astronomy, & geography under the patronage of the Caliph Al-Ma'mun of the Abbasid Caliphate. Around 820 AD he was appointed as the astronomer and head of the library of the House of Wisdom in Baghdad.
- 10. PROPERTIES OF ALGORITHM Donald Ervin Knuth has given a list of five properties for an algorithm, these properties are: 1) FINITENESS 2) DEFINITENESS 3) INPUT 4) OUTPUT 5) EFFECTIVENESS
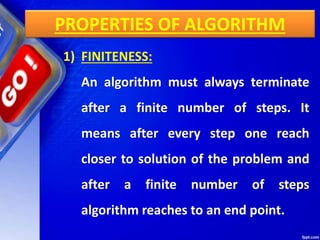
- 11. PROPERTIES OF ALGORITHM 1) FINITENESS: An algorithm must always terminate after a finite number of steps. It means after every step one reach closer to solution of the problem and after a finite number of steps algorithm reaches to an end point.
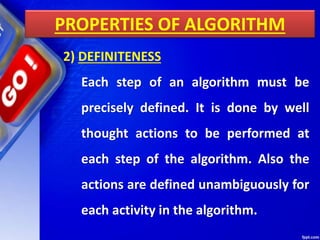
- 12. PROPERTIES OF ALGORITHM 2) DEFINITENESS Each step of an algorithm must be precisely defined. It is done by well thought actions to be performed at each step of the algorithm. Also the actions are defined unambiguously for each activity in the algorithm.
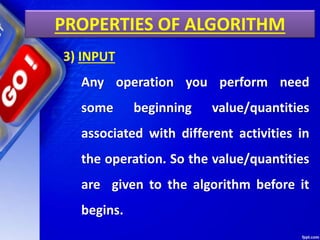
- 13. PROPERTIES OF ALGORITHM 3) INPUT Any operation you perform need some beginning value/quantities associated with different activities in the operation. So the value/quantities are given to the algorithm before it begins.
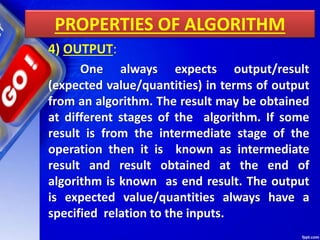
- 14. PROPERTIES OF ALGORITHM 4) OUTPUT: One always expects output/result (expected value/quantities) in terms of output from an algorithm. The result may be obtained at different stages of the algorithm. If some result is from the intermediate stage of the operation then it is known as intermediate result and result obtained at the end of algorithm is known as end result. The output is expected value/quantities always have a specified relation to the inputs.
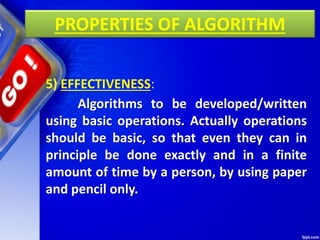
- 15. PROPERTIES OF ALGORITHM 5) EFFECTIVENESS: Algorithms to be developed/written using basic operations. Actually operations should be basic, so that even they can in principle be done exactly and in a finite amount of time by a person, by using paper and pencil only.
- 16. PROPERTIES OF ALGORITHM Any algorithm should have all these five properties otherwise it will not fulfil the basic objective of solving a problem in finite time. As you have seen in previous examples, every step of an algorithm puts you closer to the solution
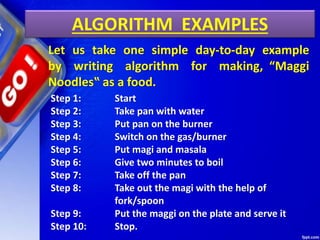
- 17. ALGORITHM EXAMPLES Let us take one simple day-to-day example by writing algorithm for making, ˇ°Maggi Noodles? as a food. Step 1: Start Step 2: Take pan with water Step 3: Put pan on the burner Step 4: Switch on the gas/burner Step 5: Put magi and masala Step 6: Give two minutes to boil Step 7: Take off the pan Step 8: Take out the magi with the help of fork/spoon Step 9: Put the maggi on the plate and serve it Step 10: Stop.
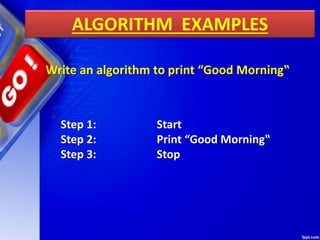
- 18. ALGORITHM EXAMPLES Write an algorithm to print ˇ°Good Morning? Step 1: Start Step 2: Print ˇ°Good Morning? Step 3: Stop
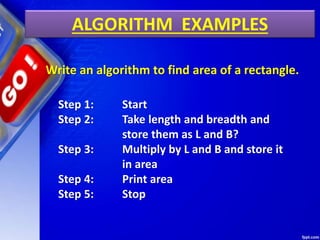
- 19. ALGORITHM EXAMPLES Write an algorithm to find area of a rectangle. Step 1: Start Step 2: Take length and breadth and store them as L and B? Step 3: Multiply by L and B and store it in area Step 4: Print area Step 5: Stop
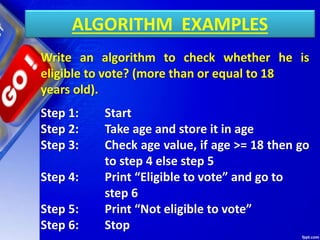
- 20. ALGORITHM EXAMPLES Write an algorithm to check whether he is eligible to vote? (more than or equal to 18 years old). Step 1: Start Step 2: Take age and store it in age Step 3: Check age value, if age >= 18 then go to step 4 else step 5 Step 4: Print ˇ°Eligible to voteˇ± and go to step 6 Step 5: Print ˇ°Not eligible to voteˇ± Step 6: Stop
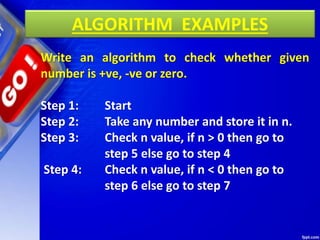
- 21. ALGORITHM EXAMPLES Write an algorithm to check whether given number is +ve, -ve or zero. Step 1: Start Step 2: Take any number and store it in n. Step 3: Check n value, if n > 0 then go to step 5 else go to step 4 Step 4: Check n value, if n < 0 then go to step 6 else go to step 7
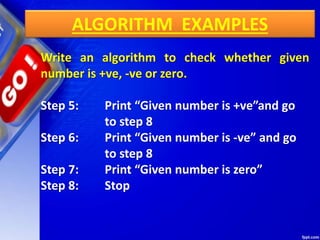
- 22. ALGORITHM EXAMPLES Write an algorithm to check whether given number is +ve, -ve or zero. Step 5: Print ˇ°Given number is +veˇ±and go to step 8 Step 6: Print ˇ°Given number is -veˇ± and go to step 8 Step 7: Print ˇ°Given number is zeroˇ± Step 8: Stop
- 23. FLOWCHART
- 24. sually presents the flow of data thr ough processing systems. This means by seeing a flo w chart one can know the operatio ns performed and the sequence of these operations i n a system. Algorithms are nothing but sequence of steps for solving problems. So a flo w chart can be used for representin g an algorithm. A flowchart, will describe the operati
- 25. A flowchart is a type of diagram that represents an algorithm, workflow or process. The flowchart shows the steps as boxes of various kinds, and their order by connecting the boxes with arrows. This diagrammatic representation illustrates a solution model to a given problem. Flowcharts are used in analyzing, designing, documenting or
- 26. BUILDING BLOCKS OF FLOW CHART OR COMMON SYMBOLS OF FLOW CHART
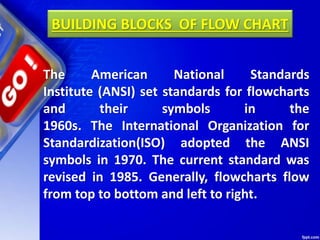
- 27. The American National Standards Institute (ANSI) set standards for flowcharts and their symbols in the 1960s. The International Organization for Standardization(ISO) adopted the ANSI symbols in 1970. The current standard was revised in 1985. Generally, flowcharts flow from top to bottom and left to right. BUILDING BLOCKS OF FLOW CHART
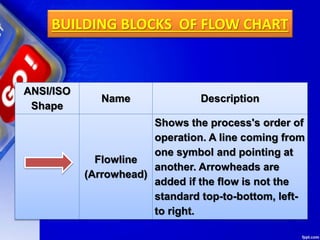
- 28. BUILDING BLOCKS OF FLOW CHART ANSI/ISO Shape Name Description Flowline (Arrowhead) Shows the process's order of operation. A line coming from one symbol and pointing at another. Arrowheads are added if the flow is not the standard top-to-bottom, left- to right.
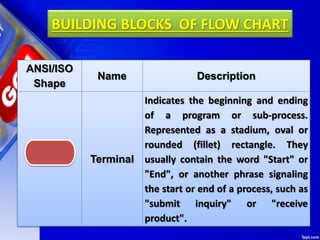
- 29. BUILDING BLOCKS OF FLOW CHART ANSI/ISO Shape Name Description Terminal Indicates the beginning and ending of a program or sub-process. Represented as a stadium, oval or rounded (fillet) rectangle. They usually contain the word "Start" or "End", or another phrase signaling the start or end of a process, such as "submit inquiry" or "receive product".
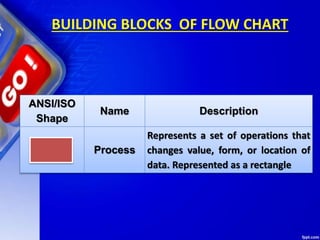
- 30. BUILDING BLOCKS OF FLOW CHART ANSI/ISO Shape Name Description Process Represents a set of operations that changes value, form, or location of data. Represented as a rectangle
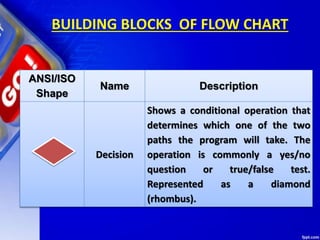
- 31. BUILDING BLOCKS OF FLOW CHART ANSI/ISO Shape Name Description Decision Shows a conditional operation that determines which one of the two paths the program will take. The operation is commonly a yes/no question or true/false test. Represented as a diamond (rhombus).
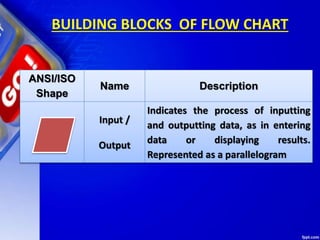
- 32. BUILDING BLOCKS OF FLOW CHART ANSI/ISO Shape Name Description Input / Output Indicates the process of inputting and outputting data, as in entering data or displaying results. Represented as a parallelogram
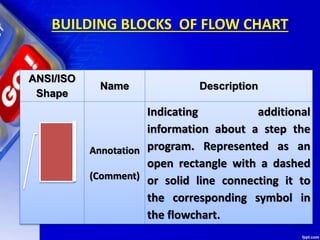
- 33. BUILDING BLOCKS OF FLOW CHART ANSI/ISO Shape Name Description Annotation (Comment) Indicating additional information about a step the program. Represented as an open rectangle with a dashed or solid line connecting it to the corresponding symbol in the flowchart.
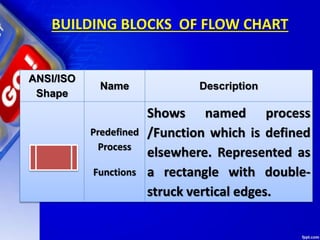
- 34. BUILDING BLOCKS OF FLOW CHART ANSI/ISO Shape Name Description Predefined Process Functions Shows named process /Function which is defined elsewhere. Represented as a rectangle with double- struck vertical edges.
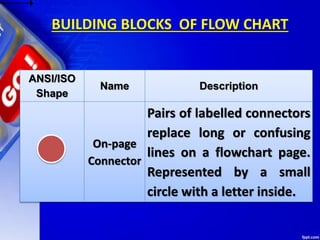
- 35. BUILDING BLOCKS OF FLOW CHART ANSI/ISO Shape Name Description On-page Connector Pairs of labelled connectors replace long or confusing lines on a flowchart page. Represented by a small circle with a letter inside.
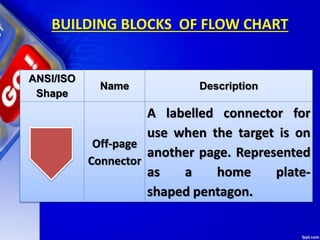
- 36. BUILDING BLOCKS OF FLOW CHART ANSI/ISO Shape Name Description Off-page Connector A labelled connector for use when the target is on another page. Represented as a home plate- shaped pentagon.
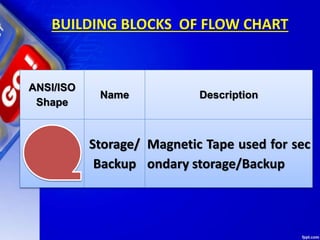
- 37. BUILDING BLOCKS OF FLOW CHART ANSI/ISO Shape Name Description Storage/ Backup Magnetic Tape used for sec ondary storage/Backup
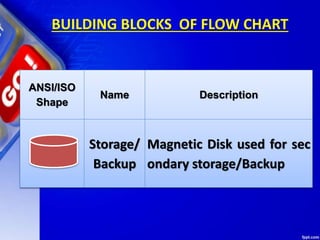
- 38. BUILDING BLOCKS OF FLOW CHART ANSI/ISO Shape Name Description Storage/ Backup Magnetic Disk used for sec ondary storage/Backup
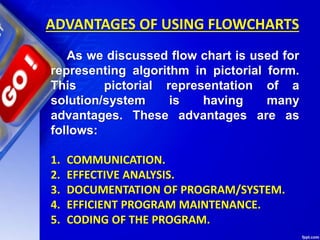
- 39. ADVANTAGES OF USING FLOWCHARTS As we discussed flow chart is used for representing algorithm in pictorial form. This pictorial representation of a solution/system is having many advantages. These advantages are as follows: 1. COMMUNICATION. 2. EFFECTIVE ANALYSIS. 3. DOCUMENTATION OF PROGRAM/SYSTEM. 4. EFFICIENT PROGRAM MAINTENANCE. 5. CODING OF THE PROGRAM.
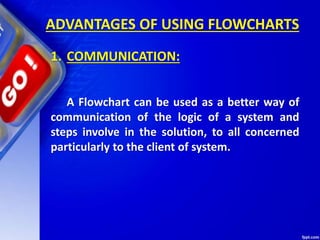
- 40. ADVANTAGES OF USING FLOWCHARTS 1. COMMUNICATION: A Flowchart can be used as a better way of communication of the logic of a system and steps involve in the solution, to all concerned particularly to the client of system.
- 41. ADVANTAGES OF USING FLOWCHARTS 2. EFFECTIVE ANALYSIS: A flowchart of a problem can be used for effective analysis of the problem.
- 42. ADVANTAGES OF USING FLOWCHARTS 3.DOCUMENTATION OF PROGRAM/ SYSTEM: Program flowcharts are a vital part of a good program documentation. Program document is used for various purposes like knowing the components in the program, complexity of the program etc.
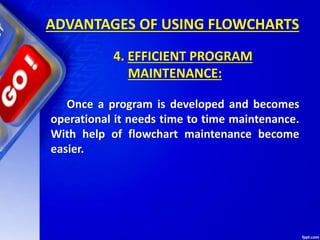
- 43. ADVANTAGES OF USING FLOWCHARTS 4. EFFICIENT PROGRAM MAINTENANCE: Once a program is developed and becomes operational it needs time to time maintenance. With help of flowchart maintenance become easier.
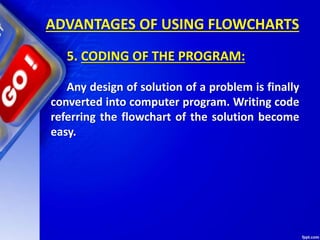
- 44. ADVANTAGES OF USING FLOWCHARTS 5. CODING OF THE PROGRAM: Any design of solution of a problem is finally converted into computer program. Writing code referring the flowchart of the solution become easy.
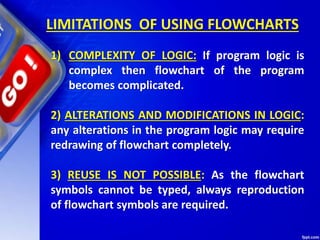
- 45. LIMITATIONS OF USING FLOWCHARTS 1) COMPLEXITY OF LOGIC: If program logic is complex then flowchart of the program becomes complicated. 2) ALTERATIONS AND MODIFICATIONS IN LOGIC: any alterations in the program logic may require redrawing of flowchart completely. 3) REUSE IS NOT POSSIBLE: As the flowchart symbols cannot be typed, always reproduction of flowchart symbols are required.
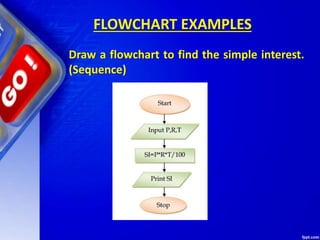
- 46. FLOWCHART EXAMPLES Draw a flowchart to find the simple interest. (Sequence)
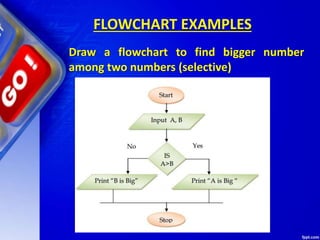
- 47. FLOWCHART EXAMPLES Draw a flowchart to find bigger number among two numbers (selective)
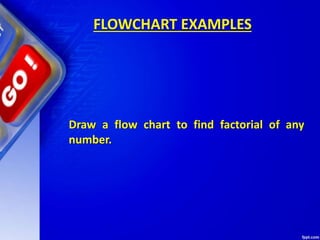
- 48. FLOWCHART EXAMPLES Draw a flow chart to find factorial of any number.
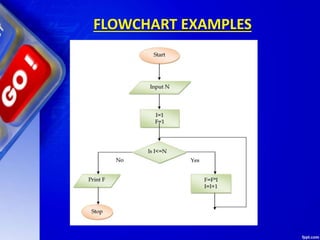
- 50. FLOWCHART EXAMPLES Draw a flow chart to print the number from 1 to N.
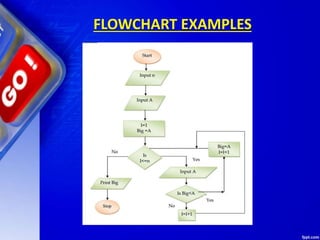
- 51. FLOWCHART EXAMPLES Draw a flow chart to find biggest number among N numbers.