Fmm And Fz Combined November 14th 2011 Power Point Final
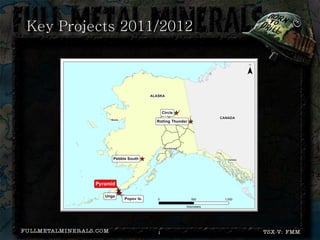
- 2. Company Overview • Discovery at the Pyramid project – Cu-Au-Mo porphyry that remains open in all directions and depth • Alaska focused: Gold and Copper • Partners: Antofagasta and Anglo American/First Dynasty Mines • Numerous greenfields projects; management team discovered Underworld’s White Gold Project 1
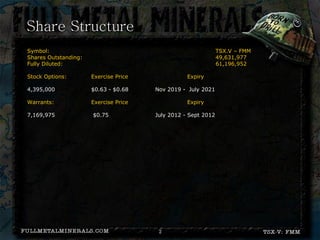
- 3. Share Structure Symbol: TSX.V – FMM Shares Outstanding: 49,631,977 Fully Diluted: 61,196,952 Stock Options: Exercise Price Expiry 4,395,000 $0.63 - $0.68 Nov 2019 - July 2021 Warrants: Exercise Price Expiry 7,169,975 $0.75 July 2012 - Sept 2012 2
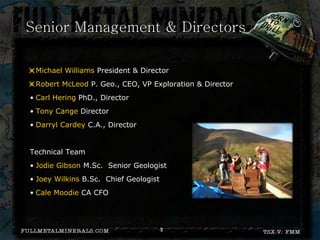
- 4. Senior Management & Directors • Michael Williams President & Director • Robert McLeod P. Geo., CEO, VP Exploration & Director • Carl Hering PhD., Director • Tony Cange Director • Darryl Cardey C.A., Director Technical Team • Jodie Gibson M.Sc. Senior Geologist • Joey Wilkins B.Sc. Chief Geologist • Cale Moodie CA CFO 3
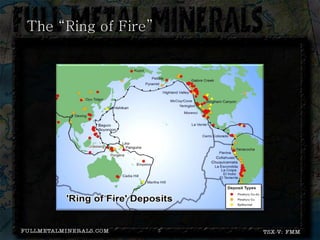
- 6. The “Ring of Fire” 5
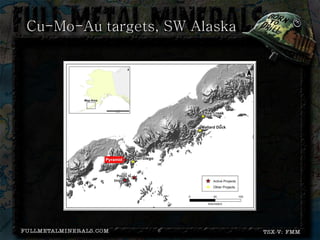
- 7. Cu-Mo-Au targets, SW Alaska 6
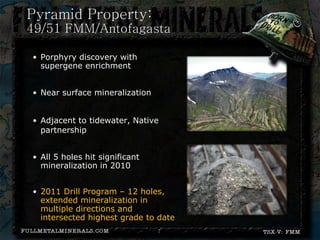
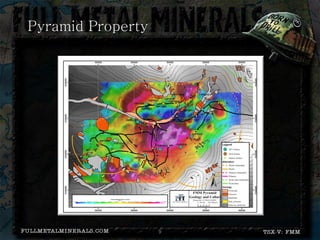
- 8. Pyramid Property: 49/51 FMM/Antofagasta • Porphyry discovery with supergene enrichment • Near surface mineralization • Adjacent to tidewater, Native partnership • All 5 holes hit significant mineralization in 2010 • 2011 Drill Program – 12 holes, extended mineralization in multiple directions and intersected highest grade to date 7
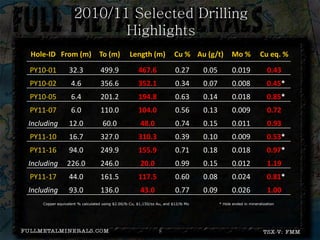
- 9. 2010/11 Selected Drilling Highlights Hole-ID From (m) To (m) Length (m) Cu % Au (g/t) Mo % Cu eq. % PY10-01 32.3 499.9 467.6 0.27 0.05 0.019 0.43 PY10-02 4.6 356.6 352.1 0.34 0.07 0.008 0.45* PY10-05 6.4 201.2 194.8 0.63 0.14 0.018 0.85* PY11-07 6.0 110.0 104.0 0.56 0.13 0.009 0.72 Including 12.0 60.0 48.0 0.74 0.15 0.011 0.93 PY11-10 16.7 327.0 310.3 0.39 0.10 0.009 0.53* PY11-16 94.0 249.9 155.9 0.71 0.18 0.018 0.97* Including 226.0 246.0 20.0 0.99 0.15 0.012 1.19 PY11-17 44.0 161.5 117.5 0.60 0.08 0.024 0.81* Including 93.0 136.0 43.0 0.77 0.09 0.026 1.00 Copper equivalent % calculated using $2.00/lb Cu, $1,150/oz Au, and $12/lb Mo * Hole ended in mineralization 8
- 10. Pyramid Property 9
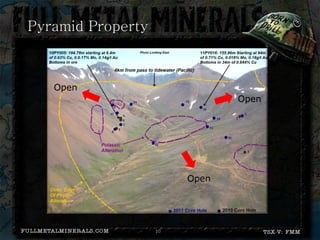
- 11. Pyramid Property Open Open Open 10
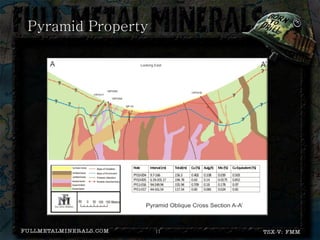
- 12. Pyramid Property 11
- 13. Full Metal Minerals: Moving forward… Pending Results • Potential 2012 Pyramid exploration program with Antofagasta: 1. Confirm and expand the new high grade zone to the southeast 2. Test down-dip extensions 3. Expand the limits of known mineralization to the north and west 17
- 15. Senior Management & Directors • Michael Williams Chairman & Director • Steve Hayes President & CEO • Robert McLeod P. Geo., Director • Aaron Keay Director • Adrian Fleming Director • Al Paterson Director • Cale Moodie C.A., Director 14
- 16. New Management New President and CEO – Steve Hayes Mr. Hayes began his career with Noranda Sales Corporation, working in multiple commodity groups in a commercial capacity over the course of eight years. Thereafter, he joined Breakwater Resources, a mid tier zinc focused mining company. Over a 14-year career with Breakwater, Mr. Hayes was responsible for the company's marketing, purchasing and ultimately corporate development. Mr. Hayes left Breakwater in conjunction with its recent takeover by Nyrstar. 15
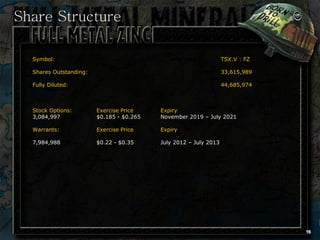
- 17. Share Structure Symbol: TSX.V : FZ Shares Outstanding: 33,615,989 Fully Diluted: 44,685,974 Stock Options: Exercise Price Expiry 3,084,997 $0.185 - $0.265 November 2019 – July 2021 Warrants: Exercise Price Expiry 7,984,988 $0.22 - $0.35 July 2012 – July 2013 16
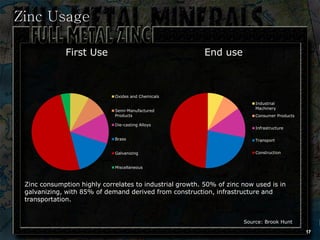
- 18. Zinc Usage First Use End use Oxides and Chemicals Industrial Machinery Semi-Manufactured Products Consumer Products Die-casting Alloys Infrastructure Brass Transport Galvanizing Construction Miscellaneous Zinc consumption highly correlates to industrial growth. 50% of zinc now used is in galvanizing, with 85% of demand derived from construction, infrastructure and transportation. Source: Brook Hunt 17
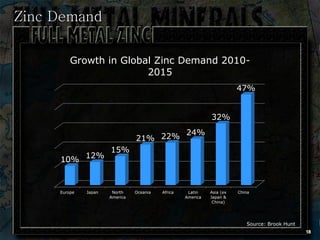
- 19. Zinc Demand Growth in Global Zinc Demand 2010- 2015 47% 32% 24% 21% 22% 15% 10% 12% Europe Japan North Oceania Africa Latin Asia (ex China America America Japan & China) Source: Brook Hunt 18
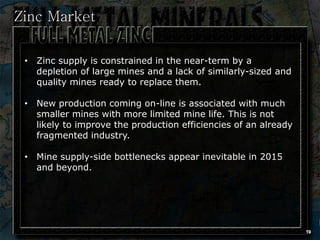
- 20. Zinc Market • Zinc supply is constrained in the near-term by a depletion of large mines and a lack of similarly-sized and quality mines ready to replace them. • New production coming on-line is associated with much smaller mines with more limited mine life. This is not likely to improve the production efficiencies of an already fragmented industry. • Mine supply-side bottlenecks appear inevitable in 2015 and beyond. 19
- 21. Zinc Market • Significant mine closures such as Century (Australia) 500,000 t/y, Brunswick and Perseverance (Canada) 340,000 t/y and Lisheen (Ireland) 170,000 t/y with only moderate replacement from new openings will move the zinc market back into deficit by 2014/15. • Xstrata estimates 1.9 Mt/y of zinc mine capacity will close by 2016 and only 800,000 t/y of new projects brought on stream to replace the lost mine supply. Furthermore, Xstrata forecasts a supply gap of 7 Mt/y by 2020. 20
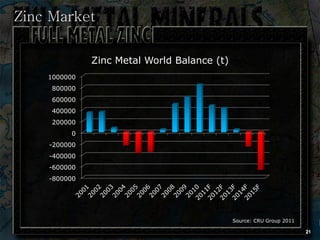
- 22. Zinc Market Zinc Metal World Balance (t) 1000000 800000 600000 400000 200000 0 -200000 -400000 -600000 -800000 Source: CRU Group 2011 21
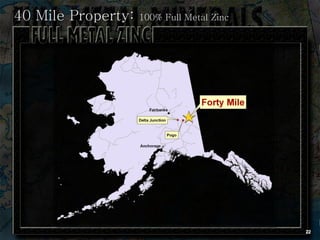
- 23. 40 Mile Property: 100% Full Metal Zinc 22
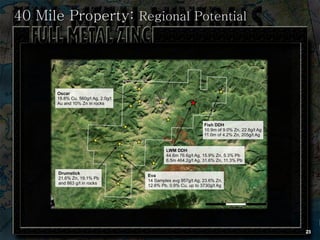
- 24. 40 Mile Property: Regional Potential 23
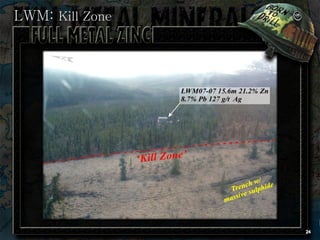
- 25. LWM: Kill Zone 24
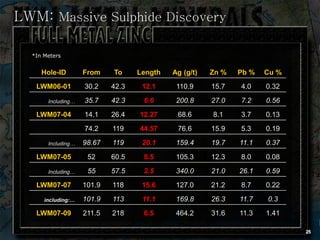
- 26. LWM: Massive Sulphide Discovery *In Meters Hole-ID From To Length Ag (g/t) Zn % Pb % Cu % LWM06-01 30.2 42.3 12.1 110.9 15.7 4.0 0.32 Including… 35.7 42.3 6.6 200.8 27.0 7.2 0.56 LWM07-04 14.1 26.4 12.27 68.6 8.1 3.7 0.13 74.2 119 44.57 76.6 15.9 5.3 0.19 Including… 98.67 119 20.1 159.4 19.7 11.1 0.37 LWM07-05 52 60.5 8.5 105.3 12.3 8.0 0.08 Including… 55 57.5 2.5 340.0 21.0 26.1 0.59 LWM07-07 101.9 118 15.6 127.0 21.2 8.7 0.22 including:… 101.9 113 11.1 169.8 26.3 11.7 0.3 LWM07-09 211.5 218 6.5 464.2 31.6 11.3 1.41 25
- 27. 2012 & Beyond • Continue exploration at the Fortymile project • Evaluation of “brownfields” zinc opportunities • Establish Full Metal Zinc as a company leveraged to the zinc market dynamics that suggest significant supply shortfalls moving forward 26