Food processing
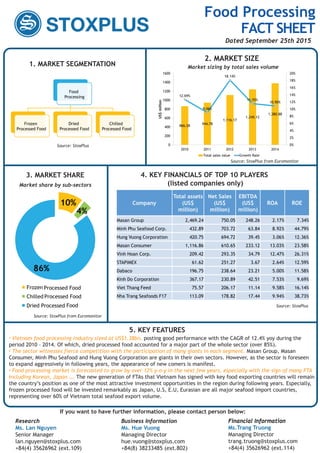
- 1. 5. KEY FEATURES 2. MARKET SIZE 4. KEY FINANCIALS OF TOP 10 PLAYERS (listed companies only) 1. MARKET SEGMENTATION Source: StoxPlus Food Processing Frozen Processed Food Dried Processed Food Chilled Processed Food 866.28 944.78 1,116.17 1,245.12 1,380.88 12.69% 9.06% 18.14% 11.55% 10.90% 0% 2% 4% 6% 8% 10% 12% 14% 16% 18% 20% 0 200 400 600 800 1000 1200 1400 1600 2010 2011 2012 2013 2014 US$million Total sales value Growth Rate Market sizing by total sales volume Vietnam food processing industry sized at US$1.38bn, posting good performance with the CAGR of 12.4% yoy during the period 2010 â 2014. Of which, dried processed food accounted for a major part of the whole sector (over 85%). The sector witnesses fierce competition with the participation of many giants in each segment. Masan Group, Masan Consumer, Minh Phu Seafood and Hung Vuong Corporation are giants in their own sectors. However, as the sector is foreseen to expand aggressively in following years, the appearance of new comers is manifest. Food processing market is forecasted to grow by over 12% y-o-y in the next few years, especially with the sign of many FTA including Korean, Japan âĶ. The new generation of FTAs that Vietnam has signed with key food exporting countries will remain the countryâs position as one of the most attractive investment opportunities in the region during following years. Especially, frozen processed food will be invested remarkably as Japan, U.S, E.U, Eurasian are all major seafood import countries, representing over 60% of Vietnam total seafood export volume. Source: StoxPlus from Euromonitor Company Total assets (US$ million) Net Sales (US$ million) EBITDA (US$ million) ROA ROE Masan Group 2,469.24 750.05 248.26 2.17% 7.34% Minh Phu Seafood Corp. 432.89 703.72 63.84 8.92% 44.79% Hung Vuong Corporation 420.75 694.72 39.45 3.06% 12.36% Masan Consumer 1,116.86 610.65 233.12 13.03% 23.58% Vinh Hoan Corp. 209.42 293.35 34.79 12.47% 26.31% STAPIMEX 61.62 251.27 3.67 2.64% 12.59% Dabaco 196.75 238.64 23.21 5.00% 11.58% Kinh Do Corporation 367.17 230.89 42.51 7.53% 9.69% Viet Thang Feed 75.57 206.17 11.14 9.58% 16.14% Nha Trang Seafoods F17 113.09 178.82 17.44 9.94% 38.73% 10% 4% 86% 3. MARKET SHARE Market share by sub-sectors Frozen Processed Food Chilled Processed Food Dried Processed Food Source: StoxPlus Source: StoxPlus from Euromonitor If you want to have further information, please contact person below: Research Ms. Lan Nguyen Senior Manager lan.nguyen@stoxplus.com +84(4) 35626962 (ext.109) Business Information Ms. Hue Vuong Managing Director hue.vuong@stoxplus.com +84(8) 38233485 (ext.802) Financial Information Ms.Trang Truong Managing Director trang.truong@stoxplus.com +84(4) 35626962 (ext.114) Research Business Information Financial InformationResearch Business Information Financial Information Food Processing FACT SHEET Dated September 25th 2015

