Force And Motion Lesson 2 Rst
2 likes533 views
This document outlines a lesson plan on force and motion that uses distance-time graphs. Students will use an ultrasound sensor and graphing software to draw shapes on a whiteboard that match a teacher's motions, interpreting how the graphs represent direction, speed, and changes in speed. Students will also annotate sample distance-time graphs, describe the motion of objects, and draw their own graphs to represent different motions. The objectives are for students to use and interpret distance-time graphs and draw graphs to represent various motion situations.
1 of 12
Ad
Recommended
Detailed lesson plan in biology
Detailed lesson plan in biologyJonessa Gurrea
Ėý
The document outlines a lesson plan about photosynthesis that includes the following:
- The objectives are for students to understand the light and dark reactions of photosynthesis and be able to differentiate the steps of each.
- Materials include colored paper, illustration boards, and a projector for a presentation.
- The procedure involves introducing photosynthesis, discussing the light-dependent reaction that uses energy from sunlight, and assigning students to research the dark reaction at home.Detailed Lesson plan Sample Digestive Process
Detailed Lesson plan Sample Digestive ProcessRose Bambico
Ėý
The document provides details of a lesson plan about the digestive system taught at Philippine Normal University. It includes objectives, preliminaries like an icebreaker game, lesson proper discussing each part of the digestive system and their functions, an assessment quiz, and enrichment activities as homework. The lesson aims to teach students the parts and processes of digestion, locate organs in the digestive system, and understand the importance of the system.Lesson plan in biology
Lesson plan in biologyEr Animo
Ėý
The lesson plan aims to teach students about the digestive system. It includes objectives, subject matter, and procedures. The procedures involve motivating students with a puzzle activity about the digestive system. The teacher will then present and discuss the key parts and functions, including digestion and absorption in the mouth, esophagus, stomach, small intestine, large intestine, and excretion. Students will work in groups to trace the food flow and discuss the importance. They will identify organs on a chart and answer evaluation questions to assess learning. For homework, students will research digestive disorders.Detailed lesson plan science
Detailed lesson plan scienceEric Cayetano
Ėý
The lesson plan summarizes the key concepts around properties of matter to be covered in a 30 minute science period for first year high school students. The objectives are for students to identify general properties of matter, conduct an experiment, and understand the importance of properties. The lesson involves reviewing definitions of mass, volume, density, and weight. Students will participate in an experiment to determine the volume of irregular solids using water displacement. To evaluate learning, students will take a short multiple choice quiz on the concepts covered in the lesson.Chapter 1: First Motion Powerpoint Notes.ppt
Chapter 1: First Motion Powerpoint Notes.pptFarrahGuzman
Ėý
motion, in physics, change with time of the position or orientation of a body. Motion along a line or a curve is called translation. Motion that changes the orientation of a body is called rotation. In both cases all points in the body have the same velocity (directed speed) and the same acceleration (time rate of change of velocity). The most general kind of motion combines both translation and rotation.
All motions are relative to some frame of reference. Saying that a body is at rest, which means that it is not in motion, merely means that it is being described with respect to a frame of reference that is moving together with the body. For example, a body on the surface of the Earth may appear to be at rest, but that is only because the observer is also on the surface of the Earth. The Earth itself, together with both the body and the observer, is moving in its orbit around the Sun and rotating on its own axis at all times. As a rule, the motions of bodies obey Newtonâs laws of motion. However, motion at speeds close to the speed of light must be treated by using the theory of relativity, and the motion of very small bodies (such as electrons) must be treated by using quantum mechanics.
The Editors of Encyclopaedia Britannica
This article was most recently revised and updated by Adam Augustyn.
kinematics
Table of Contents
Introduction
References & Edit History
Related Topics
Quizzes
Italian physicist Guglielmo Marconi at work in the wireless room of his yacht Electra, c. 1920.
All About Physics Quiz
Related Questions
Is mathematics a physical science?
Why does physics work in SI units?
Read Next
Highway Night Traffic Portland, drive, driving, car, automobile.
What's the Difference Between Speed and Velocity?
Above the clouds 130 nautical miles below, astronaut Mark C. Lee floats freely without tethers as he tests the new Simplified Aid for Extravehicular Activity (EVA) Spacewalk Rescue (SAFER) system, Sept. 16, 1994. Space Shuttle Discovery, STS-64
Gravity: From Apples to the Universe
Discover
Ice Sledge Hockey, Hockey Canada Cup, USA (left) vs Canada, 2009. UBC Thunderbird Arena, Vancouver, BC, competition site for Olympic ice hockey and Paralympic ice sledge hockey. Vancouver 2010 Olympic and Paralympic Winter Games, Vancouver Olympics
10 Best Hockey Players of All Time
United States Presidential Election of 2012. Mitt Romney. Official portrait of President Barack Obama in the Oval Office, Dec. 6, 2012 after his reelection Nov. 6, 2012. Official portrait Obama
10 Democrats Who Made History
Binary Computer Code, Binary Code, Internet, Technology, Password, Data
How Does Wi-Fi Work?
Flags of the countries of the world (flagpoles).
How Many Countries Are There in the World?
Mona Lisa, oil on wood panel by Leonardo da Vinci, c. 1503-06; in the Louvre, Paris, France. 77 x 53 cm.
Why Is the Mona Lisa So Famous?
A Factory Interior, watercolor, pen and gray ink, graphite, and white goache on wove paper by unknown artist, c. 1871-91; in the Yale CChapter 1 Motion Powerpoint and Notes.ppt
Chapter 1 Motion Powerpoint and Notes.pptFarrahGuzman
Ėý
Chapter 1 covers the basics of motion, defining it as a change in position relative to a reference point. It explains concepts like speed, velocity, and acceleration, along with methods for measuring these properties, such as using meters and kilometers. The section also discusses how to interpret motion graphs and describes various examples of constant and changing speeds.2_Force&Motion_T.pptx
2_Force&Motion_T.pptxssusera6add7
Ėý
This document provides an overview of chapter 2 on forces and motion from the Form 4 Physics textbook. It includes 12 learning objectives covering topics like linear motion, motion graphs, inertia, momentum, forces, impulse, and applications. The chapter also analyzes past year exam questions and provides a concept map relating different concepts in forces and motion. Examples and exercises are given to illustrate key concepts.Chapter 2 forces and motion
Chapter 2 forces and motionSrp KaMie Loo
Ėý
The document summarizes key concepts about linear motion, including:
1. It defines distance, displacement, speed, velocity, acceleration, and deceleration. Distance is the total length traveled regardless of direction, while displacement considers direction.
2. It discusses motion graphs, including displacement-time and velocity-time graphs. Displacement-time graphs show position over time, while velocity-time graphs show speed over time. The slope of each graph relates to velocity and acceleration.
3. It explains inertia as an object's resistance to changes in its motion. Inertia increases with an object's mass. According to Newton's first law, objects at rest stay at rest and objects in motion stay in motion withPhysics F3 (IGCSE) speed, velocity and acceleration
Physics F3 (IGCSE) speed, velocity and acceleration Nurul Fadhilah
Ėý
This document covers key concepts in physics related to speed, velocity, acceleration, and motion graphs. It defines speed and velocity, distinguishing that velocity includes direction while speed does not. It describes how to calculate average speed, acceleration, and uses graphs of distance-time and velocity-time to analyze motion. Constant acceleration is examined through examples of calculating final velocity. The document also discusses free fall near Earth and how objects accelerate at approximately 9.8 m/s2 due to gravity.Speed, velocity and acceleration
Speed, velocity and accelerationShagorika Das
Ėý
This document discusses key concepts in physics related to speed, velocity, and acceleration. It defines speed and velocity, explaining that velocity includes both magnitude and direction. It describes how to calculate average speed, acceleration, and deceleration. Graphs of speed versus time and velocity versus time are examined, including how to determine acceleration from gradients and distance from areas. Free fall under gravity and the effects of air resistance on terminal velocity are also summarized.246275336-7th-Grade-Chapter-1-Motion-Powerpoint-Notes.ppt
246275336-7th-Grade-Chapter-1-Motion-Powerpoint-Notes.pptulyannningal025
Ėý
The document outlines the concepts of motion, speed, velocity, and acceleration, explaining how to determine an object's motion relative to a reference point. It also discusses how to measure distance, calculate speed and acceleration, and graph motion using line graphs. Key definitions and examples illustrate the differences between concepts like speed and velocity, as well as how to interpret motion graphs.P2.1 forces and their effects
P2.1 forces and their effectsSteve Bishop
Ėý
I apologize, I do not have enough context to determine which sheep Dolly is a clone of based on the information provided. A clone is an exact genetic copy of the organism it was cloned from. To answer the question, I would need to know more details about sheep A and B, such as their genetic makeup or other distinguishing characteristics, in order to identify which one Dolly is a clone of.Core Content Coaching Grade 6 Motion & Speed 14-15
Core Content Coaching Grade 6 Motion & Speed 14-15raegan_witt-malandruccolo
Ėý
This document provides resources and planning information for teaching a unit on speed and motion in 6th grade science. It includes a pacing calendar, TEKS objectives, formative assessment data from past STAAR exams, recommended activities and lessons, and suggestions for differentiation and higher-level questioning. The goal is to support teachers in effectively planning a unit to help students understand concepts of speed, motion, and graphing changes in motion as outlined in the 6th grade science TEKS.the motion_activities
the motion_activitiesJordi Taboada
Ėý
The document discusses concepts related to motion, including reference frames, distance, displacement, speed, velocity, and acceleration. It provides videos and simulations to explain these concepts and includes activities for students to practice calculating values like displacement and velocity given scenarios of objects in motion. The document aims to teach students the essential physics of motion through interactive multimedia content and consolidation exercises.Speed+velocity+acceleration
Speed+velocity+accelerationjacquibridges
Ėý
The document provides learning objectives and concepts related to kinematics including displacement, speed, velocity, acceleration, and equations of motion. The key points are:
1. It defines important kinematics terms like displacement, speed, velocity, acceleration and describes how to represent motion using words, diagrams, graphs and equations.
2. Graphs of distance-time and velocity-time are introduced and it is explained that their slopes provide speed and acceleration respectively.
3. Equations of motion that apply to objects with constant acceleration in a straight line are given along with examples of how to use them to solve problems.
4. Free fall and projectile motion are described and representations using velocity-time graphs are shownImportant Helpful Physics Notes/Formula--Must See
Important Helpful Physics Notes/Formula--Must Seeanicholls1234
Ėý
The document discusses key physics concepts related to motion including:
- Speed is distance traveled over time. Velocity includes direction of motion.
- The slope of a distance-time graph represents speed. The area under a velocity-time graph represents distance traveled.
- Forces can cause objects at rest to accelerate or objects in motion to speed up, slow down, or change direction depending on whether the net force is zero or non-zero. Acceleration depends on the net force applied and the object's mass.3-kinematics.ppt general physics 1 PowerPoint
3-kinematics.ppt general physics 1 PowerPointLloydGabrielPoligrat
Ėý
The document provides an overview of kinematics for AS-level mathematics, focusing on motion graphs and the key concepts of distance, displacement, speed, velocity, and acceleration. It explains how these concepts are represented graphically and highlights the relationships between different types of motion graphs, including distance-time, velocity-time, and acceleration-time graphs. Additionally, it presents formulas for constant acceleration and offers worked examples to demonstrate their applications in various scenarios.Physics revision
Physics revisionThomas Dence
Ėý
This revision guide should be used alongside other activities and may not contain all necessary information. Some areas may be incomplete or missing vital details. By continuing, you confirm acknowledging this statement.Describing Motion 2012
Describing Motion 2012Stephen Taylor
Ėý
The document provides an introduction to describing motion through kinematics. It discusses key concepts such as scalars and vectors, distance and displacement, speed and velocity. It presents various methods for describing displacement including using components, magnitude and direction, and vector diagrams. The document also examines how to calculate speed and velocity from changes in distance or displacement over time. Graphs such as distance-time and velocity-time graphs are introduced as ways to represent motion. Students are encouraged to practice these concepts through activities such as an orienteering course and analyzing motion data.Physics form 4 yearly planning
Physics form 4 yearly planningMohd Zawawi Mat Yusoff
Ėý
1. The document is a yearly lesson plan for Physics Form 4 at SMK Sultan Badlishah covering 18 weeks from January to June.
2. It is divided into 3 learning areas: Introduction to Physics, Forces and Motion, and Forces and Pressure.
3. Each week covers 1-2 learning objectives and outcomes, suggested learning activities including experiments, and teaching aids with an emphasis on developing scientific skills and noble values.Force and Motion Year 10
Force and Motion Year 10ngibellini
Ėý
This document provides information about force and motion, including definitions, formulas, and examples. It includes:
- Definitions of key terms like speed, velocity, mass, weight, friction, and drag.
- Formulas for calculating speed, velocity, and weight. Speed is defined as distance divided by time. Weight is defined as mass multiplied by gravity.
- Examples of calculating speed, velocity, and weight in different scenarios. This includes examples using conversions between units like km/h, m/s, and calculations for objects on Earth and other planets.
- Descriptions of factors that affect motion, like balanced and unbalanced forces, friction, air resistance, gravity, and weight. Examples arescience g8 force motion
science g8 force motionLeann Carla Adan
Ėý
1. The document describes a 10-lesson physical science unit on forces and motion for 8th grade students.
2. The lessons use simulations, labs, and other activities to help students understand concepts like speed, velocity, acceleration, and Newton's laws of motion.
3. Assessment includes hands-on tasks where students measure and graph motion, as well as discussions, lab reports, and a unit test.Motion
MotionFatima Bianca Gueco
Ėý
The document discusses concepts related to motion including distance vs displacement, speed vs velocity, acceleration, kinematics formulas, and graphing position, velocity, and acceleration over time. It provides examples and explanations of these physics concepts as well as tips for graphing motion.Motion Class 9th
Motion Class 9thBHAVAN VIDYALAYA, PANCHKULA
Ėý
This document defines and explains key concepts related to motion including:
- Motion is defined as a change in position or place over time. It can be linear or circular.
- Relative motion occurs between two objects moving in the same or opposite directions.
- Distance is the total path length traveled, while displacement is the shortest distance between the start and end points.
- Speed is how distance changes over time, while velocity includes both speed and direction.
- Acceleration is the rate of change of velocity over time and can be positive, negative, or zero.
- Graphs of position vs time and velocity vs time can be used to analyze an object's motion.Force and motion assignment
Force and motion assignment13023901-016
Ėý
This document provides information about force, motion, and graphs of motion. It defines force and motion, lists examples of each, and identifies different types of each including friction, gravity, magnetism, momentum, acceleration, speed, and velocity. It describes Newton's three laws of motion. It defines linear and nonlinear graphs and provides examples of acceleration-time graphs representing different motions. The graphs can be used to interpret whether an object is speeding up, slowing down, or moving at constant speed.Constant velocity presentation
Constant velocity presentationsmithnj
Ėý
This document provides an overview of a physics lesson on kinematics and constant velocity. It discusses key concepts like frame of reference, vector vs scalar quantities, distance vs displacement, speed vs velocity. It describes activities like using motion maps, collecting position-time data, and graphing and interpreting position-time and velocity-time graphs. The class involves group work, discussions, worksheets and a lab activity to measure and analyze constant velocity motion.PHY300 Chapter 2 physics 5e
PHY300 Chapter 2 physics 5eBealCollegeOnline
Ėý
This document summarizes key concepts from Chapter 2 of a physics textbook, including:
1) Position, displacement, velocity, acceleration, and free fall are introduced and defined. Graphical representations and kinematic equations relating these quantities are also presented.
2) For motion with constant acceleration, equations are provided to calculate displacement, velocity, and acceleration given initial conditions and time. Free fall near the Earth's surface produces a constant downward acceleration of about 9.8 m/s2.
3) Examples apply concepts like determining stopping distances, maximum heights reached, and impact velocities to illustrate kinematic relationships for one-dimensional motion under constant acceleration.Gcse physics revision booklet
Gcse physics revision bookletMitesh Parekh
Ėý
This document provides a summary sheet for GCSE Additional Physics revision. It contains multiple choice and fill-in-the-blank questions testing knowledge of topics like motion, forces, energy, momentum, static electricity, and current electricity. The summary sheet can be used to self-test understanding and identify weak areas for further study using online resources or purchasing additional revision guides.Application Software
Application Softwarepy7rjs
Ėý
Application software directly performs tasks for the user like writing letters, creating presentations, or playing DVDs, in contrast to system software which integrates the computer's capabilities without directly applying them. Application software refers both to the program itself and its implementation. It is generally the primary reason users turn on their computer in the first place to complete tasks like writing or watching videos. The homework questions from pages 235-237 of the book should be completed and uploaded since school internet access may be unreliable over the break due to maintenance.Classification Of Software
Classification Of Softwarepy7rjs
Ėý
The document classifies different types of software:
1) Operating systems provide an environment for users to run programs and allow generic programs to run on different hardware. Examples include Windows, Mac OS X, and Linux.
2) Library programs are shared code reused across multiple programs to avoid rewriting common functions. They include mouse routines and dynamic link libraries (.dll files).
3) Utility programs are small add-on programs for computer maintenance tasks like creating zip files or disk defragmentation.
4) Language translators convert programs into machine-readable code, including assemblers that directly translate to binary, compilers that optimize code in multiple passes, and interpreters that translate chunks of code on the fly.More Related Content
Similar to Force And Motion Lesson 2 Rst (20)
Physics F3 (IGCSE) speed, velocity and acceleration
Physics F3 (IGCSE) speed, velocity and acceleration Nurul Fadhilah
Ėý
This document covers key concepts in physics related to speed, velocity, acceleration, and motion graphs. It defines speed and velocity, distinguishing that velocity includes direction while speed does not. It describes how to calculate average speed, acceleration, and uses graphs of distance-time and velocity-time to analyze motion. Constant acceleration is examined through examples of calculating final velocity. The document also discusses free fall near Earth and how objects accelerate at approximately 9.8 m/s2 due to gravity.Speed, velocity and acceleration
Speed, velocity and accelerationShagorika Das
Ėý
This document discusses key concepts in physics related to speed, velocity, and acceleration. It defines speed and velocity, explaining that velocity includes both magnitude and direction. It describes how to calculate average speed, acceleration, and deceleration. Graphs of speed versus time and velocity versus time are examined, including how to determine acceleration from gradients and distance from areas. Free fall under gravity and the effects of air resistance on terminal velocity are also summarized.246275336-7th-Grade-Chapter-1-Motion-Powerpoint-Notes.ppt
246275336-7th-Grade-Chapter-1-Motion-Powerpoint-Notes.pptulyannningal025
Ėý
The document outlines the concepts of motion, speed, velocity, and acceleration, explaining how to determine an object's motion relative to a reference point. It also discusses how to measure distance, calculate speed and acceleration, and graph motion using line graphs. Key definitions and examples illustrate the differences between concepts like speed and velocity, as well as how to interpret motion graphs.P2.1 forces and their effects
P2.1 forces and their effectsSteve Bishop
Ėý
I apologize, I do not have enough context to determine which sheep Dolly is a clone of based on the information provided. A clone is an exact genetic copy of the organism it was cloned from. To answer the question, I would need to know more details about sheep A and B, such as their genetic makeup or other distinguishing characteristics, in order to identify which one Dolly is a clone of.Core Content Coaching Grade 6 Motion & Speed 14-15
Core Content Coaching Grade 6 Motion & Speed 14-15raegan_witt-malandruccolo
Ėý
This document provides resources and planning information for teaching a unit on speed and motion in 6th grade science. It includes a pacing calendar, TEKS objectives, formative assessment data from past STAAR exams, recommended activities and lessons, and suggestions for differentiation and higher-level questioning. The goal is to support teachers in effectively planning a unit to help students understand concepts of speed, motion, and graphing changes in motion as outlined in the 6th grade science TEKS.the motion_activities
the motion_activitiesJordi Taboada
Ėý
The document discusses concepts related to motion, including reference frames, distance, displacement, speed, velocity, and acceleration. It provides videos and simulations to explain these concepts and includes activities for students to practice calculating values like displacement and velocity given scenarios of objects in motion. The document aims to teach students the essential physics of motion through interactive multimedia content and consolidation exercises.Speed+velocity+acceleration
Speed+velocity+accelerationjacquibridges
Ėý
The document provides learning objectives and concepts related to kinematics including displacement, speed, velocity, acceleration, and equations of motion. The key points are:
1. It defines important kinematics terms like displacement, speed, velocity, acceleration and describes how to represent motion using words, diagrams, graphs and equations.
2. Graphs of distance-time and velocity-time are introduced and it is explained that their slopes provide speed and acceleration respectively.
3. Equations of motion that apply to objects with constant acceleration in a straight line are given along with examples of how to use them to solve problems.
4. Free fall and projectile motion are described and representations using velocity-time graphs are shownImportant Helpful Physics Notes/Formula--Must See
Important Helpful Physics Notes/Formula--Must Seeanicholls1234
Ėý
The document discusses key physics concepts related to motion including:
- Speed is distance traveled over time. Velocity includes direction of motion.
- The slope of a distance-time graph represents speed. The area under a velocity-time graph represents distance traveled.
- Forces can cause objects at rest to accelerate or objects in motion to speed up, slow down, or change direction depending on whether the net force is zero or non-zero. Acceleration depends on the net force applied and the object's mass.3-kinematics.ppt general physics 1 PowerPoint
3-kinematics.ppt general physics 1 PowerPointLloydGabrielPoligrat
Ėý
The document provides an overview of kinematics for AS-level mathematics, focusing on motion graphs and the key concepts of distance, displacement, speed, velocity, and acceleration. It explains how these concepts are represented graphically and highlights the relationships between different types of motion graphs, including distance-time, velocity-time, and acceleration-time graphs. Additionally, it presents formulas for constant acceleration and offers worked examples to demonstrate their applications in various scenarios.Physics revision
Physics revisionThomas Dence
Ėý
This revision guide should be used alongside other activities and may not contain all necessary information. Some areas may be incomplete or missing vital details. By continuing, you confirm acknowledging this statement.Describing Motion 2012
Describing Motion 2012Stephen Taylor
Ėý
The document provides an introduction to describing motion through kinematics. It discusses key concepts such as scalars and vectors, distance and displacement, speed and velocity. It presents various methods for describing displacement including using components, magnitude and direction, and vector diagrams. The document also examines how to calculate speed and velocity from changes in distance or displacement over time. Graphs such as distance-time and velocity-time graphs are introduced as ways to represent motion. Students are encouraged to practice these concepts through activities such as an orienteering course and analyzing motion data.Physics form 4 yearly planning
Physics form 4 yearly planningMohd Zawawi Mat Yusoff
Ėý
1. The document is a yearly lesson plan for Physics Form 4 at SMK Sultan Badlishah covering 18 weeks from January to June.
2. It is divided into 3 learning areas: Introduction to Physics, Forces and Motion, and Forces and Pressure.
3. Each week covers 1-2 learning objectives and outcomes, suggested learning activities including experiments, and teaching aids with an emphasis on developing scientific skills and noble values.Force and Motion Year 10
Force and Motion Year 10ngibellini
Ėý
This document provides information about force and motion, including definitions, formulas, and examples. It includes:
- Definitions of key terms like speed, velocity, mass, weight, friction, and drag.
- Formulas for calculating speed, velocity, and weight. Speed is defined as distance divided by time. Weight is defined as mass multiplied by gravity.
- Examples of calculating speed, velocity, and weight in different scenarios. This includes examples using conversions between units like km/h, m/s, and calculations for objects on Earth and other planets.
- Descriptions of factors that affect motion, like balanced and unbalanced forces, friction, air resistance, gravity, and weight. Examples arescience g8 force motion
science g8 force motionLeann Carla Adan
Ėý
1. The document describes a 10-lesson physical science unit on forces and motion for 8th grade students.
2. The lessons use simulations, labs, and other activities to help students understand concepts like speed, velocity, acceleration, and Newton's laws of motion.
3. Assessment includes hands-on tasks where students measure and graph motion, as well as discussions, lab reports, and a unit test.Motion
MotionFatima Bianca Gueco
Ėý
The document discusses concepts related to motion including distance vs displacement, speed vs velocity, acceleration, kinematics formulas, and graphing position, velocity, and acceleration over time. It provides examples and explanations of these physics concepts as well as tips for graphing motion.Motion Class 9th
Motion Class 9thBHAVAN VIDYALAYA, PANCHKULA
Ėý
This document defines and explains key concepts related to motion including:
- Motion is defined as a change in position or place over time. It can be linear or circular.
- Relative motion occurs between two objects moving in the same or opposite directions.
- Distance is the total path length traveled, while displacement is the shortest distance between the start and end points.
- Speed is how distance changes over time, while velocity includes both speed and direction.
- Acceleration is the rate of change of velocity over time and can be positive, negative, or zero.
- Graphs of position vs time and velocity vs time can be used to analyze an object's motion.Force and motion assignment
Force and motion assignment13023901-016
Ėý
This document provides information about force, motion, and graphs of motion. It defines force and motion, lists examples of each, and identifies different types of each including friction, gravity, magnetism, momentum, acceleration, speed, and velocity. It describes Newton's three laws of motion. It defines linear and nonlinear graphs and provides examples of acceleration-time graphs representing different motions. The graphs can be used to interpret whether an object is speeding up, slowing down, or moving at constant speed.Constant velocity presentation
Constant velocity presentationsmithnj
Ėý
This document provides an overview of a physics lesson on kinematics and constant velocity. It discusses key concepts like frame of reference, vector vs scalar quantities, distance vs displacement, speed vs velocity. It describes activities like using motion maps, collecting position-time data, and graphing and interpreting position-time and velocity-time graphs. The class involves group work, discussions, worksheets and a lab activity to measure and analyze constant velocity motion.PHY300 Chapter 2 physics 5e
PHY300 Chapter 2 physics 5eBealCollegeOnline
Ėý
This document summarizes key concepts from Chapter 2 of a physics textbook, including:
1) Position, displacement, velocity, acceleration, and free fall are introduced and defined. Graphical representations and kinematic equations relating these quantities are also presented.
2) For motion with constant acceleration, equations are provided to calculate displacement, velocity, and acceleration given initial conditions and time. Free fall near the Earth's surface produces a constant downward acceleration of about 9.8 m/s2.
3) Examples apply concepts like determining stopping distances, maximum heights reached, and impact velocities to illustrate kinematic relationships for one-dimensional motion under constant acceleration.Gcse physics revision booklet
Gcse physics revision bookletMitesh Parekh
Ėý
This document provides a summary sheet for GCSE Additional Physics revision. It contains multiple choice and fill-in-the-blank questions testing knowledge of topics like motion, forces, energy, momentum, static electricity, and current electricity. The summary sheet can be used to self-test understanding and identify weak areas for further study using online resources or purchasing additional revision guides.More from py7rjs (8)
Application Software
Application Softwarepy7rjs
Ėý
Application software directly performs tasks for the user like writing letters, creating presentations, or playing DVDs, in contrast to system software which integrates the computer's capabilities without directly applying them. Application software refers both to the program itself and its implementation. It is generally the primary reason users turn on their computer in the first place to complete tasks like writing or watching videos. The homework questions from pages 235-237 of the book should be completed and uploaded since school internet access may be unreliable over the break due to maintenance.Classification Of Software
Classification Of Softwarepy7rjs
Ėý
The document classifies different types of software:
1) Operating systems provide an environment for users to run programs and allow generic programs to run on different hardware. Examples include Windows, Mac OS X, and Linux.
2) Library programs are shared code reused across multiple programs to avoid rewriting common functions. They include mouse routines and dynamic link libraries (.dll files).
3) Utility programs are small add-on programs for computer maintenance tasks like creating zip files or disk defragmentation.
4) Language translators convert programs into machine-readable code, including assemblers that directly translate to binary, compilers that optimize code in multiple passes, and interpreters that translate chunks of code on the fly.Fetch Execute Cycle
Fetch Execute Cyclepy7rjs
Ėý
The fetch-execute cycle can be broken down into two main phases: the fetch phase, where the address of the next instruction is copied from the program counter to the memory address register to retrieve the instruction from memory into the memory buffer register, and then the instruction register; and the execute phase, where the instruction held in the instruction register is decoded and executed through a sequence of micro-operations depending on the specific instruction.Generations Of Programming Languages
Generations Of Programming Languagespy7rjs
Ėý
There are four generations of programming languages:
1) First generation languages are machine code/binary, the only language computers can understand directly.
2) Second generation languages are assembly languages which provide mnemonics to represent machine code instructions.
3) Third generation languages like Java, C, and Basic are easier for humans to read and write. They are converted into machine code.
4) Fourth generation languages like SQL and Prolog are more focused on problem solving than implementation details. They are very platform independent.Secondary Storage
Secondary Storagepy7rjs
Ėý
Secondary storage, such as hard disks, floppy disks, optical disks, magnetic tapes, and online storage, provides large storage capacities and reliability compared to primary storage/memory. It allows permanent storage of software, data, and files. Benefits include vast storage capacities, reliability since data is safe from tampering, convenience of quick data access, and lower costs than paper filing systems. Data is organized on disks through methods like sectors and cylinders to efficiently store information.Structure And Role Of The Processor
Structure And Role Of The Processorpy7rjs
Ėý
The document discusses the key components of a central processing unit (CPU) and how they work together:
The program control unit fetches instructions from memory and executes them one at a time, while the arithmetic logic unit performs arithmetic and logical operations. Registers provide very fast storage for both the program and data. An internal clock governs the rate at which the processor performs operations. Buses connect the different components and transfer data around the CPU.Writing Up Experiments Checklist
Writing Up Experiments Checklistpy7rjs
Ėý
This document provides a checklist for writing up experiments, outlining the key sections and criteria for each section. The sections include the aim, prediction, diagram, method, results, conclusion, and evaluation. For each section, criteria are listed such as describing the aim, making a clear prediction with reasoning, following diagram rules, using appropriate terminology in the method, recording results neatly in a table with units and labels, linking results to the aim in the conclusion, and suggesting ways to improve reliability and reduce errors in the evaluation.Ad
Recently uploaded (20)
IIT KGP Quiz Week 2024 Sports Quiz (Prelims + Finals)
IIT KGP Quiz Week 2024 Sports Quiz (Prelims + Finals)IIT Kharagpur Quiz Club
Ėý
The document outlines the format for the Sports Quiz at Quiz Week 2024, covering various sports & games and requiring participants to Answer without external sources. It includes specific details about question types, scoring, and examples of quiz questions. The document emphasizes fair play and enjoyment of the quiz experience.THE PSYCHOANALYTIC OF THE BLACK CAT BY EDGAR ALLAN POE (1).pdf
THE PSYCHOANALYTIC OF THE BLACK CAT BY EDGAR ALLAN POE (1).pdfnabilahk908
Ėý
Psychoanalytic Analysis of The Black Cat by Edgar Allan Poe explores the deep psychological dimensions of the narratorâs disturbed mind through the lens of Sigmund Freudâs psychoanalytic theory. According to Freud (1923), the human psyche is structured into three components: the Id, which contains primitive and unconscious desires; the Ego, which operates on the reality principle and mediates between the Id and the external world; and the Superego, which reflects internalized moral standards.
In this story, Poe presents a narrator who experiences a psychological breakdown triggered by repressed guilt, aggression, and internal conflict. This analysis focuses not only on the gothic horror elements of the narrative but also on the narratorâs mental instability and emotional repression, demonstrating how the imbalance of these three psychic forces contributes to his downfall.Filipino 9 Maikling Kwento Ang Ama Panitikang Asiyano
Filipino 9 Maikling Kwento Ang Ama Panitikang Asiyanosumadsadjelly121997
Ėý
Filipino 9 Maikling Kwento Ang Ama Panitikang AsiyanoPaper 107 | From Watchdog to Lapdog: Ishiguroâs Fiction and the Rise of âGodi...
Paper 107 | From Watchdog to Lapdog: Ishiguroâs Fiction and the Rise of âGodi...Rajdeep Bavaliya
Ėý
Dive into a captivating analysis where Kazuo Ishiguroâs nuanced fiction meets the stark realities of postâ2014 Indian journalism. Uncover how âGodi Mediaâ turned from watchdog to lapdog, echoing the moral compromises of Ishiguroâs protagonists. Weâll draw parallels between restrained narrative silences and sensationalist headlinesâare our media heroes or traitors? Donât forget to follow for more deep dives!
M.A. Sem - 2 | Presentation
Presentation Season - 2
Paper - 107: The Twentieth Century Literature: From World War II to the End of the Century
Submitted Date: April 4, 2025
Paper Name: The Twentieth Century Literature: From World War II to the End of the Century
Topic: From Watchdog to Lapdog: Ishiguroâs Fiction and the Rise of âGodi Mediaâ in Post-2014 Indian Journalism
[Please copy the link and paste it into any web browser to access the content.]
Video Link: https://youtu.be/kIEqwzhHJ54
For a more in-depth discussion of this presentation, please visit the full blog post at the following link: https://rajdeepbavaliya2.blogspot.com/2025/04/from-watchdog-to-lapdog-ishiguro-s-fiction-and-the-rise-of-godi-media-in-post-2014-indian-journalism.html
Please visit this blog to explore additional presentations from this season:
Hashtags:
#GodiMedia #Ishiguro #MediaEthics #WatchdogVsLapdog #IndianJournalism #PressFreedom #LiteraryCritique #AnArtistOfTheFloatingWorld #MediaCapture #KazuoIshiguro
Keyword Tags:
Godi Media, Ishiguro fiction, post-2014 Indian journalism, media capture, Kazuo Ishiguro analysis, watchdog to lapdog, press freedom India, media ethics, literature and media, An Artist of the Floating WorldHistoPathology Ppt. Arshita Gupta for Diploma
HistoPathology Ppt. Arshita Gupta for Diplomaarshitagupta674
Ėý
Hello everyone please suggest your views and likes so that I uploaded more study materials
In this slide full HistoPathology according to diploma course available like fixation
Tissue processing , staining etc
Paper 106 | Ambition and Corruption: A Comparative Analysis of âThe Great Gat...
Paper 106 | Ambition and Corruption: A Comparative Analysis of âThe Great Gat...Rajdeep Bavaliya
Ėý
Dive into the glittering allure and hidden rot of the American Dream as we compare Jay Gatsbyâs lofty ambitions with Jordan Belfortâs brazen excess. Uncover how both characters chase success at the cost of their integrity and ultimately pay the price for unchecked desire. Which downfall resonates moreâGatsbyâs doomed romance or Belfortâs scandalous spiral? Hit like if youâve ever chased a dream, and follow for more literary-versus-film showdowns!
M.A. Sem - 2 | Presentation
Presentation Season - 2
Paper - 106: The Twentieth Century Literature: 1900 to World War II
Submitted Date: April 3, 2025
Paper Name: The Twentieth Century Literature: 1900 to World War II
Topic: Ambition and Corruption: A Comparative Analysis of âThe Great Gatsbyâ and âThe Wolf of Wall Streetâ
[Please copy the link and paste it into any web browser to access the content.]
Video Link: https://youtu.be/4mXmSVjTLt8
For a more in-depth discussion of this presentation, please visit the full blog post at the following link: https://rajdeepbavaliya2.blogspot.com/2025/04/ambition-and-corruption-a-comparative-analysis-of-the-great-gatsby-and-the-wolf-of-wall-street.html
Please visit this blog to explore additional presentations from this season:
Hashtags:
#AmericanDream #GreatGatsby #WolfOfWallStreet #AmbitionAndCorruption #LiteratureVsFilm #Fitzgerald #Scorsese #JayGatsby #JordanBelfort #DreamOrDownfall
Keyword Tags:
The Great Gatsby, Wolf of Wall Street, American Dream analysis, ambition corruption, Gatsby vs. Belfort, F. Scott Fitzgerald themes, Martin Scorsese film, literary comparison, movie vs. novel, moral critiquePeer Teaching Observations During School Internship
Peer Teaching Observations During School InternshipAjayaMohanty7
Ėý
FOR B.ED,M.ED,M.A.EDUCATION AND ANY STUDENT OF TEACHER EDUCATIONM&A5 Q1 1 differentiate evolving early Philippine conventional and contempora...
M&A5 Q1 1 differentiate evolving early Philippine conventional and contempora...ErlizaRosete
Ėý
MAPEH 6 QI WEEK IList View Components in Odoo 18 - Odoo šÝšÝßĢs
List View Components in Odoo 18 - Odoo šÝšÝßĢsCeline George
Ėý
In Odoo, there are many types of views possible like List view, Kanban view, Calendar view, Pivot view, Search view, etc.
The major change that introduced in the Odoo 18 technical part in creating views is the tag <tree> got replaced with the <list> for creating list views. Pests of Maize: An comprehensive overview.pptx
Pests of Maize: An comprehensive overview.pptxArshad Shaikh
Ėý
Maize is susceptible to various pests that can significantly impact yields. Key pests include the fall armyworm, stem borers, cob earworms, shoot fly. These pests can cause extensive damage, from leaf feeding and stalk tunneling to grain destruction. Effective management strategies, such as integrated pest management (IPM), resistant varieties, biological control, and judicious use of chemicals, are essential to mitigate losses and ensure sustainable maize production.LDMMIA Yoga S10 Free Workshop Grad Level
LDMMIA Yoga S10 Free Workshop Grad LevelLDM & Mia eStudios
Ėý
This is complete for June 17th. For the weekend of Summer Solstice
June 20th-22nd.
6/17/25: âMy now Grads, Youâre doing well. I applaud your efforts to continue. We all are shifting to new paradigm realities. Its rough, thereâs good and bad days/weeks. However, Reiki with Yoga assistance, does work.â
6/18/25: "For those planning the Training Program Do Welcome. Happy Summer 2k25. You are not ignored and much appreciated. Our updates are ongoing and weekly since Spring. I Hope you Enjoy the Practitioner Grad Level. There's more to come. We will also be wrapping up Level One. So I can work on Levels 2 topics. Please see documents for any news updates. Also visit our websites. Every decade I release a Campus eMap. I will work on that for summer 25. We have 2 old libraries online thats open. https://ldmchapels.weebly.com "
Our Monthly Class Roster is 7,141 for 6/21.
ALL students get privacy naturally. Thx Everyone.
As a Guest Student,
You are now upgraded to Grad Level.
See Uploads for âStudent Checkinsâ & âS9â. Thx.
Happy Summer 25.
These are also timeless.
Thank you for attending our workshops.
If you are new, do welcome.
For visual/Video style learning see our practitioner student status.
This is listed under our new training program. Updates ongoing levels 1-3 this summer. We just started Session 1 for level 1.
These are optional programs. I also would like to redo our library ebooks about Hatha and Money Yoga. THe Money Yoga was very much energy healing without the Reiki Method. An updated ebook/course will be done this year. These Projects are for *all fans, followers, teams, and Readers. TY for being presenting.K12 Tableau User Group virtual event June 18, 2025
K12 Tableau User Group virtual event June 18, 2025dogden2
Ėý
National K12 Tableau User Group: June 2025 meeting slidesOBSESSIVE COMPULSIVE DISORDER.pptx IN 5TH SEMESTER B.SC NURSING, 2ND YEAR GNM...
OBSESSIVE COMPULSIVE DISORDER.pptx IN 5TH SEMESTER B.SC NURSING, 2ND YEAR GNM...parmarjuli1412
Ėý
OBSESSIVE COMPULSIVE DISORDER INCLUDED TOPICS ARE INTRODUCTION, DEFINITION OF OBSESSION, DEFINITION OF COMPULSION, MEANING OF OBSESSION AND COMPULSION, DEFINITION OF OBSESSIVE COMPULSIVE DISORDER, EPIDERMIOLOGY OF OCD, ETIOLOGICAL FACTORS OF OCD, CLINICAL SIGN AND SYMPTOMS OF OBSESSION AND COMPULSION, MANAGEMENT INCLUDED PHARMACOTHERAPY(ANTIDEPRESSANT DRUG+ANXIOLYTIC DRUGS), PSYCHOTHERAPY, NURSING MANAGEMENT(ASSESSMENT+DIAGNOSIS+NURSING INTERVENTION+EVALUATION)) June 2025 Progress Update With Board Call_In process.pptx
June 2025 Progress Update With Board Call_In process.pptxInternational Society of Service Innovation Professionals
Ėý
---
June 25 ISSIP Event - slides in process
20250618 PPre-Event Presentation Summary - Progress Update with Board Series June 25
ISSIP Website Upcoming Events Description: https://issip.org/event/semi-annual-issip-progress-call/
Register here (even if you cannot attend live online, all who register will get link to recording and slides post-event): https://docs.google.com/forms/d/e/1FAIpQLSdThrop1rafOCo4PQkYiS2XApclJuMjYONEHRMGBsceRdcQqg/viewform
This pre-event presentation: /slideshow/june-2025-progress-update-with-board-call_in-process-pptx/280718770
This pre-event recording: https://youtu.be/Shjgd5o488o
---SCHIZOPHRENIA OTHER PSYCHOTIC DISORDER LIKE Persistent delusion/Capgras syndr...
SCHIZOPHRENIA OTHER PSYCHOTIC DISORDER LIKE Persistent delusion/Capgras syndr...parmarjuli1412
Ėý
SCHIZOPHRENIA INCLUDED TOPIC IS INTRODUCTION, DEFINITION OF GENERAL TERM IN PSYCHIATRIC, THEN DIFINITION OF SCHIZOPHRENIA, EPIDERMIOLOGY, ETIOLOGICAL FACTORS, CLINICAL FEATURE(SIGN AND SYMPTOMS OF SCHIZOPHRENIA), CLINICAL TYPES OF SCHIZOPHRENIA, DIAGNOSIS, INVESTIGATION, TREATMENT MODALITIES(PHARMACOLOGICAL MANAGEMENT, PSYCHOTHERAPY, ECT, PSYCHO-SOCIO-REHABILITATION), NURSING MANAGEMENT(ASSESSMENT,DIAGNOSIS,NURSING INTERVENTION,AND EVALUATION), OTHER PSYCHOTIC DISORDER LIKE Persistent delusion/Capgras syndrome(The Delusion of Doubles)/Acute and Transient Psychotic Disorders/Induced Delusional Disorders/Schizoaffective Disorder /CAPGRAS SYNDROME(DELUSION OF DOUBLE), GERIATRIC CONSIDERATION, FOLLOW UP, HOMECARE AND REHABILITATION OF THE PATIENT, Paper 107 | From Watchdog to Lapdog: Ishiguroâs Fiction and the Rise of âGodi...
Paper 107 | From Watchdog to Lapdog: Ishiguroâs Fiction and the Rise of âGodi...Rajdeep Bavaliya
Ėý
Paper 106 | Ambition and Corruption: A Comparative Analysis of âThe Great Gat...
Paper 106 | Ambition and Corruption: A Comparative Analysis of âThe Great Gat...Rajdeep Bavaliya
Ėý
June 2025 Progress Update With Board Call_In process.pptx
June 2025 Progress Update With Board Call_In process.pptxInternational Society of Service Innovation Professionals
Ėý
Ad
Force And Motion Lesson 2 Rst
- 1. Force and motion part2, this time it personal (or how to draw on the board by running around the room) Things Mr Steel needs â motion graph handouts, Graph paper, logit and sensor stuff, mini whiteboard and pens?
- 2. Objectives To use and interpret distance-time graphs
- 3. Outcomes match someoneâs motion to the shape of a dist-time graph draw dist-time graphs to represent various situations
- 4. A question to start (or the starter) My average speed on my journey to work was 22km/h. What information doesnât this give me about my journey?
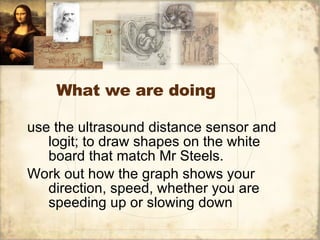
- 5. What we are doing use the ultrasound distance sensor and logit; to draw shapes on the white board that match Mr Steels. Work out how the graph shows your direction, speed, whether you are speeding up or slowing down
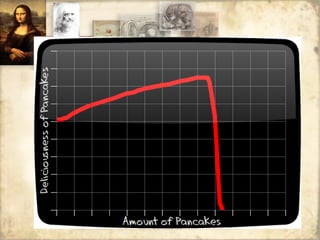
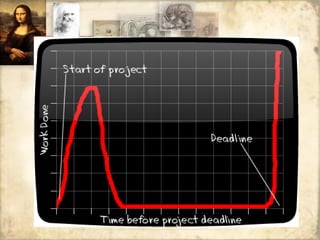
- 6. Some graphs
- 7. Some graphs
- 8. Some graphs
- 9. Some graphs
- 10. Some graphs
- 11. Other things to do Annotate a sheet of dist-time graphs to describe the motion Questions 1, 3 page 17 OCR physics
- 12. And for dessert (the plenary) describe the motion of some objects draw dist-time graphs on the mini white boards to represent the motion