Frame buffer
Download as PPTX, PDF0 likes5,521 views
This presentation contains - - Frame Buffer - Digital-to-Analog ( DAC ) Converter - Single bit plane frame buffer - N-bit plane frame buffer - 3-bit color frame buffer - 24-bit color frame buffer
1 of 13
Downloaded 12 times


Recommended
Fundamentals of the Analysis of Algorithm Efficiency
Fundamentals of the Analysis of Algorithm EfficiencySaranya Natarajan
Ěý
This document discusses analyzing the efficiency of algorithms. It introduces the framework for analyzing algorithms in terms of time and space complexity. Time complexity indicates how fast an algorithm runs, while space complexity measures the memory required. The document outlines steps for analyzing algorithms, including measuring input size, determining the basic operations, calculating frequency counts of operations, and expressing efficiency in Big O notation order of growth. Worst-case, best-case, and average-case time complexities are also discussed.Real Time Kernels
Real Time KernelsArnav Soni
Ěý
This document summarizes key aspects of real-time kernels. It begins by defining a kernel and its role. It then discusses the structure of a real-time kernel, including layers, states, data structures, and primitives. Scheduling mechanisms like ready queues, insertion, and extraction are covered. Task management, semaphores, and intertask communication using mailboxes and cyclical asynchronous buffers are summarized. The document also discusses system overhead considerations like context switching and interrupts.Polygon filling algorithm
Polygon filling algorithmAparna Joshi
Ěý
This presentation contains -
- Polygon Filling Algorithm
- Inside Test - Even Odd Test
- Scanline Polygon Filling Algorithm
- Seed Filling Approach
- Boundary Fill Algorihtm
- Edge Fill Algorithm
- 4-connected polygon
- 8-connected polygon
- Flood Fill Algorithm
Introduction to Computer Graphics
Introduction to Computer GraphicsMegha Sharma
Ěý
Computer graphics are images displayed on a computer screen and include everything on computers that is not text or sound. Computer graphics technology deals with designs and pictures on computers. Computer graphics have many applications including graphical user interfaces, computer-aided design, entertainment, image processing, visualization, image enhancement, education and training, and computer art.Windows presentation
Windows presentationtes31
Ěý
Microsoft Corporation developed the Windows operating system. Windows is a series of graphical interface operating systems that came to dominate the personal computer market. The most recent versions are Windows 8.1 for personal computers, Windows Phone 8 for mobile devices, Windows Server 2012 R2 for server computers, and Windows Embedded 8 for embedded devices.Leading effective meetings slides
Leading effective meetings slidesLaura Staley
Ěý
The document outlines an agenda for a workshop on leading effective meetings. The workshop objectives are to help participants determine if a meeting is necessary, create an effective agenda, and facilitate the meeting to achieve its objectives. The agenda covers topics such as preparing for a meeting by determining its purpose and objectives, creating an agenda, conducting the meeting by following the agenda and documenting decisions, and following up after the meeting. The workshop provides guidance for making meetings effective through practicing facilitation skills and receiving feedback.Random and raster scan
Random and raster scanankur bhalla
Ěý
The document summarizes raster scan and random scan displays. Raster scan displays use an electron beam that sweeps across the screen from top to bottom to generate pixels based on values stored in a refresh buffer. Random scan displays directly draw images using an electron beam without a fixed pattern, storing only line drawing instructions. The key differences are that raster scan is used for realistic images due to storing intensity values while random scan has higher resolution but is limited to line drawings. Both use a cathode ray tube containing an electron gun, deflection coils, and phosphor screen.Ip address presentation
Ip address presentationmuhammad amir
Ěý
An IP address is a unique 32-bit number that identifies each device on a network. It allows devices to communicate by sending and receiving data packets. IP addresses are made up of a network portion and host portion, with four sections that each range from 0-255. There are five classes of IP addresses - A, B, C, D and E - that determine the number of networks and hosts. IPv4 uses 32-bit addresses written in dotted decimal notation, while IPv6 uses 128-bit addresses written in hex. IP addresses can be static or dynamically assigned by a DHCP server.Raster scan system
Raster scan systemMohd Arif
Ěý
The document describes the components and operation of a raster scan graphics display system. A video controller accesses a frame buffer in system memory to refresh the screen. It performs operations like retrieving pixel intensities from different memory areas and using two frame buffers to allow refreshing one screen while filling the other for animation. A raster scan display processor can digitize graphics into pixel intensities for storage in the frame buffer to offload this processing from the CPU.Hidden surface removal
Hidden surface removalPunyajoy Saha
Ěý
This presentation is about hidden surface removal, which is used in the representation of 3d objects in an image .Cohen sutherland line clipping
Cohen sutherland line clippingMani Kanth
Ěý
The Cohen-Sutherland algorithm divides the plane into 9 regions and uses 4-bit codes to encode whether each endpoint of a line segment is left, right, above, or below the clipping window. It then uses the endpoint codes to either trivially accept or reject the line segment, or perform clipping by calculating the intersection point of the line with the window boundary and replacing the outside endpoint. The main steps are to assign codes to endpoints, AND the codes to check for trivial acceptance or rejection, clip by replacing outside endpoints if needed, and repeating for other line segments.Circle generation algorithm
Circle generation algorithmAnkit Garg
Ěý
The document describes the Breshenham's circle generation algorithm. It explains that the algorithm uses a decision parameter to iteratively select pixels along the circumference of a circle. It provides pseudocode for the algorithm, which initializes x and y values, calculates a decision parameter, and increments x while decrementing y at each step, plotting points based on the decision parameter. An example of applying the algorithm to generate a circle with radius 5 is also provided.Depth Buffer Method
Depth Buffer MethodUmmiya Mohammedi
Ěý
The depth buffer method is used to determine visibility in 3D graphics by testing the depth (z-coordinate) of each surface to determine the closest visible surface. It involves using two buffers - a depth buffer to store the depth values and a frame buffer to store color values. For each pixel, the depth value is calculated and compared to the existing value in the depth buffer, and if closer the color and depth values are updated in the respective buffers. This method is implemented efficiently in hardware and processes surfaces one at a time in any order.2 d viewing computer graphics
2 d viewing computer graphicsKALESHWAR KUMAR
Ěý
The document discusses 2D viewing and clipping techniques in computer graphics. It describes how clipping is used to select only a portion of an image to display by defining a clipping region. It also discusses 2D viewing transformations which involve operations like translation, rotation and scaling to map coordinates from a world coordinate system to a device coordinate system. It specifically describes the Cohen-Sutherland line clipping algorithm which uses region codes to quickly determine if lines are completely inside, outside or intersect the clipping region to optimize the clipping calculation.Computer graphics basic transformation
Computer graphics basic transformationSelvakumar Gna
Ěý
This document discusses 2D geometric transformations including translation, rotation, and scaling. It provides the mathematical definitions and matrix representations for each transformation. Translation moves an object along a straight path, rotation moves it along a circular path, and scaling changes its size. All transformations can be represented by 3x3 matrices using homogeneous coordinates to allow combinations of multiple transformations. The inverse of each transformation matrix is also defined.2D transformation (Computer Graphics)
2D transformation (Computer Graphics)Timbal Mayank
Ěý
with today's advanced technology like photoshop, paint etc. we need to understand some basic concepts like how they are cropping the image , tilt the image etc.
In our presentation you will find basic introduction of 2D transformation.Random scan displays and raster scan displays
Random scan displays and raster scan displaysSomya Bagai
Ěý
Raster scan displays work by sweeping an electron beam across the screen in horizontal lines from top to bottom. As the beam moves, its intensity is turned on and off to illuminate pixels and form an image. The pixel values are stored in and retrieved from a refresh buffer or frame buffer. Random scan displays draw images using geometric primitives like points and lines based on mathematical equations, directing the electron beam only where needed. Raster scans have higher resolution but jagged lines, while random scans produce smooth lines but cannot display complex images. Both use a video controller and frame buffer in memory to control the display process.Visible surface detection in computer graphic
Visible surface detection in computer graphicanku2266
Ěý
Visible surface detection aims to determine which parts of 3D objects are visible and which are obscured. There are two main approaches: object space methods compare objects' positions to determine visibility, while image space methods process surfaces one pixel at a time to determine visibility based on depth. Depth-buffer and A-buffer methods are common image space techniques that use depth testing to handle occlusion.Line Drawing Algorithms - Computer Graphics - Notes
Line Drawing Algorithms - Computer Graphics - NotesOmprakash Chauhan
Ěý
Straight-line drawing algorithms are based on incremental methods.
In incremental method line starts with a straight point, then some fix incrementable is added to current point to get next point on the line and the same has continued all the end of the line.
Back face detection
Back face detectionPooja Dixit
Ěý
Back-Face Detection, Algorithm for right-handed system :,normal vector, the Algorithm for left-handed system :, Limitations :
Clipping
ClippingAMIT VIRAMGAMI
Ěý
This document discusses different techniques for computer graphics clipping. It describes point clipping, line clipping using the Cohen-Sutherland and Liang-Barsky algorithms, area/polygon clipping using the Sutherland-Hodgman and Weiler-Atherton algorithms, curve clipping, and text clipping. Various preliminary tests and intersection calculations are used to identify and remove graphic elements that are outside the clipping region.Overview of the graphics system
Overview of the graphics systemKamal Acharya
Ěý
It contain description about the display technologies, raster and vector scan, hard copy devices and graphics software.Bresenham circle
Bresenham circleTaher Barodawala
Ěý
The document describes Bresenham's circle generation algorithm. It explains that circles have 8-point symmetry that can be exploited to only calculate a quarter circle. It derives the algorithm by interpolating discrete pixels along a small arc and choosing the pixel with minimum error. It determines the initial decision parameter and the recurrence relation to calculate the next decision parameter in the algorithm. The full pseudocode of the algorithm is also provided.Output primitives in Computer Graphics
Output primitives in Computer GraphicsKamal Acharya
Ěý
This slide contain description about the line, circle and ellipse drawing algorithm in computer graphics. It also deals with the filled area primitive.Illumination Models & Shading
Illumination Models & ShadingInternational Institute of Information Technology (I²IT)
Ěý
An illumination model, also called a lighting model and sometimes referred to as a shading model, is used to calculate the intensity of light that we should see at a given point on the surface of an object.Window to viewport transformation
Window to viewport transformationAnkit Garg
Ěý
The document discusses window to viewport transformation. It defines a window as a world coordinate area selected for display and a viewport as a rectangular region of the screen selected for displaying objects. Window to viewport mapping requires transforming coordinates from the window to the viewport. This involves translation, scaling and another translation. Steps include translating the window to the origin, resizing it based on the viewport size, and translating it to the viewport position. An example transforms a sample window to a viewport through these three steps.sutherland- Hodgeman Polygon clipping
sutherland- Hodgeman Polygon clippingArvind Kumar
Ěý
The Sutherland-Hodgman algorithm clips polygons by clipping against each edge of the clipping window in a specific order: left, top, right, bottom. It works by testing each edge of the polygon against the clipping window boundary and either keeping or discarding vertices based on whether they are inside or outside the window. The algorithm results in a clipped polygon that only includes vertices and edge intersections that are inside the clipping window.Video display devices
Video display devicesshalinikarunakaran1
Ěý
The document discusses different types of video display devices, focusing on cathode ray tubes (CRTs). It describes how CRTs work using an electron gun, deflection plates, and phosphor-coated screen to produce images. Color CRT monitors are also covered, explaining how they produce color using either beam penetration or shadow mask methods. Other display types mentioned include direct view storage tubes, flat panel displays, and their key differences from CRTs.
Multimedia
MultimediaMR Z
Ěý
The document provides information about multimedia topics including bit mapped graphics, resolution, greyscale graphics, colour graphics, video files, audio files, and multimedia design skills. It discusses how graphics are represented in memory as pixels and how increasing the number of bits per pixel increases the possible colors. It also provides examples of calculating file sizes for different media types based on resolution, color depth, frame rate, sample rate, and other factors. The key topics covered are how digital images and video are represented and stored, and considerations for multimedia design.More Related Content
What's hot (20)
Raster scan system
Raster scan systemMohd Arif
Ěý
The document describes the components and operation of a raster scan graphics display system. A video controller accesses a frame buffer in system memory to refresh the screen. It performs operations like retrieving pixel intensities from different memory areas and using two frame buffers to allow refreshing one screen while filling the other for animation. A raster scan display processor can digitize graphics into pixel intensities for storage in the frame buffer to offload this processing from the CPU.Hidden surface removal
Hidden surface removalPunyajoy Saha
Ěý
This presentation is about hidden surface removal, which is used in the representation of 3d objects in an image .Cohen sutherland line clipping
Cohen sutherland line clippingMani Kanth
Ěý
The Cohen-Sutherland algorithm divides the plane into 9 regions and uses 4-bit codes to encode whether each endpoint of a line segment is left, right, above, or below the clipping window. It then uses the endpoint codes to either trivially accept or reject the line segment, or perform clipping by calculating the intersection point of the line with the window boundary and replacing the outside endpoint. The main steps are to assign codes to endpoints, AND the codes to check for trivial acceptance or rejection, clip by replacing outside endpoints if needed, and repeating for other line segments.Circle generation algorithm
Circle generation algorithmAnkit Garg
Ěý
The document describes the Breshenham's circle generation algorithm. It explains that the algorithm uses a decision parameter to iteratively select pixels along the circumference of a circle. It provides pseudocode for the algorithm, which initializes x and y values, calculates a decision parameter, and increments x while decrementing y at each step, plotting points based on the decision parameter. An example of applying the algorithm to generate a circle with radius 5 is also provided.Depth Buffer Method
Depth Buffer MethodUmmiya Mohammedi
Ěý
The depth buffer method is used to determine visibility in 3D graphics by testing the depth (z-coordinate) of each surface to determine the closest visible surface. It involves using two buffers - a depth buffer to store the depth values and a frame buffer to store color values. For each pixel, the depth value is calculated and compared to the existing value in the depth buffer, and if closer the color and depth values are updated in the respective buffers. This method is implemented efficiently in hardware and processes surfaces one at a time in any order.2 d viewing computer graphics
2 d viewing computer graphicsKALESHWAR KUMAR
Ěý
The document discusses 2D viewing and clipping techniques in computer graphics. It describes how clipping is used to select only a portion of an image to display by defining a clipping region. It also discusses 2D viewing transformations which involve operations like translation, rotation and scaling to map coordinates from a world coordinate system to a device coordinate system. It specifically describes the Cohen-Sutherland line clipping algorithm which uses region codes to quickly determine if lines are completely inside, outside or intersect the clipping region to optimize the clipping calculation.Computer graphics basic transformation
Computer graphics basic transformationSelvakumar Gna
Ěý
This document discusses 2D geometric transformations including translation, rotation, and scaling. It provides the mathematical definitions and matrix representations for each transformation. Translation moves an object along a straight path, rotation moves it along a circular path, and scaling changes its size. All transformations can be represented by 3x3 matrices using homogeneous coordinates to allow combinations of multiple transformations. The inverse of each transformation matrix is also defined.2D transformation (Computer Graphics)
2D transformation (Computer Graphics)Timbal Mayank
Ěý
with today's advanced technology like photoshop, paint etc. we need to understand some basic concepts like how they are cropping the image , tilt the image etc.
In our presentation you will find basic introduction of 2D transformation.Random scan displays and raster scan displays
Random scan displays and raster scan displaysSomya Bagai
Ěý
Raster scan displays work by sweeping an electron beam across the screen in horizontal lines from top to bottom. As the beam moves, its intensity is turned on and off to illuminate pixels and form an image. The pixel values are stored in and retrieved from a refresh buffer or frame buffer. Random scan displays draw images using geometric primitives like points and lines based on mathematical equations, directing the electron beam only where needed. Raster scans have higher resolution but jagged lines, while random scans produce smooth lines but cannot display complex images. Both use a video controller and frame buffer in memory to control the display process.Visible surface detection in computer graphic
Visible surface detection in computer graphicanku2266
Ěý
Visible surface detection aims to determine which parts of 3D objects are visible and which are obscured. There are two main approaches: object space methods compare objects' positions to determine visibility, while image space methods process surfaces one pixel at a time to determine visibility based on depth. Depth-buffer and A-buffer methods are common image space techniques that use depth testing to handle occlusion.Line Drawing Algorithms - Computer Graphics - Notes
Line Drawing Algorithms - Computer Graphics - NotesOmprakash Chauhan
Ěý
Straight-line drawing algorithms are based on incremental methods.
In incremental method line starts with a straight point, then some fix incrementable is added to current point to get next point on the line and the same has continued all the end of the line.
Back face detection
Back face detectionPooja Dixit
Ěý
Back-Face Detection, Algorithm for right-handed system :,normal vector, the Algorithm for left-handed system :, Limitations :
Clipping
ClippingAMIT VIRAMGAMI
Ěý
This document discusses different techniques for computer graphics clipping. It describes point clipping, line clipping using the Cohen-Sutherland and Liang-Barsky algorithms, area/polygon clipping using the Sutherland-Hodgman and Weiler-Atherton algorithms, curve clipping, and text clipping. Various preliminary tests and intersection calculations are used to identify and remove graphic elements that are outside the clipping region.Overview of the graphics system
Overview of the graphics systemKamal Acharya
Ěý
It contain description about the display technologies, raster and vector scan, hard copy devices and graphics software.Bresenham circle
Bresenham circleTaher Barodawala
Ěý
The document describes Bresenham's circle generation algorithm. It explains that circles have 8-point symmetry that can be exploited to only calculate a quarter circle. It derives the algorithm by interpolating discrete pixels along a small arc and choosing the pixel with minimum error. It determines the initial decision parameter and the recurrence relation to calculate the next decision parameter in the algorithm. The full pseudocode of the algorithm is also provided.Output primitives in Computer Graphics
Output primitives in Computer GraphicsKamal Acharya
Ěý
This slide contain description about the line, circle and ellipse drawing algorithm in computer graphics. It also deals with the filled area primitive.Illumination Models & Shading
Illumination Models & ShadingInternational Institute of Information Technology (I²IT)
Ěý
An illumination model, also called a lighting model and sometimes referred to as a shading model, is used to calculate the intensity of light that we should see at a given point on the surface of an object.Window to viewport transformation
Window to viewport transformationAnkit Garg
Ěý
The document discusses window to viewport transformation. It defines a window as a world coordinate area selected for display and a viewport as a rectangular region of the screen selected for displaying objects. Window to viewport mapping requires transforming coordinates from the window to the viewport. This involves translation, scaling and another translation. Steps include translating the window to the origin, resizing it based on the viewport size, and translating it to the viewport position. An example transforms a sample window to a viewport through these three steps.sutherland- Hodgeman Polygon clipping
sutherland- Hodgeman Polygon clippingArvind Kumar
Ěý
The Sutherland-Hodgman algorithm clips polygons by clipping against each edge of the clipping window in a specific order: left, top, right, bottom. It works by testing each edge of the polygon against the clipping window boundary and either keeping or discarding vertices based on whether they are inside or outside the window. The algorithm results in a clipped polygon that only includes vertices and edge intersections that are inside the clipping window.Video display devices
Video display devicesshalinikarunakaran1
Ěý
The document discusses different types of video display devices, focusing on cathode ray tubes (CRTs). It describes how CRTs work using an electron gun, deflection plates, and phosphor-coated screen to produce images. Color CRT monitors are also covered, explaining how they produce color using either beam penetration or shadow mask methods. Other display types mentioned include direct view storage tubes, flat panel displays, and their key differences from CRTs.Similar to Frame buffer (20)
Multimedia
MultimediaMR Z
Ěý
The document provides information about multimedia topics including bit mapped graphics, resolution, greyscale graphics, colour graphics, video files, audio files, and multimedia design skills. It discusses how graphics are represented in memory as pixels and how increasing the number of bits per pixel increases the possible colors. It also provides examples of calculating file sizes for different media types based on resolution, color depth, frame rate, sample rate, and other factors. The key topics covered are how digital images and video are represented and stored, and considerations for multimedia design.Raster scan systems with video controller and display processor
Raster scan systems with video controller and display processorhemanth kumar
Ěý
The document describes how a raster scan display system works with a video controller. The video controller retrieves intensity values from a frame buffer area of memory and displays them on the screen line by line at a refresh rate of 50 times per second. It uses registers to store pixel coordinates and accesses the frame buffer to display the pixels. For color displays, it uses a lookup table to store RGB values and only needs to access the table index from the frame buffer for each pixel.Introduction to computer graphics 
Introduction to computer graphics Priyodarshini Dhar
Ěý
This document provides an introduction to computer graphics. It defines computer graphics as the creation, storage, and manipulation of pictures and drawings using digital computers. Computer graphics is used across diverse fields such as engineering, medicine, education, entertainment, and more. The document discusses basic terms related to display devices such as pixels, resolution, color depth, and frame buffers. It also describes different types of display devices including raster scan displays, random scan displays, direct view storage tubes, flat panel displays, and stereoscopic displays. Applications of computer graphics such as design, image processing, animation, simulation, and medical imaging are also summarized.SESSION 1.pptx
SESSION 1.pptxkonicha1
Ěý
This document discusses several topics related to computer graphics and digital image processing, including:
1. Computer graphics involves displaying, manipulating, and storing images and data for visualization using a computer. Pixels are the smallest addressable elements that make up an image. Megapixels refer to millions of pixels and are used to describe camera resolution.
2. The CMY and CMYK color models are used to represent colors. CMY uses cyan, magenta, and yellow pigments while CMYK adds black. Lookup tables are used to reduce storage needs by indexing color values instead of directly coding pixel colors.
3. Resolution describes the number of pixels in an image, aspect ratio is the ratio of widthGraphics Primitives and CG Display Devices
Graphics Primitives and CG Display DevicesDIPIKA83
Ěý
Topics Covered:
1. Introduction to computer Graphics
2 Graphics Primitives: Pixel, Resolution, Aspect Ratio, Frame Buffer
3. Display Devices: Monochrome Display Monitor, Color Display Monitor, Raster Graphics Display
4. Applications
Display device
Display deviceGunjanGaur5
Ěý
This document discusses different types of displays including emissive displays like CRTs and LEDs, and non-emissive displays like LCDs. It focuses on describing the components and workings of CRT displays, including the electron gun, phosphor coating, and use of shadow masks for color displays. Key properties of CRTs discussed are phosphor persistence, refresh rate, resolution, and dot pitch. The document also compares vector and raster output scan technologies, and describes the components of a basic raster display system including the frame buffer, video controller, and color look-up table.Unit 1
Unit 1Ankit Garg
Ěý
This document discusses computer graphics systems and their components. It describes common display devices like CRT monitors and how they work. It explains color generation techniques in monitors using beam penetration or shadow mask methods. Input devices for graphics like mice, tablets, and joysticks are also covered. The document provides details on frame buffers, resolution, refresh rates and how raster scan displays redraw images.Crt notes
Crt notesAzad public school
Ěý
The document discusses different types of displays including emissive displays like CRTs and non-emissive displays like LCDs. It then provides details on how CRTs work including the electron gun, deflection coils, and phosphor screen. Key properties of CRTs are described such as resolution, refresh rate, and color reproduction using an electron gun and shadow mask arrangement. Raster scanning is introduced as the process of drawing the image line by line using a frame buffer and video controller. Color mapping with a lookup table is also summarized.Crt notes
Crt notesAzad public school
Ěý
The document discusses different types of displays including emissive displays like CRTs and non-emissive displays like LCDs. It then provides details on how CRTs work including the electron gun, deflection coils, and phosphor screen. Key properties of CRTs are described such as resolution, refresh rate, and color reproduction using an electron gun and shadow mask arrangement. Raster scanning is introduced as the process of drawing the image line by line using a frame buffer and video controller. Color mapping with a lookup table is also summarized.Introduction to computer graphics part 1
Introduction to computer graphics part 1Ankit Garg
Ěý
This document discusses computer graphics systems and their components. It describes video display devices like CRTs and how they work. Color is generated using techniques like beam penetration and shadow masks. Raster scan and random scan displays are covered. Input devices for graphics like mice, tablets, and gloves are also summarized. The document provides details on graphics hardware like frame buffers, refresh rates, and video controllers.Unit i mm_chap3_graphics and image data representation
Unit i mm_chap3_graphics and image data representationEellekwameowusu
Ěý
This document discusses graphics and image file formats. It begins by describing different types of image data, including 1-bit monochrome images, 8-bit grayscale images, and 24-bit color images. It then discusses popular file formats like GIF and JPEG and compression techniques. Algorithms for dithering and reducing color are presented to convert between data types while preserving quality. Key concepts covered include bitplanes, color lookup tables, and the median-cut algorithm for color reduction.new ai techniques.pptx
new ai techniques.pptxSanandMishra
Ěý
This document discusses the basics of computer graphics. It outlines the advantages of computer graphics such as producing high quality images and animation. It also classifies computer graphics systems as either interactive or passive. Interactive systems allow two-way communication between the user and computer while passive systems do not. The document then discusses pixels, color depth, frame buffers, and monitors. It concludes by outlining major areas of computer graphics like display of information, design/modeling, simulation, and user interfaces.Introduction to computer graphics part 2
Introduction to computer graphics part 2Ankit Garg
Ěý
This document discusses cathode ray tubes (CRTs) and how they work as display devices for computer graphics. It explains that CRTs contain an electron gun that emits a stream of electrons which are focused into a beam and directed to specific points on the phosphor-coated front of the picture tube. When the electron beam hits a phosphor dot, it glows proportionally to the beam strength. Color CRTs use three electron guns and a shadow mask to separately excite red, green, and blue phosphor dots, allowing for color displays. The document also covers other properties of CRTs like resolution, persistence, and aspect ratio.Multimedia graphics and image data representation
Multimedia graphics and image data representationMazin Alwaaly
Ěý
Multimedia graphics and image data representation seminar
Mustansiriya University
Department of Education
Computer SciencePrinsip gambar digital
Prinsip gambar digitalOno Trader
Ěý
This document discusses digital images and image processing. It covers several key topics:
1. Digital images are composed of pixels that can be represented in grayscale or RGB color. Higher bit depths allow for more colors or shades.
2. Image processing systems involve hardware, software, procedures, and people working together to explore digital images. Common hardware includes scanners, cameras, printers and monitors.
3. There are two main types of digital images - bitmapped (raster) images composed of pixels in a grid, and vector images defined by geometric shapes. Both have advantages for different types of images.attribute.pptx
attribute.pptxSathishShetty13
Ěý
This document discusses various attributes that control the appearance of output primitives like lines, curves, areas, and characters in computer graphics. It describes parameters for setting line width, color, and style. Methods for displaying thick lines and smoothly joined lines are presented. Options for filling areas with solid colors or patterns are introduced. Finally, attributes for controlling font, size, color, and orientation of displayed text are covered.Multimedia communication jpeg
Multimedia communication jpegDr. Kapil Gupta
Ěý
This document provides an overview of JPEG image compression. It discusses how digitized images require large amounts of memory and bandwidth. The JPEG standard was developed to address this by compressing images lossily. The main stages of JPEG compression are:
1. Dividing images into 8x8 pixel blocks and applying the discrete cosine transform (DCT) to each block.
2. Quantizing the DCT coefficients, discarding higher frequency coefficients below a threshold.
3. Entropy encoding the coefficients using techniques like run-length encoding and Huffman coding.
4. Assembling the encoded image into a JPEG bitstream with headers describing the encoding process.Chapter 3 data representations
Chapter 3 data representationsABDUmomo
Ěý
This chapter discusses various graphics and image file formats, including bitmap, JPEG, and GIF formats. It also covers basic image types such as 1-bit black and white images and 8-bit grayscale images. Color images can be stored as 24-bit RGB images or 8-bit color images using a color lookup table. The chapter also introduces digital audio concepts and the Musical Instrument Digital Interface (MIDI) standard for controlling electronic musical instruments.Unit i
Unit iposhika
Ěý
The document summarizes key differences between vector scan and raster scan displays. Vector scan displays directly draw lines between points by moving the electron beam between endpoints, while raster scan displays sweep the beam across the entire screen in lines from top to bottom. Raster scan is more common as it does not flicker even with complex images and has lower cost and hardware requirements than vector scan. Both methods store images in a frame buffer but raster scan must convert graphics to pixels while vector scan does not.Recently uploaded (20)
Responsible Use of Research Metrics Module Launch
Responsible Use of Research Metrics Module Launchdri_ireland
Ěý
Presentation by Dr Michelle Doran, National Open research Coordinator of the National Open Research Forum at the official launch of the Responsible Use of Research Metrics Module on 31 March 2025, at the Museum of Literature Ireland.
GNU Linux - Introduction and Administration.
GNU Linux - Introduction and Administration.Xavier de Pedro
Ěý
şÝşÝߣs for the course on GNU Linux - Introduction and Administration. At UB Postgraduate course on Data Science. (2025 Edition).physiology of endocrine system ;pancreas
physiology of endocrine system ;pancreasdina merzeban
Ěý
"This comprehensive PowerPoint presentation provides a detailed overview of the physiology of the endocrine system. Explore the intricate network of glands, hormones, and their target tissues that regulate essential bodily functions. Learn about the mechanisms of hormone action, including receptor binding and signal transduction. Discover the roles of major endocrine glands like the pituitary, thyroid, adrenal, and pancreas in maintaining homeostasis. This presentation is ideal for students, educators, and healthcare professionals seeking a clear and concise understanding of endocrine physiology. Key topics covered include:
* Hormone classification and synthesis
* Feedback mechanisms and regulation
* Specific gland functions and associated hormones
* Common endocrine disorders and their physiological basis
* Clinical correlations and applications
Whether you're preparing for an exam, teaching a class, or simply interested in the fascinating world of endocrinology, this PowerPoint offers a valuable resource for mastering the core principles of endocrine physiology."
1-ANATOMY-2022-INTRODUCTION.pptx and chapter 3
1-ANATOMY-2022-INTRODUCTION.pptx and chapter 3guilynharayo
Ěý
Anatomy and Physiology chapters one and threeForensic analysis of the 2012 Aurora theatre mass shootings, Colorado
Forensic analysis of the 2012 Aurora theatre mass shootings, Coloradohosangnmims
Ěý
On July 20, 2012, during a midnight screening of The Dark Knight Rises at the Century 16 movie theater in Aurora, Colorado, a mass shooting occurred that shocked the nation. James Holmes, a former neuroscience graduate student, entered the theater armed with multiple weapons and opened fire, killing 12 people and injuring 70 others. This horrific event is not only significant due to its scale but also for the extensive forensic investigation and legal proceedings that followed.
The Aurora theater shooting serves as a case study in modern forensic science due to its multidisciplinary investigation. From crime scene processing and ballistics analysis to psychological profiling and courtroom testimony, this incident highlights how various forensic techniques converge to identify perpetrators, uncover motives, and deliver justice.
Aerospace_Quiz_Complete.pptx tehbuagiegige
Aerospace_Quiz_Complete.pptx tehbuagiegigeamuthesh6
Ěý
An **Aerospace Quiz** is a structured set of questions designed to test knowledge and understanding of topics related to aerospace engineering, aviation, and space exploration. It can be used for educational purposes, competitions, or general knowledge enhancement.
### **Topics Covered in an Aerospace Quiz**
Aerospace quizzes can include a broad range of topics, including:
#### **1. Aerodynamics and Fluid Mechanics**
- Principles of lift, drag, thrust, and weight
- Bernoulli’s theorem and airflow over wings
- Boundary layers and turbulence
- Supersonic and hypersonic flow
#### **2. Aircraft Structures and Materials**
- Types of aircraft structures (monocoque, semi-monocoque, truss)
- Aerospace materials (aluminum alloys, composites, titanium)
- Stress and strain analysis in aircraft design
#### **3. Propulsion Systems**
- Types of aircraft engines (turbojet, turbofan, turboprop, piston engines)
- Rocket propulsion principles
- Jet engine components and their functions
#### **4. Avionics and Control Systems**
- Flight control surfaces (ailerons, elevators, rudders)
- Instrumentation and navigation systems
- Autopilot and fly-by-wire technology
#### **5. Spacecraft and Satellite Engineering**
- Orbital mechanics and Kepler’s laws
- Types of satellites and their applications
- Space propulsion (ion thrusters, chemical rockets)
#### **6. Aerospace History and Milestones**
- Wright brothers' first flight
- Apollo missions and moon landings
- Development of supersonic and hypersonic aircraft
#### **7. Aerospace Companies and Innovations**
- NASA, SpaceX, Boeing, Airbus, Lockheed Martin
- Commercial space tourism and reusable rockets
- Future of aerospace (electric planes, Mars missions)
### **Types of Questions in an Aerospace Quiz**
Aerospace quizzes can include different types of questions, such as:
- **Multiple Choice Questions (MCQs):**
*Example:* What is the primary function of an aircraft’s rudder?
a) Control pitch
b) Control yaw
c) Control roll
d) Reduce drag
*(Correct Answer: b) Control yaw)*
- **True or False:**
*Example:* The speed of sound is higher at higher altitudes. *(False, because air density decreases, reducing the speed of sound.)*
- **Fill in the Blanks:**
*Example:* The first human to walk on the Moon was _____. *(Answer: Neil Armstrong)*
- **Descriptive Questions:**
*Example:* Explain the working principle of a turbofan engine.
### **Why Take an Aerospace Quiz?**
- **Educational Value:** Helps reinforce key aerospace concepts.
- **Skill Assessment:** Tests knowledge of aviation and space technology.
- **Career Preparation:** Useful for students pursuing aerospace engineering or pilot training.
- **Fun and Engaging:** Encourages learning through a competitive and interactive approach.
Would you like me to create a set of aerospace quiz questions for you? 🚀Mutation and its types (Point, Silent, Mis sense and Non sense mutations)
Mutation and its types (Point, Silent, Mis sense and Non sense mutations)Anoja Kurian
Ěý
A mutation is a change in the DNA sequence of an organism, which can be caused by errors during DNA replication, exposure to mutagens, or viral infections. These changes can be inherited (germline mutations) or occur in body cells (somatic mutations). Actinobacterium Producing Antimicrobials Against Drug-Resistant Bacteria
Actinobacterium Producing Antimicrobials Against Drug-Resistant BacteriaAbdulmajid Almasabi
Ěý
discuss a published study on Streptomyces
antimicrobicus sp. nov., a novel actinobacterium isolated from clay soil in a paddy field in Thailand. The study explores its antimicrobial activity against drug-resistant bacteria.MUTATION AND GENETIC DRIFT &NATURAL SELECTION
MUTATION AND GENETIC DRIFT &NATURAL SELECTIONnilahefx
Ěý
This topic is related to Biology (Population Genetic s) Combination of the genetic. 

Isotopes-Chemistry-Presentation-in-a-Fun-Colorful-Style.pptx
Isotopes-Chemistry-Presentation-in-a-Fun-Colorful-Style.pptxNarcisoJimenezlll
Ěý
A brief explanation of the isotopesFULL LECTURE ON BODY FLUIDS BY DR DANIEL.ppt
FULL LECTURE ON BODY FLUIDS BY DR DANIEL.pptbaffourprince2016
Ěý
FULL LECTURE ON BODY FLUIDS BY DR DANIEL.ppt
IMMUNOMODULATORS: IMMUNOSTIMULATION AND IMMUNOSUPPRESSION .pptx
IMMUNOMODULATORS: IMMUNOSTIMULATION AND IMMUNOSUPPRESSION .pptxkarishmaduhijod1
Ěý
Immunomodulators are natural or synthetic substances that help to regulate or normalize the immune system.


Frame buffer
- 1. Frame Buffer Presented by Asst. Prof. Aparna Joshi
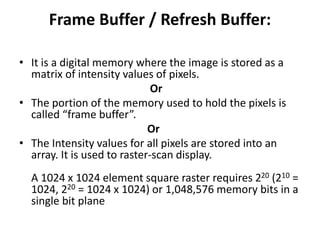
- 2. Frame Buffer / Refresh Buffer: • It is a digital memory where the image is stored as a matrix of intensity values of pixels. Or • The portion of the memory used to hold the pixels is called “frame buffer”. Or • The Intensity values for all pixels are stored into an array. It is used to raster-scan display. A 1024 x 1024 element square raster requires 220 (210 = 1024, 220 = 1024 x 1024) or 1,048,576 memory bits in a single bit plane
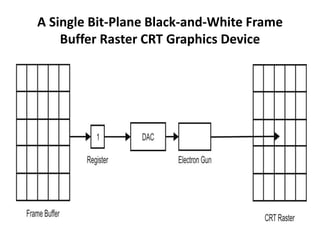
- 3. Digital-to-Analog (DAC) Converter • The frame-buffer is a digital device, while CRT is an analog device, conversion from a digital representation to an analog signal must take place when information is read from the frame buffer and displayed on the raster CRT graphics device. This is accomplished by a digital-to-analog converter (DAC). • Each pixel in the frame buffer must be accessed and converted by DAC before it is visible on the raster CRT.
- 4. A Single Bit-Plane Black-and-White Frame Buffer Raster CRT Graphics Device
- 5. N-Bit-Plane Gray Level Frame Buffer Color or gray levels are incorporated into a frame-buffer raster graphics device by using additional bit planes. Following Fig. schematically shows an N-bit-plane gray level frame buffer.
- 6. An N Bit Plane Gray Level Frame Buffer with W-bit Wide Lookup Table • An increase in the number of available intensity levels is achieved for a modest increase in required memory by using a lookup table, as shown in following fig.
- 7. • Upon reading the bit-planes in the frame buffer, the resulting number is used as an index into lookup table. • The lookup table must contain 2N entries. Each entry in the lookup table is W-bit wide. W may be greater than N. When this occurs, 2W intensities are available, but only 2N different intensities are available at one time. • To get additional intensities, the lookup table must be changed (reloaded).
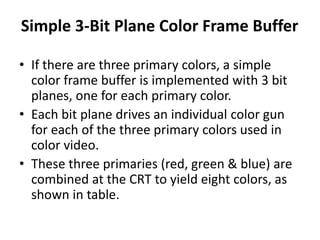
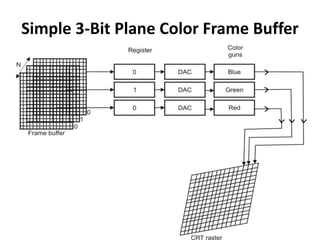
- 8. Simple 3-Bit Plane Color Frame Buffer • If there are three primary colors, a simple color frame buffer is implemented with 3 bit planes, one for each primary color. • Each bit plane drives an individual color gun for each of the three primary colors used in color video. • These three primaries (red, green & blue) are combined at the CRT to yield eight colors, as shown in table.
- 9. Red Green Blue Color 0 0 0 Black 0 0 1 Blue 0 1 0 Green 0 1 1 Cyan 1 0 0 Red 1 0 1 Magenta 1 1 0 Yellow 1 1 1 White
- 10. Simple 3-Bit Plane Color Frame Buffer
- 11. A 24 Bit-plane Color Frame Buffer • Additional bit planes can be used for each of the three color guns. • A schematic of a multiple-bit-plane color frame buffer, with 8 – bit planes per color, i.e. a 24-bit-plane frame buffer as shown in fig.
- 12. A 24 Bit-plane Color Frame Buffer
- 13. Thank You