From discourse to diagrams: research project on academic staffs digital literacies
Download as PPTX, PDF1 like401 views

A presentation that demonstrates the use of diagrams across all stages of a research project at the University of Liverpool. The research explored academic staffs perspectives of and practices in digital literacies.


More Related Content
Similar to From discourse to diagrams: research project on academic staffs digital literacies (20)
Recently uploaded (20)


From discourse to diagrams: research project on academic staffs digital literacies
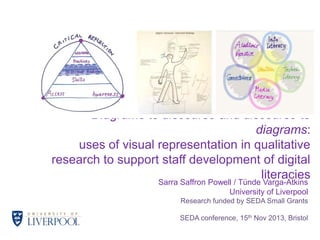
- 1. Diagrams to discourse and discourse to diagrams: uses of visual representation in qualitative research to support staff development of digital literacies Sarra Saffron Powell / T├╝nde Varga-Atkins University of Liverpool Research funded by SEDA Small Grants SEDA conference, 15th Nov 2013, Bristol
- 3. During this session: ŌĆó Are diagrams (or other visual representations) viable tools to use in your own practice? ŌĆó What are the merits and limitations of visual approaches in supporting your critical reflection on your own perceptions and practices? Powell&Varga-Atkins 15 Nov 2013 SEDA
- 4. Background ŌĆó SEDA small grants research funding ŌĆó Full report available: Powell&Varga-Atkins 15 Nov 2013 SEDA
- 5. What was done? Explored academic staffŌƤs: ŌĆō practices in digital literacies, staff interviews and surveys ŌĆō perspectives of those practices within a discipline specific context. ŌĆō individual and institutional enablers and constraints ŌĆō explored the role of critical reflection in relation to developing digital literacies. Powell&Varga-Atkins 15 Nov 2013 SEDA
- 6. Why was it done? ŌĆó To understand: ŌĆō how digital practices emerge; ŌĆō to understand what staff are already doing; ŌĆō to find out what the university could do to help support staff in enhancing studentsŌƤ development of digital literacies. ŌĆō the role of critical reflection in the development of digital literacies ŌĆó To promote the digital literacies agenda and improve the student experience Powell&Varga-Atkins 15 Nov 2013 SEDA
- 7. Defining digital literacies functional competence (externus) and capability (internus) flexible confident agile adopter capable critically reflective Powell&Varga-Atkins 15 Nov 2013 SEDA
- 8. Why visuals (diagrams)? Powell&Varga-Atkins 15 Nov 2013 SEDA
- 9. The value of diagrams ŌĆ£A diagram is a visual representation that shares the properties of written text and representational images, but cannot be reduced to eitherŌĆØ (Blackwell, 2001, p.1). http://cas.uchicago.edu/workshops/earlymodernphil/fi les/2013/04/descartesoptics.jpg Powell&Varga-Atkins 15 Nov 2013 SEDA
- 10. Not just 1000 words: new insights Harper (2002) Pic credit: Wikipedia: HikingArtist Powell&Varga-Atkins Varga-Atkins & OŌƤBrien (2009) 15 Nov 2013 SEDA
- 11. Mmm, useful ŌĆ”visual modalities, unbound by the linearity of text (Land, 2011), are especially suited to explore both selfŌĆōperception and practices, whilst depicting the multimodal, multi-directional complexities of those practices in context of developing digital literacies. Credit: Adeen Flinker, UC Berkeley Powell&Varga-Atkins 15 Nov 2013 SEDA
- 12. Let us take you through each stage in our research cycle Powell&Varga-Atkins 15 Nov 2013 SEDA
- 13. Use of diagrams
- 14. The big challenge ŌĆó Not to pre-empt responses ŌĆó We wanted participants to volunteer where they engaged with technology http://rob-colvin-art.tumblr.com/post/61121517694/the-bigchallenge-by-rob-colvin-acrylic-and Powell&Varga-Atkins 15 Nov 2013 SEDA
- 15. Use of diagrams
- 16. Participatory diagramming (a ŌĆ£rebusŌĆØ) Start Solution We posed a learning and teaching ŌĆ×problemŌƤ and asked staff to chart the their approaches and activities to reach a solution Challenges: varying comfort levels and a feeling of being ŌĆ£under preparedŌĆØ (Umoquit et al 2008). Powell&Varga-Atkins 15 Nov 2013 SEDA
- 17. Paired Activity Powell&Varga-Atkins 15 Nov 2013 SEDA
- 18. Paired Activity. Take 2-3 stickers. Interview your pair about their use of these selected technologies. When do you use these technologies and how? Observe the questions below and be ready to feed back about your experience as interviewer/interviewee. Interviewer How helpful is the visual task in getting your ŌĆśdataŌĆÖ? To what extent is the structure offered by the diagram help or hinder? Interviewee How helpful is the visual task in helping you formulate your thinking? To what extent is the structure offered by the diagram help or hinder?
- 19. Diagrammatic elicitation can be participant- or researcher-led (Umoquit et al 2013); = A more practices realistic representation of academic staffŌƤs range of digital Powell&Varga-Atkins 15 Nov 2013 SEDA
- 20. Diagrams to elicit discourse Triggers: Visuals/diagrams can elicit ideas that may otherwise remain unarticulated and promote general discussion. (Gaskell, 2000 in Crilly et al 2006) Powell&Varga-Atkins 15 Nov 2013 SEDA
- 21. Dilemma of Diagramming: balance between openness and structure use aware but not use tried and rejected Powell&Varga-Atkins 15 Nov 2013 SEDA
- 22. Use of diagrams Powell&Varga-Atkins 15 Nov 2013 SEDA
- 23. Using diagrams to interrogate discourse Powell&Varga-Atkins 15 Nov 2013 SEDA
- 24. Diagrams for analysis and discussion Initial reflections on data analysis Diagrammatic discussions Powell&Varga-Atkins 15 Nov 2013 SEDA
- 25. Use of diagrams Powell&Varga-Atkins 15 Nov 2013 SEDA
- 26. From analysis moving to reporting findings The resulting profile emergen t
- 27. and more diagramsŌĆ” consciou s Sharpe and Beetham (2010) Powell&Varga-Atkins 15 Nov 2013 SEDA
- 28. ŌĆ” leading to framework development Powell&Varga-Atkins 15 Nov 2013 SEDA
- 29. Use of diagrams
- 30. Dissemination ŌĆō from charts to ŌĆ” Powell&Varga-Atkins
- 31. to ŌĆ”infographics I see the relevance Training & evidence I see it as my role 6 Need training? 0 They are ok! 5 21 8 Point to evidence about embedded practices; example definitions and embedded practices in a disciplinary context 0 0 I have the capabilities Powell&Varga-Atkins 2 ?? Excluding non-academic staff and missing responses, n=54
- 32. Reflecting on our use of visuals, they were: conscious natural necessary emergent see pic credits in Powell&Varga-Atkins 15 Nov 2013 SEDA
- 33. Discussion Discussion ŌĆó Questions ŌĆó Can diagrams (or other visual representations) be suitable tools to use in your own practice? ŌĆó What are the merits and limitations of visual approaches in supporting your critical reflection on your own perceptions and practices? Powell&Varga-Atkins 15 Nov 2013 SEDA
- 34. Diagrams Conclusion Benefits Challeng es & limitation s D i s c o u r s e Powell&Varga-Atkins 15 Nov 2013 SEDA
- 35. Graphic > < Digital Powell&Varga-Atkins 15 Nov 2013 SEDA
- 36. References Beetham, H and Sharpe, R (2011) Learning literacy development framework (JISC workshop material) Crilly N., Blackwell A. F., Clarkson P. J., (2006) Graphic elicitation: using research diagrams as interview stimuli. Qualitative Research, 6(3) 341-66. Harper, D. 2002. Talking about pictures: A case for photo elicitation. Visual Studies 17, no. 1:13ŌĆō26. Land R., (2011) Speed and the Unsettling of Knowledge in the Digital University, Digital Difference, (series Educational Futures Rethinking Theory and Practice) (50) 61-70 Powell, S. S.; Varga-Atkins, T. (2013) ŌĆ×Digital Literacies: A Study of Perspectives and Practices of Academic StaffŌƤ: a project report. Written for the SEDA Small Grants Scheme. Liverpool: University of Liverpool. July. Version 1. Powell S. S., Varga-Atkins, T. (2013) ŌĆ×Using visual metaphors to promote critical reflection on digital practices and perspectivesŌƤ: Workshop Guidance Umoquit, M., Tso, P., Varga-Atkins, T., OŌƤBrien, M., & Wheeldon, J. (2013). Diagrammatic Elicitation: Defining the Use of Diagrams in Data Collection. The Qualitative Report, 18(60), 1ŌĆō12. Varga-Atkins, T and O'Brien M. (2009) From drawings to diagrams: maintaining researcher control during graphic elicitation in qualitative interviews. International Journal of Research and Method in Education, vol. 32(1), April,53-67 Powell&Varga-Atkins 15 Nov 2013 SEDA
- 37. Image credits ŌĆó Emergent = waves by Reza Ali ŌĆō http://www.syedrezaali.com/blog/?p=1214 ŌĆó Natural = a forest = http://www.layoutsparks.com/1/213309/greenforest-natural-road.html ŌĆó Conscious: ŌĆ£The mind of Mr SoamesŌĆØ http://controlv.deviantart.com/art/The-Mind-of-Mr-Soames268423113 ŌĆó Necessary: fractal art http://steell.deviantart.com/art/Complexity18857076 Powell&Varga-Atkins 15 Nov 2013 SEDA
- 38. Contact Sarra Saffron Powell sarrasaf@liv.ac.uk Tunde Varga-Atkins @tundeva tva@liv.ac.uk Powell&Varga-Atkins 15 Nov 2013 SEDA
Editor's Notes
- #2: Need to reference strategy
- #3: sarraIn this session we demonstrate the ways in which we used visualrepresentation (diagrams) in our educational developer work as researchers in all stages of our research cycle to:Elicit data during interviews;Analyse interview data;Report writing; Disseminating research findings.As well as to communicate ideas between us.From discourse to diagrams, diagrams to discourseWill explain how we use the terms DLs and diagrams in a bit
- #4: sarra
- #5: Add web linksara
- #6: s
- #7: s
- #8: Meet the demands of living in a technological age ŌĆō look at a modelk of this later
- #9: t
- #10: tAs a research tool, seemed to offer more bang for your buck
- #11: TundeWhy visuals? (Harper,=new insight self-REF)=1000 wordsPrevious research experience and practice
- #12: sParticular relationship between digital literacies and visual modalities
- #13: s
- #14: s
- #15: sThere is an interpretive flexibility with visual stimulus that is not afforded by language
- #16: sData collection- how we used diagrams in our data collection stageOn
- #17: sThiswas, clearly, limited and linear ŌĆō many staff took a multi-directional approach to solving problems that wasnŌĆÖt captured by this simplistic line. We realised we didnŌĆÖt want to limit our focus to just teaching activities but wanted to capture a wider range of staff activities. Participants also had varying levels of comfort in terms of sketching their approaches and there was a clear sense that the limitations of an interview setting, made them feel unprepared for the task.(tva:I also think the discomfort came from the fact that they werenŌĆÖt sure where the technological was meant to come in- as if we had a hidden agendaŌĆ”they werenŌĆÖt sure how to ŌĆśplease usŌĆÖ as interviewers)
- #18: TundeVisual aid encourages dialogue and/or a reaction; We then developed this ŌĆō a form of diagrammatic elicitation of data which reflected the complexity of academic staffŌĆÖs activities more realistically ŌĆō we devised stickers to aid the interview process and where staff mentioned use of technology, we asked them to place stickers in the relevant categories according to their activities.
- #19: T
- #20: TundeVisual aid encourages dialogue and/or a reaction; We then developed this ŌĆō a form of diagrammatic elicitation of data which reflected the complexity of academic staffŌĆÖs activities more realistically ŌĆō we devised stickers to aid the interview process and where staff mentioned use of technology, we asked them to place stickers in the relevant categories according to their activities.
- #21: tMore important is what they say and how they say itDiagram/stickers just a trigger. But discourse is the centre of our analysis!
- #22: Tunde Stickers allowed us to see that new categories emerged(because they were visual, it was obvious)We then adapted the instrument for our Phase 2 interviews
- #23: sMoving on to Analysis
- #24: This was the natural aspect of our visual analysis ŌĆō and helped us interrogate a large amount of data.
- #25: sAs was communicating our ideas to each other
- #26: TMoving on to ReportingWe will show you some of our findingsAnd how the use of diagrams were in a sense our summaries Of our findings in this piece of research.
- #27: TWe drew the ŌĆśprofileŌĆÖ of each of our intervieweeand attributed what they said about digital literacies to each part.As you see the layers of awareness, rejection, use Have made it to the profiles (our findings from the sticker task)Attitude , awareness and critical reflection were central.
- #28: Tunde Here we used the pyramid diagram model from Sharpe and BeethamAnd again mapped the def-s of DLs that staff gave against the layersWe found a new layer: something between skills/practicesAgain adv of visual: that it is obvious to show this
- #29: TundeThis diagram encapsulates quite a few of aspects our findingsAdoption and taking further the diagram by Beetham and Sharpe (2010)Discovery of a layer of skills & practicesAdding critical reflection, access and awareness
- #30: Now we will discuss how have gone about Thinking about dissemination (and using visualsThink back to the image on an image is 1000words!)
- #31: This is the sort of typical output you may have in a researchChart with commentaryWonŌĆÖt go into detailBut questions were on different attitudes to relevance, capabilities to DL
- #32: TundeHere is something we have come up with instead,We are trying to create more of a narrative (discourse and diagrams together) encapsulated as an infographicsHere we were trying to put the 4 bar charts into a coherent imageTrying to figure out which group is the one we should tackle as ŌĆśeddeversŌĆÖNot saying the infographics is perfect!!!Experimenting with a way that would lead to effective communication
- #33: sDecisive (eliciting data)Emergent (interview analysis)Natural (our primary modus operandi as individuals)Necessary (to move beyond the linearity of text and reflect subtle and complex realities)Pic credits to go into ReferencesReza ali ŌĆō emergent http://www.syedrezaali.com/blog/?p=1214Forest = http://www.layoutsparks.com/1/213309/green-forest-natural-road.htmlConscious: the mind of Mr Soameshttp://controlv.deviantart.com/art/The-Mind-of-Mr-Soames-268423113Necessary: fractal arthttp://steell.deviantart.com/art/Complexity-18857076
- #34: S t
- #35: T
- #36: Tunde Here definitions of digital literacieswere collected.(Using a diagram /petals from other projects, we adapted them slightly)Numbers: def-s in the partic categoryWhat this demonstrates (to oru staff)Is that DLs are not just functional skill sets but beyond, encompassingIdentities (nothing new in terms of findings but nice way to demonstrate it to staff, our audience)
- #37: I need to finish this