From testing to quality governance and problem resolution.pdf

The document discusses the Catalan government's efforts to improve quality governance and problem resolution for its information and communication technology (ICT) systems. It oversaw the centralization of ICT budget and management through CTTI to increase efficiency. CTTI implemented a new ICT model and quality governance framework to comply with goals of cost reduction, standardization, and externalization. This included classifying applications by risk to tailor quality activities, implementing tools for testing and monitoring, and creating task forces to diagnose and resolve difficult problems by bringing together developers, quality analysts, and operations teams. Continuous improvement efforts focused on learning from experience and balancing quality activities according to risk.


From testing to quality governance and problem resolution.pdf
- 1. From testing to quality governance and problem resolution CTTI (Centre de Telecomunicacions i Tecnologies de la Informaci¨®) ¨C Generalitat de Catalunya
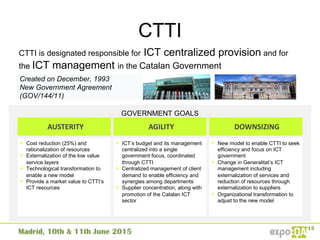
- 2. CTTI Created on December, 1993 New Government Agreement (GOV/144/11) CTTI is designated responsible for ICT centralized provision and for the ICT management in the Catalan Government GOVERNMENT GOALS DOWNSIZING AUSTERITY AGILITY ˇě ICTˇŻs budget and its management centralized into a single government focus, coordinated through CTTI ˇě Centralized management of client demand to enable efficiency and synergies among departments ˇě Supplier concentration, along with promotion of the Catalan ICT sector ˇě New model to enable CTTI to seek efficiency and focus on ICT government ˇě Change in GeneralitatˇŻs ICT management including externalization of services and reduction of resources through externalization to suppliers ˇě Organizational transformation to adjust to the new model ˇě Cost reduction (25%) and rationalization of resources ˇě Externalization of the low value service layers ˇě Technological transformation to enable a new model ˇě Provide a market value to CTTIˇŻs ICT resources
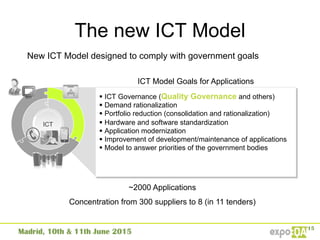
- 3. The new ICT Model ˇě ICT Governance (Quality Governance and others) ˇě Demand rationalization ˇě Portfolio reduction (consolidation and rationalization) ˇě Hardware and software standardization ˇě Application modernization ˇě Improvement of development/maintenance of applications ˇě Model to answer priorities of the government bodies ICT New ICT Model designed to comply with government goals ~2000 Applications Concentration from 300 suppliers to 8 (in 11 tenders) ICT Model Goals for Applications
- 4. Quality scenario Visibility Lack of metrics Decentralization of deliverables The what, but not the how Standards Quality as a barrier Vendor testing responsibility Organization With ICT Goals and new organization ItˇŻs time to setˇ Policies and standards Support systems and tools to Governance model
- 5. Quality governance pillars Target on more risky applications Help government bodies to manage their quality Quality model Simple and practical, with tools Result oriented Demonstrate with facts the quality improvement
- 6. Quality model framework ? Reference framework for the organization ? Procedures, instructions, templates, standards and guides ? Public access qualitat.solucions.gencat.cat
- 7. Tools in quality scope Review Plan, design and execution Performance testing Functional testing Quality management Code reviews Automation for several protocols (Web, SAP, ...) Record and replay Tests and requirements (for traceability) Test specification Test results and defects Static analysis (ISO 9126-25000) Action plans Automation Specific test execution HP UFT Performance testing Test scenarios Load generators Timeframes Bottleneck diagnostics Mobility testing HP VUgen Real compatibility testing HP PC (SaaS) HP Diagnostics PerfectoMobile HP QC/ALM CAST AIP 7.149 Requirements 27.813 Test executions 47 MLOCs reviewed 15.410 Tests 9.192 Defects 891 Performance tests executed (last quarter)
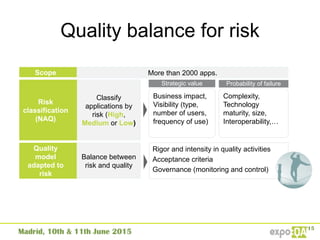
- 8. Quality balance for risk Classify applications by risk (High, Medium or Low) Business impact, Visibility (type, number of users, frequency of use) Strategic value Complexity, Technology maturity, size, Interoperability,ˇ Scope More than 2000 apps. Risk classification (NAQ) Probability of failure Quality model adapted to risk Balance between risk and quality Rigor and intensity in quality activities Acceptance criteria Governance (monitoring and control)
- 9. Quality scope by risk Task/ Risk (NAQ) High Medium Low Test strategy Risk analysis testing Broad testing Optional risk analysis testing. Testing that exercises most interesting conditions Without risk analysis testing. Minimal testing Traceability between requirements and test cases High recommended Recommended Optional Script definition (steps) YES YES NO Regression testing Every major and minor releases. Justify every time if not executed in minor versions. Major releases Optional, depending on impact Test automation Prepare an analysis of cost/benefit. High automation Partial automation Minimal automation Acceptance testing support YES OPTIONAL OPTIONAL Source code review New projects: At 20% of construction, and before first deployment on preproduction environment Current projects: First review Quarterly review frequency New projects: At 20% of construction, and before first deployment on preproduction environment Current projects: OPTIONAL Frequency of review to be agreed NO
- 10. Quality governance Sort applications by corrective hours per year Worse in class 25 applications sum up: 40% corrective hours 70% corrective tickets Some projects need to be monitored New strategic projects Define scope with each government body
- 11. Quality profile by application Character. Import. %Measured Quality Functionality High 0% Very good Availability Medium 80% Very bad Performance High 40% Medium Operability Low 0% Bad Security Low 40% Good Compatibility Medium 0% Medium Maintainability High 50% Very bad Portability Medium 0% Very good Deliverable Compl Quality Plan Yes Good Requirements Yes Very bad Functional Analysis No Very good Technical Design Yes Good Source code No Very bad Testing No Bad Setup install No Good Manuals No Good Quality of application Quality evaluation with questionnaire and metrics Prioritize improvements according to importance and risk Quality of deliverables Review standards compliance and quality of deliverables With checklists ? Source code quality ? Availability metrics ? Defect density ? Test results (failed tests, response time, ...) Each characteristic is rated subjectively and objectively
- 12. Quality questionnaire Characteristic Goal Import. Subcharacteristic Questions Score (1-5) Risks (avoid positive comments on quality, only report risks on characteristic) ... ... ... ... ˇ ... ... Reliability The system does not fail, react properly to unexpected situations and has few incidents / defects Very high Availability Often the system or part of it fails or remains in a state that no answers? (consider the frequency and duration of downtime) 1 Every day system fails down fifteen minutes at 13:00 oˇŻclock Maturity There are many incidents or defects in the application? 3 Fault tolerance The system reacts appropriately to any failure, capturing it, making their treatment and informing the user and others involved (sending emails, probes, by screen messages, etc.)? 4 Performance The resources used are appropriate and the response time is good Very high Time behaviour The response time of the solution are good ? If a transaction is slow the system provides information to the user that it will last some time? Functions are treated in batch if they spent a lot of time? 4 ... ... ... ... ... ... ... Based on ISO 9126/ISO 25000
- 13. Quality evaluation and metrics Quality profile scores from questionnaire, experts and metrics Availability and performance Maintainability and security Quality profile Previous Actual Date GLOBAL Date Functionality Availability Performance Usability Security Interoperab. Maintainability Portability GLOBAL Increase 05/14 2,00 01/15 4 3 2 3 3 4 2 3 3,00 1,00
- 14. Improvement plans Quality has to be followed by improvement Date 2013/12 2015/12 R5 - 2014 Quality health First Snapshot Goal/Planning Real v.1.0.0 Metric Metric % Technical quality index (TQI) 3,01 3,34 3,11 3% Performance 2,74 3,11 2,76 0,73% Robustness 3,18 3,48 3,2 0,63% Security 3,37 3,88 3,39 0,59% Transferability 2,39 2,75 2,72 13,81% Changeability 3,15 3,29 3,29 4,4% Critical defects 15.278 1.163 17.476 Make realistic plans Follow up improvements Re-evaluate questionnaires
- 15. How are we improving? Better perception by customer representatives Better process Incidents decrease More effort can be spent in evolution than corrective actions Better deliverables
- 16. Problem resolution ? Sometimes applications fail ? Vendors says everything is fine by his side ? Mostly availability and performance problems ? Very difficult to find and reproduce (sometimes occasional) 16 Task force created between vendors and CTTI Quality Office Same physical location
- 17. Our pathˇ Our path ˇ to diagnosis and resolution of problems Implement ? Implementation of changes ? Verify Agree and communicate ? Lessons learned ? Finding reporting ? Corrective action planning Analysis and evaluation ? Root cause analysis ? Test temporary corrective actions Investigation ? Neutral facts to reproduce the problem Preparation ? Test case definition or exploratory testing ? Automate if required ? Test environment preparation Share knowledge between development team and quality team to find root causes, but also, to improve application!
- 18. Calm after the storm ? Hard days (more problems arise) ? Average on 60% of time to reproduce the problem
- 19. Our best practices on diagnosis ? Backup current infrastructure before task begins ? Freeze preproduction environment during the task force ? Downsize infrastructure to minimum requirements ? DonˇŻt blame previous provider who wrote the code ? Any component can be faulty ? One problem at time ? Focus mainly on application software 7.3s 1.3s 1s 5s 0.46s
- 20. Summary ? Pulling a big ship, but everyone knows quality matters ? Focus on most risky applications ? Learn by doing. Continuous improvement of quality ? Balance quality and risk (testing, reviews, ˇ) ? Create taskforces if a problem is difficult (dev, qa and ops needs to work together) Learn by doing Pulling a big ship Risk focus
- 21. Some references ? Adaptability of quality by risk ? EJIE (http://www.ejie.eus/y79- 03/es/contenidos/informacion/aseguramiento_calidad_ejie/es_0215/index.shtml) ? IEEE 1012: IEEE Standard for Software and Verification ? Investing in Software Testing: The Risks to System Quality. Rex Black ? Questionnaire evaluation and quality profile ? Measuring Software Product Quality. ERIK VAN VEENENDAAL AND ROB HENDRIKS ? Software Evaluation: Criteria-based Assessment. Mike Jackson, Steve Crouch and Rob Baxter ? RESEARCH ON THE AVIONIC SOFTWARE QUALITY EVALUATION BASED ON THE WSR METHODOLOGY, Tianshu Wang, Deming Zhong ? Integrated Software Quality Evaluation: A Fuzzy Multi-Criteria Approach. Journal of Information Processing Systems, Vol.7, No.3, September 2011 ? Software Product Evaluation, Current status and future needs for customers and industry. Teade Punter, Rini van Solingen, Jos Trienekens