FY14 workforce graph & diversity 06.30.14
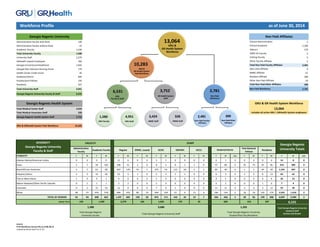
- 1. Administrative Faculty with Rank 128 2 Administrative Faculty without Rank 22 2,299 Academic Faculty 1,430 170 Total University Faculty 1,580 3 University Staff 2,279 5 GRHealth Leased Employees 166 2 Georgia Correctional HealthCare 1,045 2,481 Georgia War Veterans Nursing Home 170 9 Health Center Credit Union 26 67 Students/Interns 604 200 Postdoctoral Fellows 154 24 Residents 507 300 Total University Staff 4,951 2,781 Georgia Regents University Faculty & Staff 6,531 Total Medical Center Staff 3,424 Total Medical Associates Staff 328 Georgia Regents Health System Staff 3,752 GRU & GRHealth System Paid Workforce 10,283 ETHNICITY F M F M F M F M F M F M F M F M Unk F M F M F M Unk Alaskan Native/American Indian 0 0 0 0 11 6 0 0 3 1 0 0 0 0 0 1 0 0 0 0 0 14 8 0 Asian 2 7 58 162 108 51 2 0 8 5 0 1 1 0 57 60 0 35 75 43 85 314 386 0 Black/African American 3 7 67 28 447 170 55 7 375 54 115 18 5 1 85 40 0 1 2 39 20 1,192 307 0 Hispanic/Latino 2 2 15 36 23 5 1 0 5 2 1 1 0 0 6 3 0 2 3 8 13 63 62 0 Two or More Races 1 0 9 1 9 6 0 2 5 0 0 0 0 0 9 5 0 0 0 0 4 33 13 0 Native Hawaiian/Other Pacific Islander 0 1 1 1 3 2 0 0 2 0 0 0 0 0 0 2 0 0 0 1 0 7 4 0 Unknown 0 2 15 16 12 9 0 0 7 0 1 0 0 0 13 11 0 2 0 3 12 53 39 0 White 48 75 443 578 984 433 80 19 469 109 27 6 13 6 166 144 2 18 16 105 174 2,353 1,418 2 TOTAL BY GENDER 56 94 608 822 1,597 682 138 28 874 171 144 26 19 7 336 266 2 58 96 199 308 4,029 2,500 2 GRAND TOTAL source: FY14 Workforce Census File as of 06.30.14 created by Kerrie Scott 12.11.14 as of June 30, 2014 GRU & GR Health System Workforce includes all active GRU | GRHealth System employees 13,064 Total Non Paid Faculty Affiliates Non Paid Affiliates Non Paid Workforce Total Non Paid Other Affiliates Clinical-Administrative Clinical-Academic Adjunct 100% VA Faculty Visiting Faculty Other Faculty Affiliate GRU-UGA Affiliate GRMC Affiliate Resident Affiliate Other Non-Paid Affiliate 6,531 Total Georgia Regents University Faculty & Staffby Race and Gender Georgia Regents University Totals 604 Student/ Interns 1,265 Total Georgia Regents UniversityStudent/Post Doc/Residents FACULTY DIVERSITYGeorgia Regents UniversityFaculty & Staff 1,580 3,686 Total Georgia Regents University Staff 2,279 166 1,045 170 26 154 507 Total Georgia RegentsUniversity Faculty 150 1,430 GWVNH GCHC Post Doctoral Fellows Residents HCCU Regular GRMC, Leased Academic Faculty Administrative Faculty STAFF Georgia Regents Health System Workforce Profile Georgia Regents University 13,064 GRU & GR Health System Workforce GRMCStaff GRMA Staff GRU Faculty 1,580 3,424 328 Non-Paid Workforce Non-Paid Other Affiliates Non-Paid Faculty Affiliates 300 2,481 2,781 4,951 GRU Staff GR Health System Staff 3,752 GRUFaculty & Staff 6,531 10,283 GRU& GR Health SystemPaid Workforce

