Gathering And Processing Model Answers
Download as ppt, pdf0 likes717 views
Two techniques that could be used to gather information about the physical characteristics of the River Wye are measuring the width, depth, and speed, and taking photos or drawing field sketches. These techniques are suitable because measurements can be taken at different stages of the river and compared to other rivers, and photos can show how the river has changed over time when compared to older photos.
1 of 10
Downloaded 18 times
Ad
Recommended
Continuing Our Look At Primary And Secondary Data
Continuing Our Look At Primary And Secondary Dataguest2137aa
?
The document discusses different types of maps and data presentation methods used in geography, including their purposes, characteristics, and limitations. Scatter plots show relationships between two data sets, with the dependent variable on the x-axis. Line graphs show changes over time with all points connected. Maps are important geographical tools that can locate study areas, show spatial patterns, and compare changes over time. Different map types include choropleth, dot, topological, isoline, and sketch maps. Selecting the appropriate map scale and being aware of maps' limitations, like being snapshots in time, are important considerations.9696 w09 qp_11
9696 w09 qp_11Nicole710296
?
This document provides instructions for a geography exam. It tells students to write their identification information on all work submitted. It outlines that Section A requires answering all questions, Section B requires answering one question from the physical core choices, and Section C requires answering one question from the human core choices. Sketches and diagrams can be used to illustrate answers. The questions refer to materials in the included insert. Students should fasten all work together at the end.DTM DEM Generation
DTM DEM GenerationNurul Amirah Isa
?
DTM/DEM generation involves creating digital models of terrain elevation from various data sources. A DTM provides height values referenced to positions and can include other terrain features, while a DEM only provides regular elevation values. Photogrammetry and remote sensing are common methods to acquire elevation data and generate DTMs/DEMs. The data often needs editing and filtering to remove errors and refine the models. Raster and TIN representations are common formats, with rasters using a grid and TINs using irregular triangles. Accuracy depends on factors like the data source and grid size for rasters. DSMs include above-ground features and require processing to derive bare earth DTMs below the features.IGCSE Geography - Fieldwork Data Presentation
IGCSE Geography - Fieldwork Data PresentationRichard Allaway
?
This document lists various types of diagrams and charts that can be used to present fieldwork data, including field sketches, annotated photographs, bar charts, histograms, wind rose diagrams, line graphs, flow diagrams, pictograms, pie charts, composite bar charts, divided bar charts, scattergraphs, dot graphs, choropleth maps, isolines, desire lines, and complex diagrams.02 regression analysis
02 regression analysisSteveBoylan2
?
This document provides instructions for using Google Sheets to perform a linear regression analysis of copper(II) nitrate concentration data from spectrophotometric measurements of aqueous solutions. It describes preparing a data table and calculations sheet in Sheets, plotting an absorbance vs concentration chart, and writing a report with the table, chart and analysis. The regression analysis is used to determine the concentrations of copper(II) nitrate in two samples.Big Two Map
Big Two MapOwen Stuckey
?
The document compares two maps that depict crop acreage percentages by county in the United States. A choropleth map on the left uses color-coded counties to show percentages, with darker colors representing higher densities. An isarithmic contour map on the right does not show county boundaries and instead uses contour lines to connect areas of equal crop density, represented by color. While both maps show the same data, the contour map provides a clearer and more memorable visualization by making the continuous data easier to understand across large areas like regions.5 creating a_histogram
5 creating a_histogramMedia4math
?
This document provides instructions for creating a histogram using TI-Nspire calculator software. It outlines the keystrokes needed to 1) open a spreadsheet window and input data, 2) open a statistics window and select the spreadsheet data, and 3) generate and customize the histogram display with settings. The document is copyrighted tutorial material from a website providing math education resources.Ďȶ˼ĽĐg¤ČĄáĄÇĄŁĄ˘±í¬F2018 #1
Ďȶ˼ĽĐg¤ČĄáĄÇĄŁĄ˘±í¬F2018 #1Digital Nature Group
?
The document discusses representations of visual appearance in computer graphics and their relationships to methods for fabricating and displaying material appearance. It presents a taxonomy that extends previous work, arranging representations based on how they model interactions between viewers, materials, and illumination. Simpler representations that reduce material properties allow for full interactivity during display, while more complex representations maintaining full material properties restrict interactivity between viewers and lights.Industry Model Answers
Industry Model Answersneilgood
?
The document discusses the advantages and disadvantages of an industrial estate location in Rassau. The advantages are a large available workforce from declining traditional industries, cheap land on the edge of town, and good transport links via an A-class road. The main disadvantages are difficulty expanding due to sloping and wooded land surrounding the site.Conflict Model Answers
Conflict Model Answersneilgood
?
The document discusses a proposal to reopen and extend quarries near Sellack. It lists potential reasons against the proposal, including that the minor roads are unsuitable for large lorries, waste may pollute the river, and blasting may cause air and noise pollution. It also notes that removing woodland would be bad for wildlife. Potential reasons in favor include upgrading the roads, few local residents would be affected, and it would provide local employment.Rivers Model Answers
Rivers Model Answersneilgood
?
The document describes the physical features of the River Carron and its valley from Lochlands to Carron House. It notes that the river is in its lower course, has many meanders flowing east, and is tidal up to a certain point. It has a wide floodplain that narrows in places, and there is an oxbow lake present.Trade and Aid Model Answer
Trade and Aid Model Answerneilgood
?
The document discusses the advantages and disadvantages of membership in a trading alliance, the economic and political benefits of the European Union's expansion for new member countries, why changing world prices pose risks for some developing countries, and which types of aid would be most useful for developing countries after natural disasters like earthquakes or volcanic eruptions.How To Answer...
How To Answer...neilgood
?
A yacht race from Wick to Stornoway in Scotland was scheduled to start at 8am on August 31st. At 7am, the Met Office advised cancelling the race based on the synoptic weather chart. The chart showed an occluded front bringing heavy rain, low clouds, and poor visibility moving into the area. It also showed tightly packed isobars indicating strong winds blowing from the southwest, which would make sailing difficult. Therefore, the Met Office recommended cancelling the race due to forecasted strong winds, heavy rain, and low visibility.Industry Model Answers
Industry Model Answersneilgood
?
The document discusses the advantages and disadvantages of an industrial estate location in Rassau. The advantages include a large available workforce from declining traditional industries, cheap land on the edge of a built-up area, and good transport links via an A-class road. The main disadvantages are difficulties expanding due to sloping and wooded land surrounding the site.Settlement Model Answers
Settlement Model Answersneilgood
?
The park centered around Strathclyde Loch has several attractions for visitors, including a visitor center, picnic site, camping and caravan site, water sports center, and theme park. The physical landscape posed challenges for building the A465 road, requiring embankments across rivers and through narrow valleys, and construction on steep slopes. Evidence from the map shows the CBD of Motherwell is located in Area A, where there is a high density of buildings, railway station, churches, and civic buildings clustered at a route center.Farming Model Answers
Farming Model Answersneilgood
?
The farm is likely to be an arable farm. The land is gently sloping which makes it suitable for machinery use (2). The fields appear large, also efficient for machine farming (2). It is close to Lincoln which provides a market for selling products (1).GEOGRAPHY IGCSE: GRAPH SKILLS
GEOGRAPHY IGCSE: GRAPH SKILLSGeorge Dumitrache
?
The document discusses various types of graphs used in geography, including line graphs, pie charts, bar charts, and climate graphs, detailing their construction and applications. It explains how these graphs can represent different data sets, allowing for comparisons and trends to be visualized. Additionally, it emphasizes the importance of understanding climate patterns based on the information presented in climate graphs.DATA-PROCESSING.pptx
DATA-PROCESSING.pptxMeetHooda
?
The document discusses data processing and analysis. It defines data processing as collecting, organizing, and analyzing raw data to extract meaningful information. Key aspects of data processing include data preparation, conversion of raw data into useful information, and outputting results through reports, graphs, and diagrams. Common data processing methods are manual, electronic, and hybrid. The document also outlines steps in data analysis such as compilation, editing, coding, classification, and tabulation. It describes descriptive and inferential statistics used to analyze quantitative and qualitative data. Finally, it discusses various charts, diagrams, tables, and graphs used to visually present analyzed data. Basic understanding of Plots and diagrams used in data interpretation
Basic understanding of Plots and diagrams used in data interpretation Subedi Suraj
?
The document discusses various types of plots and diagrams that can be used to analyze and visualize data, including graphs, pie charts, bar graphs, dot plots, box plots, stem plots, histograms, and scatter plots. It provides examples of each type of plot along with their advantages and disadvantages. The document aims to help readers understand how to represent data in different visual formats to identify patterns and relationships.Use of Maps and Charts in Research
Use of Maps and Charts in ResearchShashikant Kumar, Ph.D
?
The document discusses the evolution and significance of using maps, graphs, and charts in research reports, particularly in social science research. It highlights the importance of visual representation in data analysis and presentation, emphasizing various types of charts and maps used for effectively communicating research findings. Additionally, it addresses the role of Geographic Information Systems (GIS) in enhancing the accuracy and accessibility of spatial data.Types of Chart
Types of Chartchartblocks
?
The document outlines various types of charts including bar, line, area, pie, donut, and scatter charts, detailing their characteristics and uses. Each chart type is suited for specific data representation needs, such as comparisons over time or illustrating parts of a whole. It emphasizes the importance of choosing the right chart to effectively communicate data relationships and distributions. diagrammatic and graphical representation of data
diagrammatic and graphical representation of dataVarun Prem Varu
?
This document discusses various types of diagrams and graphs that can be used to summarize statistical data. It describes one-dimensional, two-dimensional, and three-dimensional diagrams, as well as pictograms, cartograms, histograms, frequency polygons, frequency curves, ogives, and Lorenz curves. The key points are that diagrams and graphs make data simple and allow for easy comparison, while saving time over presenting raw numbers or text. Different types of diagrams and graphs are suited for different types of data and purposes. Guidelines are provided for properly constructing different diagrams.Lab file on research methodology
Lab file on research methodologySukhchain Aggarwal
?
This document is a lab file submitted by Sukhchain Aggarwal, a student of B.com, to their professor Harjeet Kaur. It contains an acknowledgement thanking the professors for their guidance. The document then outlines how to create different types of charts in Microsoft Excel, including line charts, bar charts, and pie charts. It provides examples of each chart type using sample data on test scores and the numbers of students in different years. Tables are included showing average, maximum, and minimum values calculated from the data using Excel formulas. Sources consulted for the file are listed in a bibliography.GIS Ostrava 2018 ¨C Insights for ArGIS
GIS Ostrava 2018 ¨C Insights for ArGISJan Novotn?
?
This document discusses Insights for ArcGIS, a new tool for analyzing and visualizing data in ArcGIS. It can perform descriptive data analysis graphically and intuitively. Insights connects analysis and visualization through interactive cards. It works directly with individual data fields and generates a spatial or temporal model in the background. Results are created on relevant cards and can be shared, collaborated on, and embedded in Story Maps. Insights can be used online through ArcGIS Online or on-premises with ArcGIS Enterprise.Graphic aids (2)
Graphic aids (2)Geena Maris Mangiliman
?
This document discusses different types of graphic aids used to communicate information visually. It describes tables, bar graphs, line graphs, pie charts, pictographs, organizational charts, Gantt charts, dot charts, diagrams, drawings, maps, and photographs. The document provides examples and explanations of how each graphic aid presents data in a clear, concise visual format to enhance reader comprehension beyond just text. It concludes with suggestions for appropriately using and integrating graphic aids into written materials.Different types of charts
Different types of chartsZakaria Salim
?
The document discusses different types of charts including column charts, bar charts, pie charts, line charts, area charts, stock charts, radar charts, bubble charts, scatter charts, and combo charts. For each chart type, the document outlines typical uses, advantages, and disadvantages. It provides an example of each chart type to illustrate how the chart can be constructed and interpreted.TYPES OF GRAPH & FLOW CHART
TYPES OF GRAPH & FLOW CHARTUniversity of Arid Agriculture RWP
?
The document discusses various types of graphs and flow charts for statistical data representation, including line graphs, pie charts, bar graphs, and histograms. It explains their uses, advantages, and limitations while also introducing flow charts to illustrate process sequences. Additionally, it covers logarithmic graphing techniques, emphasizing the importance of visualizing data effectively.1.4 revision week session
1.4 revision week sessionTaka Geo
?
This document provides guidance on constructing various types of graphs, including bar graphs, line graphs, climate graphs, percentage bar graphs, scatter plots, and pictographs. It explains the key elements that should be included in each graph, such as labeled axes, a title, legend/key, and scale. Examples of properly constructed graphs are also provided for each type to demonstrate how the guidance should be applied.DATA GRAPHICS 8th Sem.pdf
DATA GRAPHICS 8th Sem.pdfRavinandan A P
?
This document provides an overview of different types of graphs that can be used to present statistical data, including histograms, pie charts, bar charts, line charts, cubic graphs, response surface plots, and contour plots. It discusses the purpose and construction of each graph type, advantages and disadvantages, and provides examples of how and when each type of graph might be used. The overall goal is to help students identify, construct, and properly label different graphs to effectively communicate statistical data.Data Analysis Section
Data Analysis Sectionmsrichards
?
This document provides guidance for students on how to analyze and present field data collected for a GCSE geography class. It explains how to create tables, line graphs, bar charts, histograms, scatter plots, and cross-sections from field measurements. Specific instructions are given for properly labeling, scaling, and formatting each type of graph or chart. Examples are also provided to illustrate the various data visualization techniques.More Related Content
Viewers also liked (8)
Industry Model Answers
Industry Model Answersneilgood
?
The document discusses the advantages and disadvantages of an industrial estate location in Rassau. The advantages are a large available workforce from declining traditional industries, cheap land on the edge of town, and good transport links via an A-class road. The main disadvantages are difficulty expanding due to sloping and wooded land surrounding the site.Conflict Model Answers
Conflict Model Answersneilgood
?
The document discusses a proposal to reopen and extend quarries near Sellack. It lists potential reasons against the proposal, including that the minor roads are unsuitable for large lorries, waste may pollute the river, and blasting may cause air and noise pollution. It also notes that removing woodland would be bad for wildlife. Potential reasons in favor include upgrading the roads, few local residents would be affected, and it would provide local employment.Rivers Model Answers
Rivers Model Answersneilgood
?
The document describes the physical features of the River Carron and its valley from Lochlands to Carron House. It notes that the river is in its lower course, has many meanders flowing east, and is tidal up to a certain point. It has a wide floodplain that narrows in places, and there is an oxbow lake present.Trade and Aid Model Answer
Trade and Aid Model Answerneilgood
?
The document discusses the advantages and disadvantages of membership in a trading alliance, the economic and political benefits of the European Union's expansion for new member countries, why changing world prices pose risks for some developing countries, and which types of aid would be most useful for developing countries after natural disasters like earthquakes or volcanic eruptions.How To Answer...
How To Answer...neilgood
?
A yacht race from Wick to Stornoway in Scotland was scheduled to start at 8am on August 31st. At 7am, the Met Office advised cancelling the race based on the synoptic weather chart. The chart showed an occluded front bringing heavy rain, low clouds, and poor visibility moving into the area. It also showed tightly packed isobars indicating strong winds blowing from the southwest, which would make sailing difficult. Therefore, the Met Office recommended cancelling the race due to forecasted strong winds, heavy rain, and low visibility.Industry Model Answers
Industry Model Answersneilgood
?
The document discusses the advantages and disadvantages of an industrial estate location in Rassau. The advantages include a large available workforce from declining traditional industries, cheap land on the edge of a built-up area, and good transport links via an A-class road. The main disadvantages are difficulties expanding due to sloping and wooded land surrounding the site.Settlement Model Answers
Settlement Model Answersneilgood
?
The park centered around Strathclyde Loch has several attractions for visitors, including a visitor center, picnic site, camping and caravan site, water sports center, and theme park. The physical landscape posed challenges for building the A465 road, requiring embankments across rivers and through narrow valleys, and construction on steep slopes. Evidence from the map shows the CBD of Motherwell is located in Area A, where there is a high density of buildings, railway station, churches, and civic buildings clustered at a route center.Farming Model Answers
Farming Model Answersneilgood
?
The farm is likely to be an arable farm. The land is gently sloping which makes it suitable for machinery use (2). The fields appear large, also efficient for machine farming (2). It is close to Lincoln which provides a market for selling products (1).Similar to Gathering And Processing Model Answers (20)
GEOGRAPHY IGCSE: GRAPH SKILLS
GEOGRAPHY IGCSE: GRAPH SKILLSGeorge Dumitrache
?
The document discusses various types of graphs used in geography, including line graphs, pie charts, bar charts, and climate graphs, detailing their construction and applications. It explains how these graphs can represent different data sets, allowing for comparisons and trends to be visualized. Additionally, it emphasizes the importance of understanding climate patterns based on the information presented in climate graphs.DATA-PROCESSING.pptx
DATA-PROCESSING.pptxMeetHooda
?
The document discusses data processing and analysis. It defines data processing as collecting, organizing, and analyzing raw data to extract meaningful information. Key aspects of data processing include data preparation, conversion of raw data into useful information, and outputting results through reports, graphs, and diagrams. Common data processing methods are manual, electronic, and hybrid. The document also outlines steps in data analysis such as compilation, editing, coding, classification, and tabulation. It describes descriptive and inferential statistics used to analyze quantitative and qualitative data. Finally, it discusses various charts, diagrams, tables, and graphs used to visually present analyzed data. Basic understanding of Plots and diagrams used in data interpretation
Basic understanding of Plots and diagrams used in data interpretation Subedi Suraj
?
The document discusses various types of plots and diagrams that can be used to analyze and visualize data, including graphs, pie charts, bar graphs, dot plots, box plots, stem plots, histograms, and scatter plots. It provides examples of each type of plot along with their advantages and disadvantages. The document aims to help readers understand how to represent data in different visual formats to identify patterns and relationships.Use of Maps and Charts in Research
Use of Maps and Charts in ResearchShashikant Kumar, Ph.D
?
The document discusses the evolution and significance of using maps, graphs, and charts in research reports, particularly in social science research. It highlights the importance of visual representation in data analysis and presentation, emphasizing various types of charts and maps used for effectively communicating research findings. Additionally, it addresses the role of Geographic Information Systems (GIS) in enhancing the accuracy and accessibility of spatial data.Types of Chart
Types of Chartchartblocks
?
The document outlines various types of charts including bar, line, area, pie, donut, and scatter charts, detailing their characteristics and uses. Each chart type is suited for specific data representation needs, such as comparisons over time or illustrating parts of a whole. It emphasizes the importance of choosing the right chart to effectively communicate data relationships and distributions. diagrammatic and graphical representation of data
diagrammatic and graphical representation of dataVarun Prem Varu
?
This document discusses various types of diagrams and graphs that can be used to summarize statistical data. It describes one-dimensional, two-dimensional, and three-dimensional diagrams, as well as pictograms, cartograms, histograms, frequency polygons, frequency curves, ogives, and Lorenz curves. The key points are that diagrams and graphs make data simple and allow for easy comparison, while saving time over presenting raw numbers or text. Different types of diagrams and graphs are suited for different types of data and purposes. Guidelines are provided for properly constructing different diagrams.Lab file on research methodology
Lab file on research methodologySukhchain Aggarwal
?
This document is a lab file submitted by Sukhchain Aggarwal, a student of B.com, to their professor Harjeet Kaur. It contains an acknowledgement thanking the professors for their guidance. The document then outlines how to create different types of charts in Microsoft Excel, including line charts, bar charts, and pie charts. It provides examples of each chart type using sample data on test scores and the numbers of students in different years. Tables are included showing average, maximum, and minimum values calculated from the data using Excel formulas. Sources consulted for the file are listed in a bibliography.GIS Ostrava 2018 ¨C Insights for ArGIS
GIS Ostrava 2018 ¨C Insights for ArGISJan Novotn?
?
This document discusses Insights for ArcGIS, a new tool for analyzing and visualizing data in ArcGIS. It can perform descriptive data analysis graphically and intuitively. Insights connects analysis and visualization through interactive cards. It works directly with individual data fields and generates a spatial or temporal model in the background. Results are created on relevant cards and can be shared, collaborated on, and embedded in Story Maps. Insights can be used online through ArcGIS Online or on-premises with ArcGIS Enterprise.Graphic aids (2)
Graphic aids (2)Geena Maris Mangiliman
?
This document discusses different types of graphic aids used to communicate information visually. It describes tables, bar graphs, line graphs, pie charts, pictographs, organizational charts, Gantt charts, dot charts, diagrams, drawings, maps, and photographs. The document provides examples and explanations of how each graphic aid presents data in a clear, concise visual format to enhance reader comprehension beyond just text. It concludes with suggestions for appropriately using and integrating graphic aids into written materials.Different types of charts
Different types of chartsZakaria Salim
?
The document discusses different types of charts including column charts, bar charts, pie charts, line charts, area charts, stock charts, radar charts, bubble charts, scatter charts, and combo charts. For each chart type, the document outlines typical uses, advantages, and disadvantages. It provides an example of each chart type to illustrate how the chart can be constructed and interpreted.TYPES OF GRAPH & FLOW CHART
TYPES OF GRAPH & FLOW CHARTUniversity of Arid Agriculture RWP
?
The document discusses various types of graphs and flow charts for statistical data representation, including line graphs, pie charts, bar graphs, and histograms. It explains their uses, advantages, and limitations while also introducing flow charts to illustrate process sequences. Additionally, it covers logarithmic graphing techniques, emphasizing the importance of visualizing data effectively.1.4 revision week session
1.4 revision week sessionTaka Geo
?
This document provides guidance on constructing various types of graphs, including bar graphs, line graphs, climate graphs, percentage bar graphs, scatter plots, and pictographs. It explains the key elements that should be included in each graph, such as labeled axes, a title, legend/key, and scale. Examples of properly constructed graphs are also provided for each type to demonstrate how the guidance should be applied.DATA GRAPHICS 8th Sem.pdf
DATA GRAPHICS 8th Sem.pdfRavinandan A P
?
This document provides an overview of different types of graphs that can be used to present statistical data, including histograms, pie charts, bar charts, line charts, cubic graphs, response surface plots, and contour plots. It discusses the purpose and construction of each graph type, advantages and disadvantages, and provides examples of how and when each type of graph might be used. The overall goal is to help students identify, construct, and properly label different graphs to effectively communicate statistical data.Data Analysis Section
Data Analysis Sectionmsrichards
?
This document provides guidance for students on how to analyze and present field data collected for a GCSE geography class. It explains how to create tables, line graphs, bar charts, histograms, scatter plots, and cross-sections from field measurements. Specific instructions are given for properly labeling, scaling, and formatting each type of graph or chart. Examples are also provided to illustrate the various data visualization techniques.Unit 2 ce547
Unit 2 ce547zishanrkiul
?
This document discusses quality management tools and techniques, including histograms, check sheets, Pareto analysis, cause-and-effect diagrams, graphs, control charts, and scatter diagrams. It also covers planning and controlling quality during design of structures, and inspection of materials and machinery. Inspection includes receiving, in-process, and final inspection to check if products meet standards and identify defects. The objectives, purposes, stages, and procedures of inspection are outlined.7 quality control tools
7 quality control toolsVima Mali
?
After World War II, Japan adopted quality as an economic strategy and selected seven statistical tools to analyze quality problems and drive continuous improvement. The seven tools - Pareto charts, cause-and-effect diagrams, histograms, control charts, scatter plots, check sheets, and flow charts - can identify up to 95% of issues. Each tool has a specific purpose, such as prioritizing problems with Pareto charts or identifying relationships between variables with scatter plots. Using these tools, Japanese companies were able to dramatically improve quality and economic performance.Ge 249 SOPHISTS GROUP SAUT BUKOBA
Ge 249 SOPHISTS GROUP SAUT BUKOBA Mwl. Mapesa Nestory
?
This document provides instructions and examples for constructing different types of graphs used in geography:
1) Age-sex pyramids show population structure broken down by age and gender. Procedures and an example are given for constructing one.
2) Compound bar graphs subdivide bars to show component parts. Procedures and an example construction are outlined.
3) Dot maps show distributions using dots of varying size. Procedures, advantages, disadvantages and a worked example are described.
4) Simple line graphs show relationships between two variables over time. Construction procedures, advantages and disadvantages are summarized.
5) Flow line maps illustrate movement between locations using line thickness. Procedures, an example, advantagesGraphical descriptive techniques ¨C Nominal data Assignment Help
Graphical descriptive techniques ¨C Nominal data Assignment HelpSample Assignment
?
Chapter 3 discusses graphical and tabular techniques for summarizing nominal and ordinal data, focusing on selecting appropriate charts like bar charts and pie charts. It provides guidelines for representing data visually to enhance decision making and explains how to analyze relationships between two nominal variables using methods such as cross-classification tables. The chapter also includes examples and practical tips for constructing charts and interpreting results.analysis and presentation of data
analysis and presentation of dataWISDOM WEALTH INTERNATIONAL SCHOOL, TAMILNADU
?
The document discusses different methods of analyzing and presenting quantitative data. It describes two main types of analysis: qualitative analysis, which involves interpreting qualitative research data, and quantitative analysis, which involves presenting and interpreting numerical data through descriptive and inferential statistics. Descriptive statistics include measures of central tendency like mean, median and mode, as well as measures of variability like range and standard deviation. Inferential statistics are used to test hypotheses and generalize samples to populations. The document also discusses various methods of graphically presenting quantitative data through graphs like histograms, frequency polygons, frequency curves and Ogive curves.Summarization of Data in basic of statistic according to geography.pptx
Summarization of Data in basic of statistic according to geography.pptxrakibrazu995
?
data summarization 10th classAd
More from neilgood (10)
Ghs Depression
Ghs Depressionneilgood
?
1. Synoptic charts are detailed weather maps used by meteorologists to show air pressure patterns and forecast weather.
2. Lines connecting areas of equal air pressure called isobars are drawn, showing low and high pressure systems. Closer isobars indicate windier conditions.
3. Low pressure systems called depressions are identified by symbols showing warm, cold, and occluded fronts associated with rainfall.Sg Trade Revision
Sg Trade Revisionneilgood
?
International trade is the buying and selling of raw materials, manufactured goods, and services between countries. A country's pattern of international trade can provide insight into its level of development. Developing countries have few factories and export primary goods like food and raw materials to pay for importing manufactured goods from other countries with more industrialization.S4 Synoptic Symbols
S4 Synoptic Symbolsneilgood
?
Meterologists use special symbols on weather charts to compile forecasts and students should prepare to decode or draw these symbols for an exam by memorizing the weather symbol key in order to determine weather conditions in Lerwick and Lands End.S4 Prelim Revision
S4 Prelim Revisionneilgood
?
1) You will need to know how to accurately interpret and reference features on maps using grid references and symbols.
2) You must be able to identify and explain both physical landscape features formed by glaciers and rivers as well as different types of settlements, industries, and farming on maps.
3) You will need to have memorized synoptic chart symbols and be able to describe weather patterns and explain the causes of weather changes. You should also know about different climate regions and the challenges for human settlement they present.Glacial Model Answers
Glacial Model Answersneilgood
?
The document describes how physical landscape features have influenced land use patterns in a particular area. Housing and industry are located on flat, low-lying land near rivers, though there is some flood risk. Communication links like roads and railways are built along valley sides. Trees are planted on steeper slopes. Hill sheep farming occurs on steep slopes. Rough grazing land is also on steep slopes.Physical Landscapes
Physical Landscapesneilgood
?
1. The document describes the three courses of a river - upper, middle, and lower - and the landforms associated with each such as waterfalls in the upper course and meanders in the lower course.
2. It also discusses landscapes formed by glacial erosion including U-shaped valleys, hanging valleys, and corries.
3. Land use varies between the river courses and glaciated uplands, from extensive forestry and livestock in the upper reaches to intensive agriculture and largest settlements in the lower courses.Glacial Erosion
Glacial Erosionneilgood
?
The document discusses the historical changes in the Earth's climate and the formation, movement, and erosion processes of glaciers. It covers topics such as the dynamics of glaciers, the formation of landscapes through erosion, and specific features like cirques, ar¨ştes, and U-shaped valleys. Additionally, it explains how glaciers shape the environment and create distinctive landforms through processes like freeze-thaw, plucking, and abrasion.How To Answer Deforestation Question
How To Answer Deforestation Questionneilgood
?
The document discusses whether developments in rainforests have benefited local people. It presents an opinion on the topic and provides three reasons to support the view along with a concluding statement.International Aid
International Aidneilgood
?
International aid can come in the form of short-term emergency aid for natural disasters or wars, providing food, clothing, medicine and shelter. Long-term aid helps countries develop over months or years through infrastructure projects like hospitals, schools, power stations and roads. Official aid comes from other countries or groups like the UN using tax money, while voluntary aid comes from charitable donations. Countries provide aid to help poorer countries develop so they can trade more, and to gain political support, while some see it as a moral duty. However, aid is not always effective and can cause problems if unsuitable, does not reach the needy, or creates other issues. Small-scale self-help schemes that involve local people and technology may beWind Farm Decision Making Question
Wind Farm Decision Making Questionneilgood
?
There are many competing demands for how rural landscapes are used, including the environment, employment, green energy production, and community needs. Some of the main competing land uses in rural areas are conservation and environmental protection, agriculture and food production, residential and commercial development, recreation, and renewable energy development.Ad
Recently uploaded (20)
Curietech AI in action - Accelerate MuleSoft development
Curietech AI in action - Accelerate MuleSoft developmentshyamraj55
?
CurieTech AI in Action ¨C Accelerate MuleSoft Development
Overview:
This presentation demonstrates how CurieTech AIˇŻs purpose-built agents empower MuleSoft developers to create integration workflows faster, more accurately, and with less manual effort
linkedin.com
+12
curietech.ai
+12
meetups.mulesoft.com
+12
.
Key Highlights:
Dedicated AI agents for every stage: Coding, Testing (MUnit), Documentation, Code Review, and Migration
curietech.ai
+7
curietech.ai
+7
medium.com
+7
DataWeave automation: Generate mappings from tables or samplesˇŞ95%+ complete within minutes
linkedin.com
+7
curietech.ai
+7
medium.com
+7
Integration flow generation: Auto-create Mule flows based on specificationsˇŞspeeds up boilerplate development
curietech.ai
+1
medium.com
+1
Efficient code reviews: Gain intelligent feedback on flows, patterns, and error handling
youtube.com
+8
curietech.ai
+8
curietech.ai
+8
Test & documentation automation: Auto-generate MUnit test cases, sample data, and detailed docs from code
curietech.ai
+5
curietech.ai
+5
medium.com
+5
Why Now?
Achieve 10ˇÁ productivity gains, slashing development time from hours to minutes
curietech.ai
+3
curietech.ai
+3
medium.com
+3
Maintain high accuracy with code quality matching or exceeding manual efforts
curietech.ai
+2
curietech.ai
+2
curietech.ai
+2
Ideal for developers, architects, and teams wanting to scale MuleSoft projects with AI efficiency
Conclusion:
CurieTech AI transforms MuleSoft development into an AI-accelerated workflowˇŞletting you focus on innovation, not repetition."Scaling in space and time with Temporal", Andriy Lupa.pdf
"Scaling in space and time with Temporal", Andriy Lupa.pdfFwdays
?
Design patterns like Event Sourcing and Event Streaming have long become standards for building real-time analytics systems. However, when the system load becomes nonlinear with fast and often unpredictable spikes, it's crucial to respond quickly in order not to lose real-time operating itself.
In this talk, IˇŻll share my experience implementing and using a tool like Temporal.io. We'll explore the evolution of our system for maintaining real-time report generation and discuss how we use Temporal both for short-lived pipelines and long-running background tasks.Wenn alles versagt - IBM Tape sch¨ątzt, was z?hlt! Und besonders mit dem neust...
Wenn alles versagt - IBM Tape sch¨ątzt, was z?hlt! Und besonders mit dem neust...Josef Weingand
?
IBM LTO10PyCon SG 25 - Firecracker Made Easy with Python.pdf
PyCon SG 25 - Firecracker Made Easy with Python.pdfMuhammad Yuga Nugraha
?
Explore the ease of managing Firecracker microVM with the firecracker-python. In this session, I will introduce the basics of Firecracker microVM and demonstrate how this custom SDK facilitates microVM operations easily. We will delve into the design and development process behind the SDK, providing a behind-the-scenes look at its creation and features. While traditional Firecracker SDKs were primarily available in Go, this module brings a simplicity of Python to the table.Quantum AI Discoveries: Fractal Patterns Consciousness and Cyclical Universes
Quantum AI Discoveries: Fractal Patterns Consciousness and Cyclical UniversesSaikat Basu
?
Embark on a cosmic journey exploring the intersection of quantum
computing, consciousness, and ancient wisdom. Together we'll uncover the
recursive patterns that bind our reality.Mastering AI Workflows with FME by Mark Do?ring
Mastering AI Workflows with FME by Mark Do?ringSafe Software
?
Harness the full potential of AI with FME: From creating high-quality training data to optimizing models and utilizing results, FME supports every step of your AI workflow. Seamlessly integrate a wide range of models, including those for data enhancement, forecasting, image and object recognition, and large language models. Customize AI models to meet your exact needs with FMEˇŻs powerful tools for training, optimization, and seamless integrationAI vs Human Writing: Can You Tell the Difference?
AI vs Human Writing: Can You Tell the Difference?Shashi Sathyanarayana, Ph.D
?
This slide illustrates a side-by-side comparison between human-written, AI-written, and ambiguous content. It highlights subtle cues that help readers assess authenticity, raising essential questions about the future of communication, trust, and thought leadership in the age of generative AI.EIS-Webinar-Engineering-Retail-Infrastructure-06-16-2025.pdf
EIS-Webinar-Engineering-Retail-Infrastructure-06-16-2025.pdfEarley Information Science
?
As AI reshapes expectations in retail and B2B commerce, organizations are recognizing a critical reality: meaningful AI outcomes depend on well-structured, adaptable infrastructure. In this session, Seth Earley is joined by Phil Ryan - AI strategist, search technologist, and founder of Glass Leopard Technologies - for a candid conversation on what it truly means to engineer systems for scale, agility, and intelligence.
Phil draws on more than two decades of experience leading search and AI initiatives for enterprise organizations. Together, he and Seth explore the challenges businesses face when legacy architectures limit personalization, agility, and real-time decisioning - and what needs to change to support agentic technologies and next-best-action capabilities.
Key themes from the webinar include:
Composability as a prerequisite for AI?- Why modular, loosely coupled systems are essential for adapting to rapid innovation and evolving business needs
Search and relevance as foundational to AI?- How techniques honed-in enterprise search have laid the groundwork for more responsive and intelligent customer experiences
From MDM and CDP to agentic systems?- How data platforms are evolving to support richer customer context and dynamic orchestration
Engineering for business alignment?- Why successful AI programs require architectural decisions grounded in measurable outcomes
The conversation is practical and forward-looking, connecting deep technical understanding with real-world business needs. Whether youˇŻre modernizing your commerce stack or exploring how AI can enhance product discovery, personalization, or customer journeys, this session provides a clear-eyed view of the capabilities, constraints, and priorities that matter most.Oh, the Possibilities - Balancing Innovation and Risk with Generative AI.pdf
Oh, the Possibilities - Balancing Innovation and Risk with Generative AI.pdfPriyanka Aash
?
Oh, the Possibilities - Balancing Innovation and Risk with Generative AIGenAI Opportunities and Challenges - Where 370 Enterprises Are Focusing Now.pdf
GenAI Opportunities and Challenges - Where 370 Enterprises Are Focusing Now.pdfPriyanka Aash
?
GenAI Opportunities and Challenges - Where 370 Enterprises Are Focusing NowTech-ASan: Two-stage check for Address Sanitizer - Yixuan Cao.pdf
Tech-ASan: Two-stage check for Address Sanitizer - Yixuan Cao.pdfcaoyixuan2019
?
A presentation at Internetware 2025.AI Agents and FME: A How-to Guide on Generating Synthetic Metadata
AI Agents and FME: A How-to Guide on Generating Synthetic MetadataSafe Software
?
In the world of AI agents, semantics is king. Good metadata is thus essential in an organization's AI readiness checklist. But how do we keep up with the massive influx of new data? In this talk we go over the tips and tricks in generating synthetic metadata for the consumption of human users and AI agents alike.Techniques for Automatic Device Identification and Network Assignment.pdf
Techniques for Automatic Device Identification and Network Assignment.pdfPriyanka Aash
?
Techniques for Automatic Device Identification and Network AssignmentUserCon Belgium: Honey, VMware increased my bill
UserCon Belgium: Honey, VMware increased my billstijn40
?
VMwareˇŻs pricing changes have forced organizations to rethink their datacenter cost management strategies. While FinOps is commonly associated with cloud environments, the FinOps Foundation has recently expanded its framework to include ScopesˇŞand Datacenter is now officially part of the equation. In this session, weˇŻll map the FinOps Framework to a VMware-based datacenter, focusing on cost visibility, optimization, and automation. YouˇŻll learn how to track costs more effectively, rightsize workloads, optimize licensing, and drive efficiencyˇŞall without migrating to the cloud. WeˇŻll also explore how to align IT teams, finance, and leadership around cost-aware decision-making for on-prem environments. If your VMware bill keeps increasing and you need a new approach to cost management, this session is for you!Enhance GitHub Copilot using MCP - Enterprise version.pdf
Enhance GitHub Copilot using MCP - Enterprise version.pdfNilesh Gule
?
şÝşÝߣ deck related to the GitHub Copilot Bootcamp in Melbourne on 17 June 2025AI VIDEO MAGAZINE - June 2025 - r/aivideo
AI VIDEO MAGAZINE - June 2025 - r/aivideo1pcity Studios, Inc
?
AI VIDEO MAGAZINE - r/aivideo community newsletter ¨C Exclusive Tutorials: How to make an AI VIDEO from scratch, PLUS: How to make AI MUSIC, Hottest ai videos of 2025, Exclusive Interviews, New Tools, Previews, and MORE - JUNE 2025 ISSUE -Cracking the Code - Unveiling Synergies Between Open Source Security and AI.pdf
Cracking the Code - Unveiling Synergies Between Open Source Security and AI.pdfPriyanka Aash
?
Cracking the Code - Unveiling Synergies Between Open Source Security and AIGathering And Processing Model Answers
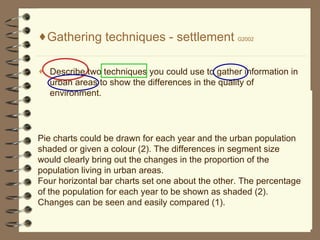
- 1. Gathering techniques - settlement G2002 Describe two techniques you could use to gather information in urban areas to show the differences in the quality of environment. Pie charts could be drawn for each year and the urban population shaded or given a colour (2). The differences in segment size would clearly bring out the changes in the proportion of the population living in urban areas. Four horizontal bar charts set one about the other. The percentage of the population for each year to be shown as shaded (2). Changes can be seen and easily compared (1). Gathering techniques: Questionnaires and interviews Observing and recording Measuring sketching
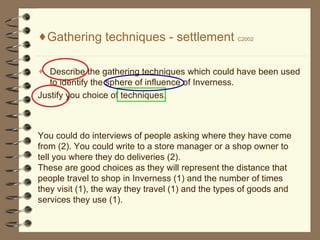
- 2. Gathering techniques - settlement C2002 Describe the gathering techniques which could have been used to identify the sphere of influence of Inverness. Justify you choice of techniques. You could do interviews of people asking where they have come from (2). You could write to a store manager or a shop owner to tell you where they do deliveries (2). These are good choices as they will represent the distance that people travel to shop in Inverness (1) and the number of times they visit (1), the way they travel (1) and the types of goods and services they use (1).
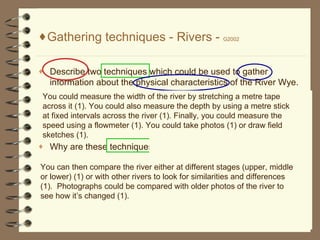
- 3. Gathering techniques - Rivers - G2002 Describe two techniques which could be used to gather information about the physical characteristics of the River Wye. Why are these techniques suitable? You could measure the width of the river by stretching a metre tape across it (1). You could also measure the depth by using a metre stick at fixed intervals across the river (1). Finally, you could measure the speed using a flowmeter (1). You could take photos (1) or draw field sketches (1). You can then compare the river either at different stages (upper, middle or lower) (1) or with other rivers to look for similarities and differences (1). Photographs could be compared with older photos of the river to see how itˇŻs changed (1). Gathering techniques: Questionnaires and interviews Observing and recording Measuring sketching
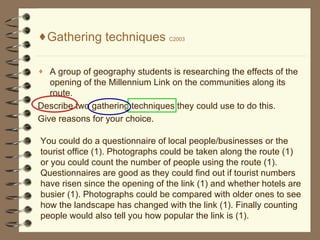
- 4. Gathering techniques C2003 A group of geography students is researching the effects of the opening of the Millennium Link on the communities along its route. Describe two gathering techniques they could use to do this. Give reasons for your choice. You could do a questionnaire of local people/businesses or the tourist office (1). Photographs could be taken along the route (1) or you could count the number of people using the route (1). Questionnaires are good as they could find out if tourist numbers have risen since the opening of the link (1) and whether hotels are busier (1). Photographs could be compared with older ones to see how the landscape has changed with the link (1). Finally counting people would also tell you how popular the link is (1).
- 5. Processing techniques - farming C2002 Give two other processing techniques which could be used to show this information. Give reasons for your choice. Two possible techniques might be pie charts and divided bar graphs (2). Pie charts are good as they are a clear way to show the information (1) and comparisons can be easily made (1) especially if you use colour (1). Divided bar graphs are good as you would be able to easily read the land use and compare them (1). Processing techniques: Line graph Pie chart Bar graph Table Drawing a cross- section Labelling a map/graph etc Drawing a map
- 6. Processing techniques G2004 Give two processing techniques which could be used to present the information shown in Reference Diagram Q7B. Give reasons for your choice. Two possible techniques would be line graphs and bar graphs. Line graphs show trends over time (1) and can show the rates of change by the steepness of the line (1). Different colours can be used for employment category (1). Bar graphs can show proportions (1) and can make comparison easier (1) especially if they are shaded (1).
- 7. Processing techniques C2003 Look at reference Table Q9. Identify other techniques that could be used to process the data shown above. Give reasons for your choice. You could draw a series of pie charts (1) or a bar graph (1) or a series of divided bar graphs (1). Pie charts allow you to see the worldwide significance of south african minerals (1). Also colour can be used to improve the visual impact of South AfricaˇŻs proportion (1). A bar graph can allow for visual comparison (1) and if coloured, you could highlight the differences (1).
- 8. Processing techniques G2005 Suggest two other techniques which could be used to process the information in Reference Table Q8B. Give reasons for your answers. You could use pie charts (1) or put the information on a divided bar graph (1). The pie chart is good as it clearly shows percentages (1) and can be coloured to allow for comparisons (1). The divided bar graph is good at showing differences (1) and can be easier to draw than a divided bar graph (1).
- 9. Processing techniques C2005 Which other processing techniques could be used to display the export percentage figures shown in Reference Diagram Q8? Give reasons for your choice of techniques. You could use pie charts (1) or draw a table (1). The pie chart would be easy to do as the information is already in percentages (1) and drawing it would allow for easy comparison (1) and colour could be used to highlight the segments (1). A table could be drawn so that countries could be put in order (1) and it could also be divided in to groups (1) with colour to enhance differences (1).
- 10. Processing techniques - population G2002 Give one processing technique which could be used to show the information in Table 8. Give reasons for your choice. Pie charts could be drawn for each year and urban population segment shaded or coloured (2). The differences in segment size would clearly bring out the changes in the proportion of the population living in urban areas (2). Four horizontal bar graphs could be set one above the other (1). Changes in the urban share of total population can be seen and compared (1). Processing techniques: Line graph Pie chart Bar graph Table Drawing a cross- section Labelling a map/graph etc Drawing a map