Genetic impacts and climate change Part B, ACEAS Grand, Vicki Thomson
- 1. Using genetics to understand the impacts of climate change on Australian endemics Part B Vicki Thomson, Alan Cooper, Jeremy Austin, Corey Bradshaw, Leo Joseph, Margaret Byrne, Craig Moritz, Steve Donnellan, Marc Suchard, Mike Hickerson, Tanya Laity
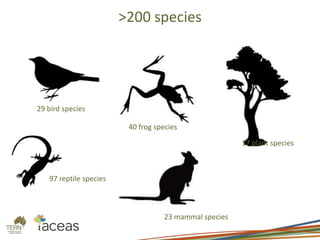
- 2. >200 species 29 bird species 40 frog species 23 mammal species 17 plant species 97 reptile species
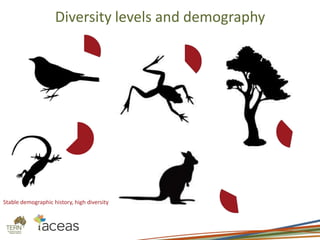
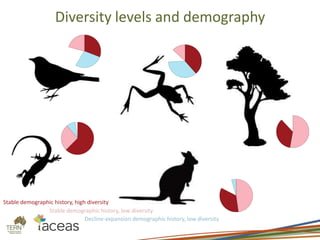
- 3. Diversity levels and demography Stable demographic history, high diversity
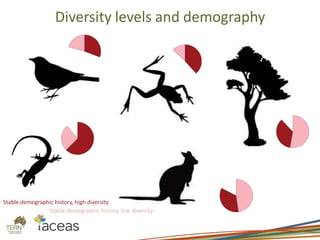
- 4. Diversity levels and demography Stable demographic history, high diversity Stable demographic history, low diversity
- 5. Diversity levels and demography Stable demographic history, high diversity Stable demographic history, low diversity Decline-expansion demographic history, low diversity
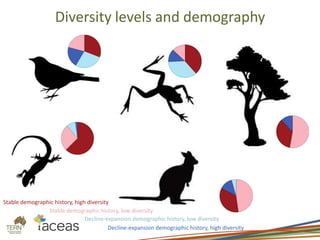
- 6. Diversity levels and demography Stable demographic history, high diversity Decline-expansion demographic history, high diversity Stable demographic history, low diversity Decline-expansion demographic history, low diversity
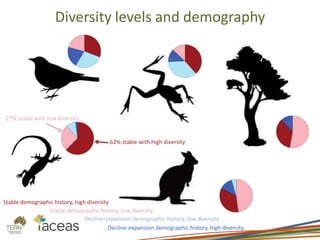
- 7. Diversity levels and demography 62% stable with high diversity 27% stable with low diversity Stable demographic history, high diversity Decline-expansion demographic history, high diversity Decline-expansion demographic history, low diversity Stable demographic history, low diversity
Editor's Notes
- #2: Our project aims were to predict the effects of future climates on Australian biodiversity by examining how species survived past climate events. Of those species that have survived, again and again we have seen species with low genetic diversity and/or signs of a decline in population size during bad times and then a rebound when times got better, which we assume is related to past climate events. But, until now each study has been concerned with only one or a handful of species and describing their response to past events. Until nowĪŁ
- #3: So after some quality control we ended up with just over 200 species across birds, frogs, plants, reptiles, and mammals. Of the species that we see today, which have survived cycles of past climate events, we wanted to know how they survived, did they have differing abilities to survive ©C so did they decline while times were bad but were able to expand again just in the nick of time to avoid extinction, or have they always done well no matter what the climate.
- #4: Of the species we looked at a certain percentage have had a stable demographic history, so theyĪ»ve always done well no matter what the climate and in addition they now have relatively high diversity levels,
- #5: Another set have had a similar stable demographic history but with low diversity levels.
- #6: Another group have had a decline in their population size in the past and then rebounded their population size, but have low diversity.
- #7: And a fourth group have had a decline in their population size then rebounded their population size, but to the point that they now have a high diversity level. Now one of the more obvious patterns that we can see in just this set of data, is that reptiles have had a large number of species that have had a stable demographic history, that is those that have survived well throughout past climates without too many changes in their population size ©C seen in the dark red and pink.
- #8: In fact almost 90% of the reptile species we looked at had a stable demographic history.
