Geospatial tools for Policy and Planning
ŌĆó
1 likeŌĆó168 views

Use and applications of geospatial tools for targeting and prioritisation of interventions and actions.


![Reflectance ’āĀ NDVI [Normalized Difference Vegetation Index]
Lifted from Dr. Kyu-Sung Lee presentation. Year 2014
The amount of energy reflected by an object (received by the sensor). Different
object/target reflect or absorb sunŌĆÖs radiation in different ways
’é¦ Material, physical (growth) , chemical state (moisture), surface roughness
Vegetation
Soil or bare
ground
Cloud](https://image.slidesharecdn.com/geospatialtoolsforpolicynplanningforcpaf-uplbciat-181121235454/85/Geospatial-tools-for-Policy-and-Planning-9-320.jpg)


Geospatial tools for Policy and Planning
- 1. Geo-Spatial Tools for Targeting and Prioritisation - Leo Kris M. Palao - International Center for Tropical Agriculture 13 October 2018, 9-11AM CPAF, UPLB
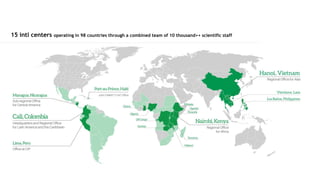
- 2. Operational presence in 56 countries across 3 regions 990+ scientists and support staff; 100M+ annual budget 15 intl centers operating in 98 countries through a combined team of 10 thousand++ scientific staff
- 3. Agrobiodiversity Soils & Landscapes Decision & Policy Analysis CIAT Research: commodities, systems & futures ŌĆó Bean ŌĆó Tropical Forages ŌĆó Cassava ŌĆó Rice ŌĆó Genetic Resources ŌĆó Climate Change ŌĆó Linking Farmers to Markets ŌĆó Ecosystem Services ŌĆó Sustainable Intensification ŌĆó Land Degradation ŌĆó Climate Smart Agriculture CLIMATE CHANGE for Agriculture & Food Security (CCAFS) and BIG DATA Platform
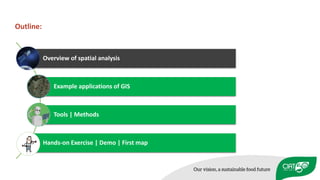
- 4. Overview of spatial analysis Example applications of GIS Tools | Methods Hands-on Exercise | Demo | First map Outline:
- 5. Source: Globcover, 2009. ESA 2010 and UCLouvain Important Questions? WHERE? WHEN? HOW? WHAT? Globally, agriculture covers ~37% (48.6M) of all land areas (Worldbank, 2015) Spatial analysis to aid policy and decision making
- 6. Environmental Phenomena are dynamic across space and time Source: Baseline: Worldclim (Hijmans, R.J., S.E. Cameron, J.L. Parra, P.G. Jones and A. Jarvis, 2005. Very high resolution interpolated climate surfaces for global land areas. International Journal of Climatology 25:1965-1978) Future: CIAT (International Center for Tropical Agricuture) and Future Earth. Spatial Downscaling Methods: CCAFS-Climate Data Portal. Available online: https://ccafs.cgiar.org/spatial- downscaling-methods DEM ŌĆō SRTM 30m Precipitation (Annual Prec.) Topography Access to water ŌĆó Environmental and production challenges are dynamic in space and time ŌĆō climate, topography, access to water (irrigation) ŌĆó New problems and opportunities are continually emerging- climate change, demography, market, etc. ŌĆó Timely and accurate agricultural information is essential for efficient planning and decision making at local and national scales
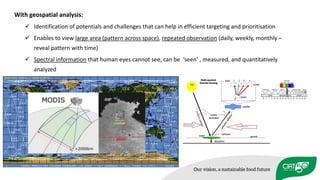
- 7. With geospatial analysis: ’ā╝ Identification of potentials and challenges that can help in efficient targeting and prioritisation ’ā╝ Enables to view large area (pattern across space), repeated observation (daily, weekly, monthly ŌĆō reveal pattern with time) ’ā╝ Spectral information that human eyes cannot see, can be ŌĆśseenŌĆÖ , measured, and quantitatively analyzed
- 8. False Color Composite Natural Color Composite Amplify information that are hard to see by the naked eye
- 9. Reflectance ’āĀ NDVI [Normalized Difference Vegetation Index] Lifted from Dr. Kyu-Sung Lee presentation. Year 2014 The amount of energy reflected by an object (received by the sensor). Different object/target reflect or absorb sunŌĆÖs radiation in different ways ’é¦ Material, physical (growth) , chemical state (moisture), surface roughness Vegetation Soil or bare ground Cloud
- 10. Data taken at different temporal intervals can reveal patterns that are important in detecting changes: Phenology, farmer practices, yield, stresses, anomaly Doy 153 Doy 161 Doy 169 Doy 177 Doy 185
- 12. Near-real time pan-tropical monitoring system for vegetation loss detection Anomalydetection
- 15. Using time series analysis to map crops Red pixels are crop/rice areas
- 16. Dry Season 0 0.1 0.2 0.3 0.4 0.5 0.6 001 033 065 097 129 161 193 225 257 289 321 353 VegetationIndex DOY Irrigated double crop rice Wet Season 0 0.05 0.1 0.15 0.2 0.25 0.3 0.35 001 033 065 097 129 161 193 225 257 289 321 353 Vegetationindex DOY Start of SeasonEnd of Season Rainfed Single Crop Flood in monsoon ŌĆō Rice in dry season Detection of cropping patterns/systems Spatio-temporal analysis can be used to detect changes in phenology and stress (plant growth, low rainfall -- drought, high rainfall -- flood) Identify characteristics of each agricultural productions units
- 17. Source: International Rice Research Institute. Rice cropping pattern in Myanmar, year 2015. Published but retracted Identify characteristics of each agricultural productions units
- 18. NDVI*10000 Year Year 1 . . . . . . . . . . . . . . . . . . . . . . . . . . . . . . . . . . . . . . . . . . . . . . . . . . . . . . . . . . . . . . . . . . . . . . . . . .Year16 ANOMALIES Identify stresses that affects agricultural production
- 19. Stress Mapping (Flood) Time Backscatter Established crop phenology Phenology interrupted by flood
- 20. // Filter by date yyyy-mm-dd var before = collection.filterDate('2015-09-01', '2015-09-30').mosaic(); // Filter by date yyyy-mm-dd var after = collection.filterDate('2015-10-01', '2015-10-30').mosaic();
- 21. http://newsinfo.inquirer.net/733370/look-lando-submerges-ricefields-in-pangasinan-and-tarlac-towns
- 22. Year Use data to detect unusual patterns (stress periods) Drought from Jan. to Mar. 2016 SOCCSKSARGEN Typical sowing starts at December from observed rice fields
- 23. Used for drought assessment in the Philippines for 2015, 2016 Accuracy Drought Presence (~85%), Drought Absence (~>90%) Source: IRRI drought assessment in Mindanao
- 24. Spatial modeling to assess risk of climate change to crops
- 25. Exposure 1: Sensitivity ŌĆ£Climate-Risk VulnerabilityŌĆØ Exposure 2: Hazards Pot. Impact Adaptive Capacity ŌĆ£Presence of an effect of climate changeŌĆØ Characteristics that defines different responses to effects of climate change Management Climate-Risk Vulnerability Assessment to identify priority areas for interventions