Geospatial Visualization for datascience
Download as PPTX, PDF0 likes35 views

Data Analytics on geospatial data set


![35
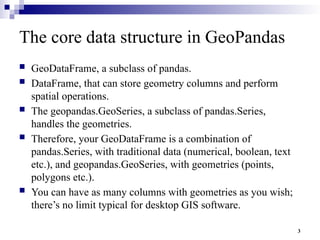
Adding better data insights into the
map
df = pd.read_csv('globallandslides.csv')
pd.set_option('display.max_columns', None)df = df[df.country_name=="India"]
df["Year"] = pd.to_datetime(df["event_date"]).dt.year
df = df[df.landslide_category=="landslide"]
state_df = ls_df["admin_division_name"].value_counts()
state_df = state_df.to_frame()
state_df.reset_index(level=0, inplace=True)
state_df.columns = ['State', 'Count']state_df.at[15,"Count"] = 69
state_df.at[0,"State"] = "Jammu and Kashmir" state_df.at[20,"State"] = "Delhi"
state_df.drop(7)](https://image.slidesharecdn.com/geospatialvisualization-241116084011-d71db708/85/Geospatial-Visualization-for-datascience-35-320.jpg)

![37
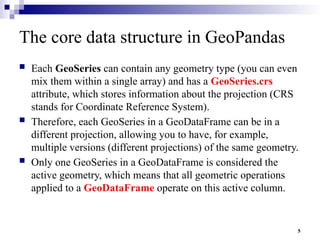
Merge the data
’ü« We can now merge this above state data which contains
landslide information with map_df shapefile. We will use the
State column of both the data frames for merging purposes.
#Merging the data
merged = map_df.set_index('st_nm').join(state_df.set_index('State'))
merged['Count'] = merged['Count'].replace(np.nan, 0)
merged.head()](https://image.slidesharecdn.com/geospatialvisualization-241116084011-d71db708/85/Geospatial-Visualization-for-datascience-37-320.jpg)
![38
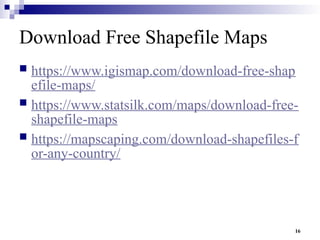
Plotting the data on the Shapefile
#Create figure and axes for Matplotlib and set the title
fig, ax = plt.subplots(1, figsize=(10, 10))
ax.axis('off')ax.set_title('Number of landslides in India state-wise',
fontdict={'fontsize': '20', 'fontweight' : '10'})# Plot the figure
merged.plot(column='Count',cmap='YlOrRd', linewidth=0.8, ax=ax,
edgecolor='0',legend=True,markersize=[39.739192, -104.990337],
legend_kwds={'label': "Number of landslides"})](https://image.slidesharecdn.com/geospatialvisualization-241116084011-d71db708/85/Geospatial-Visualization-for-datascience-38-320.jpg)


More Related Content
Similar to Geospatial Visualization for datascience (20)
More from Sivam Chinna (10)


Recently uploaded (20)


Geospatial Visualization for datascience
- 2. 2 What is Geopandas? ’ü« GeoPandas is an open-source project to make working with geospatial data in python easier. ’ü« GeoPandas is one of the most satisfying Python packages to use because it produces a tangible, visible output that is directly linked to the real world. ’ü« Here we will be exploring the method to create a geo map and visualize data over it, using shapefiles(.shp) and some other Python libraries.
- 3. 3 The core data structure in GeoPandas ’ü« GeoDataFrame, a subclass of pandas. ’ü« DataFrame, that can store geometry columns and perform spatial operations. ’ü« The geopandas.GeoSeries, a subclass of pandas.Series, handles the geometries. ’ü« Therefore, your GeoDataFrame is a combination of pandas.Series, with traditional data (numerical, boolean, text etc.), and geopandas.GeoSeries, with geometries (points, polygons etc.). ’ü« You can have as many columns with geometries as you wish; thereŌĆÖs no limit typical for desktop GIS software.
- 4. 4 The core data structure in GeoPandas
- 5. 5 The core data structure in GeoPandas ’ü« Each GeoSeries can contain any geometry type (you can even mix them within a single array) and has a GeoSeries.crs attribute, which stores information about the projection (CRS stands for Coordinate Reference System). ’ü« Therefore, each GeoSeries in a GeoDataFrame can be in a different projection, allowing you to have, for example, multiple versions (different projections) of the same geometry. ’ü« Only one GeoSeries in a GeoDataFrame is considered the active geometry, which means that all geometric operations applied to a GeoDataFrame operate on this active column.
- 6. 6 world map projections. ’ü« 1. Mercator ’é© This projection was developed by Gerardus Mercator back in 1569 for navigational purposes. ’é© Its ability to represent lines of constant course from coast to coast made it the perfect map for sailing the seas. ’é© Its popularity was so great that it became used as a geographic teaching aid even though the projection grossly distorts countries sizes. ’é© This is at its worst the closer you are to the poles. Greenland is 550% too big, it should fit into Africa 14 times!
- 7. 7 Vector Data: OpenGIS Simple Features / OCG Simple Feature Access Used in spatial databases (Postgresql/PostGIS), GIS, ŌĆ” WKT (Well known Text): ŌĆó Point, Multipoint ŌĆó LineString, MultiLineString ŌĆó Polygon, MultiPolygon ŌĆó GeometryCollection ŌĆó (TIN, Circle, Curve, Triangle, Surface, PolyhedralSurface, ŌĆ”) map projections.
- 8. 8 Examples
- 9. 9 Examples
- 10. 10 world map projections. ’ü« 1. Mercator ’é© This projection was developed by Gerardus Mercator back in 1569 for navigational purposes. ’é© Its ability to represent lines of constant course from coast to coast made it the perfect map for sailing the seas. ’é© Its popularity was so great that it became used as a geographic teaching aid even though the projection grossly distorts countries sizes. ’é© This is at its worst the closer you are to the poles. Greenland is 550% too big, it should fit into Africa 14 times!
- 11. 11 Map projections. ’ü« 2. Robinson ’ü« This map is known as a ŌĆścompromiseŌĆÖ, it shows neither the shape or land mass of countries correct. ’ü« Arthur Robinson developed it in 1963 using a more visual trial and error development. ’ü« Our Classic world map uses the Robinson projection and is a contemporary tribute to the familiar schoolroom map and is perfect for map-lovers of all ages..
- 12. 12 map projections ’ü« 3. Dymaxion Map ’ü« This projection was released by R Buckminster Fuller in 1954 after several decades working on it. ’ü« The world is projected onto the surface of a icosahedron, allowing it to be unfolded and flattened in two dimensions. ’ü« It is said to represent the EarthŌĆÖs continents as ŌĆ£one islandŌĆØ.
- 13. 13 map projections ’ü« 4. Gall-Peters ’ü« This is a cylindrical world map projection, that regains accuracy in surface area. ’ü« It is named after James Gall and Arno Peters. Whilst Gall, first described the projection in 1855 it was not until 1973 when Peters, began to heavily market the projection as the ŌĆśPeters World MapŌĆÖ that it became popular.
- 14. 14 map projections 5. Sinu-Mollweide ’ü« Developed in 1953 by Allen K Philbrick, this projection fuses the Sinusoidal projection , which was first used in the 16th Century, with Karl Brandan Mollweide's map of 1805 and challenges our assumption of how the flattened globe should look. ’ü« Still an equal area projection that maintains fidelity of area, we like this projection for its bold graphic view.
- 15. 15 map projections ’ü« 6 Winkel Tripel ’é© A globe that is projected onto a flat surface giving it curved lines of latitude and curved meridians. ’é© The projection, by Oswald Winkel in1921 was developed with the goal of minimizing the three kinds of distortion: area, direction and distance. ’é© Thus it became the Tripel Projection (German for triple). ’é© The projection is neither equal-area nor conformal, its main feature is that all of the parallels are curved except for the straight poles and equator. ’é© This gives a lovely spherical feeling to this two dimensional map.
- 16. 16 Download Free Shapefile Maps ’ü« https://www.igismap.com/download-free-shap efile-maps/ ’ü« https://www.statsilk.com/maps/download-free- shapefile-maps ’ü« https://mapscaping.com/download-shapefiles-f or-any-country/
- 17. 17 GeoPandas packages: ’ü« pandas ’ü« shapely ’ü« fiona ’ü« pyproj ’ü« packaging ’ü« Further, matplotlib is an optional dependency, required for plotting. ’ü« GeoPandas using the conda package manager.
- 18. 18 Reading and writing files ’ü« Assuming you have a file containing both data and geometry (e.g. GeoPackage, GeoJSON, Shapefile), you can read it using geopandas.read_file(), ’ü« which automatically detects the filetype and creates a GeoDataFrame. ’ü« This tutorial uses the "nybb" dataset, a map of New York boroughs, which is available through the geodatasets package. ’ü« Therefore, we use geodatasets.get_path() to download the dataset and retrieve the path to the local copy.
- 19. 19 Reading and writing files ’ü« Assuming you have a file containing both data and geometry (e.g. GeoPackage, GeoJSON, Shapefile), you can read it using geopandas.read_file(), ’ü« which automatically detects the filetype and creates a GeoDataFrame. ’ü« This tutorial uses the "nybb" dataset, a map of New York boroughs, which is available through the geodatasets package. ’ü« Therefore, we use geodatasets.get_path() to download the dataset and retrieve the path to the local copy.
- 20. 20 Writing files ’ü« To write a GeoDataFrame back to file use GeoDataFrame.to_file(). ’ü« The default file format is Shapefile, but you can specify your own with the driver keyword.
- 21. 21 Simple accessors and methods ’ü« Now we have our GeoDataFrame and can start working with its geometry. ’ü« Since there was only one geometry column in the New York Boroughs dataset, this column automatically becomes the active geometry and spatial methods used on the GeoDataFrame will be applied to the "geometry" column.
- 22. 22 Simple accessors and methods Measuring area ’ü« To measure the area of each polygon (or MultiPolygon in this specific case), access the GeoDataFrame.area attribute, which returns a pandas.Series. ’ü« Note that GeoDataFrame.area is just GeoSeries.area applied to the active geometry column.
- 23. 23 Simple accessors and methods Getting polygon boundary and centroid ’ü« To get the boundary of each polygon (LineString), access the GeoDataFrame.boundary: ’ü« Since we have saved boundary as a new column, we now have two geometry columns in the same GeoDataFrame.
- 24. 24 Simple accessors and methods Getting polygon boundary and centroid ’ü« To get the boundary of each polygon (LineString), access the GeoDataFrame.boundary: ’ü« Since we have saved boundary as a new column, we now have two geometry columns in the same GeoDataFrame.
- 25. 25 Simple accessors and methods Measuring distance ’ü« We can also measure how far each centroid is from the first centroid location. ’ü« Note that geopandas.GeoDataFrame is a subclass of pandas.DataFrame, so we have all the pandas functionality available to use on the geospatial dataset ŌĆö we can even perform data manipulations with the attributes and geometry information together.
- 26. 26 Making maps ’ü« GeoPandas can also plot maps, so we can check how the geometries appear in space. ’ü« To plot the active geometry, call GeoDataFrame.plot(). ’ü« To color code by another column, pass in that column as the first argument. ’ü« In the example below, we plot the active geometry column and color code by the "area" column. We also want to show a legend (legend=True).
- 27. 27 Making maps
- 28. 28 Making maps ’ü« You can also explore your data interactively using GeoDataFrame.explore(), which behaves in the same way plot() does but returns an interactive map instead.
- 29. 29 Making maps ’ü« Switching the active geometry (GeoDataFrame.set_geometry) to centroids, we can plot the same data using point geometry..
- 30. 30 Making maps ’ü« And we can also layer both GeoSeries on top of each other. We just need to use one plot as an axis for the other.
- 31. 31 Step 1 : Installing GeoPandas and Shapely ’ü« need to install the GeoPandas and Shapely libraries in order to plot a map, and these libraries do not come with the Anaconda download. ’ü« through the conda-forge channel with the following command from your terminal ’ü« or alternatively ’ü« Shapely can be pip installed with the command conda install -c conda-forge geopandas pip install geopandas pip install shapely
- 32. 32 Importing the libraries ’ü« Importing the libraries import numpy as np import pandas as pd import matplotlib.pyplot as plt import seaborn as sns import geopandas as gpd import shapefile as shp from shapely.geometry import Point sns.set_style('whitegrid')
- 33. 33 Load the data ’ü« Use india-polygon.shp shape file to plot India map ’ü« Load the data into a GeoDataFrame as shown below. fp = rŌĆÖ india-polygon.shp' map_df = gpd.read_file(fp) map_df_copy = gpd.read_file(fp) map_df.head()
- 34. 34 Plotting the Shapefiles ’ü« One nice thing about downloading a GeoDataFrame, is that weŌĆÖve already got enough info to make a basic plot. map_df.plot()
- 35. 35 Adding better data insights into the map df = pd.read_csv('globallandslides.csv') pd.set_option('display.max_columns', None)df = df[df.country_name=="India"] df["Year"] = pd.to_datetime(df["event_date"]).dt.year df = df[df.landslide_category=="landslide"] state_df = ls_df["admin_division_name"].value_counts() state_df = state_df.to_frame() state_df.reset_index(level=0, inplace=True) state_df.columns = ['State', 'Count']state_df.at[15,"Count"] = 69 state_df.at[0,"State"] = "Jammu and Kashmir" state_df.at[20,"State"] = "Delhi" state_df.drop(7)
- 36. 36 ’ü« data of the number of landslides that have happened in each state over the years
- 37. 37 Merge the data ’ü« We can now merge this above state data which contains landslide information with map_df shapefile. We will use the State column of both the data frames for merging purposes. #Merging the data merged = map_df.set_index('st_nm').join(state_df.set_index('State')) merged['Count'] = merged['Count'].replace(np.nan, 0) merged.head()
- 38. 38 Plotting the data on the Shapefile #Create figure and axes for Matplotlib and set the title fig, ax = plt.subplots(1, figsize=(10, 10)) ax.axis('off')ax.set_title('Number of landslides in India state-wise', fontdict={'fontsize': '20', 'fontweight' : '10'})# Plot the figure merged.plot(column='Count',cmap='YlOrRd', linewidth=0.8, ax=ax, edgecolor='0',legend=True,markersize=[39.739192, -104.990337], legend_kwds={'label': "Number of landslides"})
- 39. 39 Plotting the data on the Shapefile
- 40. 40 plot the latitudes and longitudes ’ü« We can also plot the latitudes and longitudes of the occurred landslides on the map along with the names of states as shown below. ’ü« For this, you will need to find the shapefile data for Indian states and their latitudes and longitudes. ’ü« have to plot data points on the map..
- 41. 41