Graph
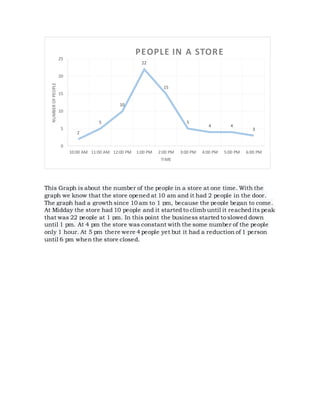
- 1. This Graph is about the number of the people in a store at one time. With the graph we know that the store opened at 10 am and it had 2 people in the door. The graph had a growth since 10 am to 1 pm, because the people began to come. At Midday the store had 10 people and it started to climb until it reached its peak that was 22 people at 1 pm. In this point the business started to slowed down until 1 pm. At 4 pm the store was constant with the some number of the people only 1 hour. At 5 pm there were 4 people yet but it had a reduction of 1 person until 6 pm when the store closed. 2 5 10 22 15 5 4 4 3 0 5 10 15 20 25 10:00 AM 11:00 AM 12:00 PM 1:00 PM 2:00 PM 3:00 PM 4:00 PM 5:00 PM 6:00 PM NUMBEROFPEOPLE TIME PEOPLE IN A STORE

