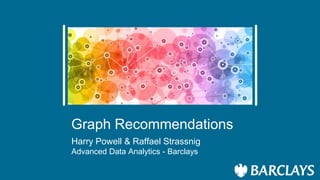


![Spark implementation of Absorbing Transition
Matrix
[Spark code]
Has unacceptably high complexity (ð(ð4)) due to inverting large matrix](https://image.slidesharecdn.com/expecteddegreesofseparationstrataiii-170607203728/85/Graph-Recommendations-18-320.jpg)


Graph Recommendations
- 1. Graph Recommendations Harry Powell & Raffael Strassnig Advanced Data Analytics - Barclays
- 2. Customer values and recommendation engines Understanding customer values is a similar problem to recommendation â How is Tesco similar to Asda? â How is Tesco in Bristol similar to Asda in Bath? â How is Tesco in Bristol similar to Bristol Angling Centre? Assume that the similarity of two businesses can be inferred by the extent to which they share customers
- 3. The data: Customer transactions Timestam p Customer Business Amount (ÂĢ) âĶ Bob Smith Tesco, Bristol âĶ âĶ Mary Jones Tesco, Bristol âĶ âĶ Bob Smith Asda, Bath âĶ âĶ John Taylor Bristol Angling Centre âĶ
- 4. Transactional data can be seen as a bipartite graph Tesco Asda BP Boots Timestam p CustomerI D MerchantName Amount (ÂĢ) âĶ 1 Tesco âĶ âĶ 1 Asda âĶ âĶ 2 Boots âĶ âĶ 2 BP âĶ âĶ 3 Tesco âĶ âĶ 3 Boots âĶ âĶ 3 BP âĶ âĶ 4 Asda âĶ
- 5. Transactions imply customer preferences over business values Tesco ïē Price Quality Boots ïē Health ? Price ? ? Quality ? Asda ïē Price Customer Business
- 6. Problems with conventional similarity metrics Conventional recommenders (say Cosine similarity) are useless in sparsely connected networks ðīð ðð = ð = (1,1,1,0,1,1,0,0) ððð ðð = ð = 1,0,1,0,1,1,0,1 ð â ð = ð ð cos ð Customer Tesco Asda Bob Smith Yes Yes Mary Jones No Yes John Taylor Yes Yes Jane Williams No No Gary Brown Yes Yes Liz Davis Yes Yes David Evans No No Helen Wilson Yes No
- 7. Problems with conventional graph metrics Conventional graph metrics (say minimum distance) are useless in networks with significant hubs.
- 8. Inferring latent preferences from n-degree separation Tesco Boots Asda Lloyds Pharmacy
- 9. Tesco Asda BP Boots Expected Degrees of Separation
- 10. Can factorise out to homogeneous graph Tesco Asda BP BootsTesco Asda BP Boots Tesco Asda BP Boots ð ðī ðĩ
- 11. Large number of paths Each node has a few thousand outgoing edges Destination Business a d aa b c bc d d
- 14. Scalability problems with trees Where ð = 1,000,000 Actually ð starts at a few thousand for low ð, but quickly escalates ð ð ððĒððð ððððð à (ð â 1) ððð ðĄððððĄððð ððððð à ð ððððĄâ à (ð â 1) ððððð ððĄ ðððâ ð ðĄðð â ð ð3 ð
- 15. Elimination of insignificant paths Aggregate of all nodes/paths below threshold probability
- 16. Comparing PageRank and Asymptotic EDS PageRank: stationary distribution non-absorbing (eigenvector) EDS: we would like to know how far we need to go (on average) to hit B starting from A Comment on ergodicity and teleporting ï Teleporting solely mechanism to get around non-ergodic graphs ï We assume a connected graph (eliminate graphs that only have customers that solely shop with them) natural for retail not for websites.
- 17. Absorbing transition matrix Discrete phase type distribution â Computes EDS for all sources to single destination â Gives exact results ð = ð ðĄ 0 1 , ðļð·ð = ðž â ð â1
- 18. Spark implementation of Absorbing Transition Matrix [Spark code] Has unacceptably high complexity (ð(ð4)) due to inverting large matrix
- 19. Estimating EDS using path sampling An alternative is a sampling approach which is fully distributable â Complexity = ð(ð Ã ð Ã ð) â Converges to analytical solution Cautions â Shorter path length can have high variance (ð < 4) â Signal dilution (applies to exact solution too)
- 20. Spark implementation of sampling methodology Convergence fails when paths too long
- 21. Results
- 22. Results MCDONALDS PRIMARK STORES LTD PRIMARK STORES LTD 90.8 MCDONALDS 53.7 LIDL 105.3 LIDL 105.0 BOOTS 121.2 BOOTS 120.1 ALDI 123.2 ALDI 122.8 MARKS&SPENCER PLC 126.9 MARKS&SPENCER PLC 126.2 POST OFFICE COUNTER 128.2 POST OFFICE COUNTER 128.2 GREGGS PLC 154.1 GREGGS PLC 154.2
- 23. Results vs Pagerank Pagerank EDS SEVERN RIVER CROSSIN PLC MCDONALDS MCDONALDS PRIMARK STORES LDT POST OFFICE COUNTER LIDL LIDL BOOTS PRIMARK STORES ALDI ALDI MARKS&SPENCER PLC MARTIN MCCOLL POST OFFICE COUNTER MARKS&SPENCER PLC GREGGS PLC
- 24. Results Results arenât much use because of low differentiation between shops Once you have escaped vicinity of a shop reverts to random walk. Certain nodes connect everything (MCDONALDS, IKEA) Theoretically interesting metric â but not insightful
- 25. Localised EDS
- 26. Localised EDS ð = ð ðĄ 0 1 We use that ð ð which yields the results for the k-neighbourhood Set k according to the problem at hand (eg. 5, 10, 20, âĶ)
- 27. Spark implementation of Localised EDS
- 28. Brute force GPU implementation of Localised EDS Brute force matrix multiplication using GPUs Parallelisation can be achieved by destination node Sort-of scales (ð(ð . ð3 ) ) as long as matrix fits into memory Can be faster than Spark
- 29. Compare results from EDS and Localised EDS STARBUCKS BS16 Starbucks BS 35 1.51 McDonalds 54.0 KFC 2.04 Primark Stores 90.9 Krispy Creme 3.11 Lidl 105.9 The Old Fish Market Pub 4.8 Boots 120.2 IKEA 6.74 Marks & Spencer 126.3
- 30. Summary âĒ We used a probabilistic graph similarity metric to derive a richer characterisation of customer behaviour âĒ We implemented a number of approaches to estimate it âĒ All had complexity/scalability challenges âĒ Use it yourselves and share what you find! Further work âĒ Derive the statistical properties of the EDS âĒ Explore methods for approximation of matrix multiplication
- 31. Data Science Section âĶ.coming soon!
Editor's Notes
- #2: Introduction to Barclays Advanced Data Analytics (ADA) ADA is a data science team which innovates, designs and builds applications that deliver, direct to customers, relevant analytical content that will help them make smart decisions to improve their lives. We are aim to make applications that will revolutionise the way Barclays relates to our customers. The long term vision is to give each of our customers the same level of engagement and support in planning their finances and their lives as they would have if they were billionaires.