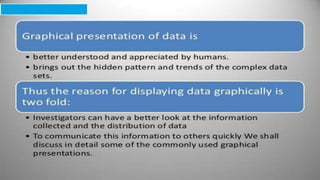
Graphical representation of data in excel
•Download as PPTX, PDF•
2 likes•7,582 views

This document discusses graphical representations used in data visualization. It covers bar charts, line diagrams, histograms, and pie diagrams as common types of diagrams. Line graphs are defined as using line segments to connect data points and show changes over time. The document was written by Anum Maqsood, a 7th semester student at GCET FSd.


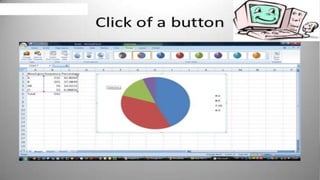

Graphical representation of data in excel
- 1. TOPIC : GRAPHICAL REPRESENTATION Name Anum Maqsood Roll no 5 Semester 7th GCET FSd.
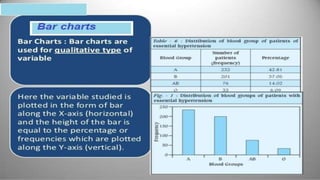
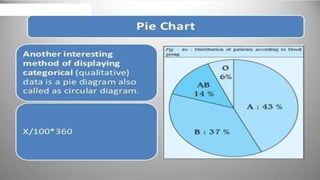
- 3. Types of diagrams Bar charts Line diagram Histogram Pie diagram
- 6. Line graphs • Graphs represents by line segment may be considered as line graphs. • Line graph is a graph that uses line segments to count data points and shows changes in data over time.
- 10. Thanks