ݺߣ

ݺߣShare a Scribd company logo
Particulars         200603    200703    200803    200903    201003 CAGR

Equity              4982.08   6230.04   8140.71   9477.58   7145.37     9.43%
Debt                1979.67   2951.56   3201.87   3394.95   1037.62   -14.91%

DTA                  584.38    582.55    606.87    864.37    252.16   -18.95%

                    7546.13   9764.15 11949.45    13736.9   8435.15    2.82%


Particulars         200603    200703    200803    200903    201003

Equity              1046.12   1773.51   2708.32   3618.08   4627.07
Debt                1451.99   1578.63    1740.5   2142.87   1607.07

DTA                  577.55    562.09    545.38    727.56    835.55

                    3075.66   3914.23    4994.2   6488.51   7069.69


                         Consolidated(holding in ultratech is through 100%
Particulars         200603    200703    200803    200903    201003

Equity              4982.08   6230.04   8140.71   9477.58   7145.37
Debt                3431.66   4530.19   4942.37   5537.82   2644.69

DTA                  1161.93 1144.64 1152.25 1591.93 1087.71
Minority interest     1516.3 1929.715 2462.141 3198.835 3485.357
                    11091.97 13834.59 16697.47 19806.17 14363.13
Grasim
          Particulars        200603      200703      200803      200903      201003      CAGR

          Net Fixed Assets    3311.03     4597.12     7053.96     8307.77     1829.04     -13.79%
          Investments         3481.71      4274.7     4080.79      4609.1     6324.79      16.09%
          Cash                 155.58      116.38      127.47      113.38       15.92     -43.44%
          NCWC                 597.81      775.95      687.23      706.65       265.4     -18.37%

                              7546.13     9764.15    11949.45    13736.90     8435.15       2.82%


          Ultratech
          Particulars        200603      200703      200803      200903      201003

          Net Fixed Assets    2,710.91    3,242.94    4,808.89    5,340.15    5,224.83
          Investments           148.15      459.21      146.66    1,009.49    1,636.68
          Cash                   68.39      100.11       114.3      104.68      111.69
          NCWC                  148.21      111.97      -75.65       34.17       96.47

                              3,075.66    3,914.23    4,994.20    6,488.51    7,069.69


g in ultratech is through 100% equity)
          Particulars        200603      200703      200803      200903      201003

          Net Fixed Assets    6,021.94    7,840.06   11,862.85   13,647.92    7,053.87
          Investments         1,922.35    2,290.19    1,548.73    1,319.43    2,740.46
          Cash                  223.97      216.49      241.77      218.06      127.61
          NCWC                  746.02      887.92      611.58      740.82      361.87
          Good will           2,177.69    2,599.93    2,432.54    3,879.94    4,079.32
                             11,091.97   13,834.59   16,697.47   19,806.17   14,363.13
At the consolidated level, on account of the demerger of the Cement
Business, while there is no change in the Revenue and Operating Profit
of the Company, Net Profit after minority share stands at Rs.3,096
crores. Net Profit after minority share has been impacted due to the
differential tax rate and minority share (35%) of Samruddhi,
representing shares to be issued to Grasim s shareholders in terms of
the demerger scheme.
Gross Block                       6126.88    6785.3   7592.54 11061.67
Less : Accumulated Depreciation   3109.49   3380.53   3564.89 3972.54
Net Block                         3017.39   3404.77   4027.65 7089.13
Capital Work in Progress           293.64   1192.35   3026.31 1218.64
Investments                       3481.71    4274.7   4080.79   4609.1
3102.16
 1316.1
1786.06
  42.98   3311.03   4597.12   7053.96   8307.77   1829.04
6324.79

More Related Content

Grasim

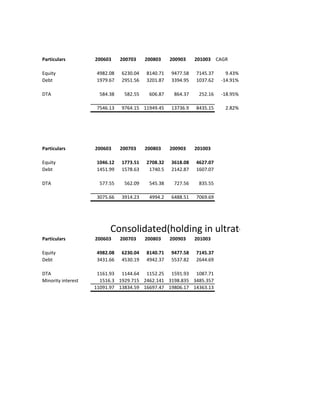
  • 1. Particulars 200603 200703 200803 200903 201003 CAGR Equity 4982.08 6230.04 8140.71 9477.58 7145.37 9.43% Debt 1979.67 2951.56 3201.87 3394.95 1037.62 -14.91% DTA 584.38 582.55 606.87 864.37 252.16 -18.95% 7546.13 9764.15 11949.45 13736.9 8435.15 2.82% Particulars 200603 200703 200803 200903 201003 Equity 1046.12 1773.51 2708.32 3618.08 4627.07 Debt 1451.99 1578.63 1740.5 2142.87 1607.07 DTA 577.55 562.09 545.38 727.56 835.55 3075.66 3914.23 4994.2 6488.51 7069.69 Consolidated(holding in ultratech is through 100% Particulars 200603 200703 200803 200903 201003 Equity 4982.08 6230.04 8140.71 9477.58 7145.37 Debt 3431.66 4530.19 4942.37 5537.82 2644.69 DTA 1161.93 1144.64 1152.25 1591.93 1087.71 Minority interest 1516.3 1929.715 2462.141 3198.835 3485.357 11091.97 13834.59 16697.47 19806.17 14363.13
  • 2. Grasim Particulars 200603 200703 200803 200903 201003 CAGR Net Fixed Assets 3311.03 4597.12 7053.96 8307.77 1829.04 -13.79% Investments 3481.71 4274.7 4080.79 4609.1 6324.79 16.09% Cash 155.58 116.38 127.47 113.38 15.92 -43.44% NCWC 597.81 775.95 687.23 706.65 265.4 -18.37% 7546.13 9764.15 11949.45 13736.90 8435.15 2.82% Ultratech Particulars 200603 200703 200803 200903 201003 Net Fixed Assets 2,710.91 3,242.94 4,808.89 5,340.15 5,224.83 Investments 148.15 459.21 146.66 1,009.49 1,636.68 Cash 68.39 100.11 114.3 104.68 111.69 NCWC 148.21 111.97 -75.65 34.17 96.47 3,075.66 3,914.23 4,994.20 6,488.51 7,069.69 g in ultratech is through 100% equity) Particulars 200603 200703 200803 200903 201003 Net Fixed Assets 6,021.94 7,840.06 11,862.85 13,647.92 7,053.87 Investments 1,922.35 2,290.19 1,548.73 1,319.43 2,740.46 Cash 223.97 216.49 241.77 218.06 127.61 NCWC 746.02 887.92 611.58 740.82 361.87 Good will 2,177.69 2,599.93 2,432.54 3,879.94 4,079.32 11,091.97 13,834.59 16,697.47 19,806.17 14,363.13
  • 3. At the consolidated level, on account of the demerger of the Cement Business, while there is no change in the Revenue and Operating Profit of the Company, Net Profit after minority share stands at Rs.3,096 crores. Net Profit after minority share has been impacted due to the differential tax rate and minority share (35%) of Samruddhi, representing shares to be issued to Grasim s shareholders in terms of the demerger scheme.
  • 4. Gross Block 6126.88 6785.3 7592.54 11061.67 Less : Accumulated Depreciation 3109.49 3380.53 3564.89 3972.54 Net Block 3017.39 3404.77 4027.65 7089.13 Capital Work in Progress 293.64 1192.35 3026.31 1218.64 Investments 3481.71 4274.7 4080.79 4609.1
  • 5. 3102.16 1316.1 1786.06 42.98 3311.03 4597.12 7053.96 8307.77 1829.04 6324.79