Growth chart
- 2. INTRODUCTION âĒ Called as the road-to-health âĒ Developed by David Morley and later modified by WHO âĒ Displays childâs growth and development âĒ Primarily for longitudinal follow up ( growth monitoring) âĒ Helps to identify changes over time âĒ The mostly used parameter in growth is weight for age. âĒ Because weight is the most sensitive measure and itâs deviation from normal can be easily detected âĒ Height not considered-Cos a child cannot lose height âĒ Growth cart is a simple and inexpensive tool
- 3. WHO CHILD GROWTH STANDARD âĒ Developed by multicentre growth reference study(MGRS) âĒ Conducted from 1997-2003 in Brazil Ghana India Oman and USA âĒ Data collected from 9440 healthy breast feed infants and young children (0- 60months) âĒ The new WHO standard adopted in 2006 âĒ It can be used to assess children everywhere regardless of ethnicity socioeconomic status and type of feeding. âĒ Formerly used Charts were NCHS growth chart which had notable difference from the new WHO groth chart.
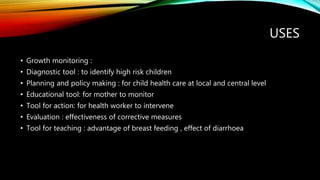
- 4. USES âĒ Growth monitoring : âĒ Diagnostic tool : to identify high risk children âĒ Planning and policy making : for child health care at local and central level âĒ Educational tool: for mother to monitor âĒ Tool for action: for health worker to intervene âĒ Evaluation : effectiveness of corrective measures âĒ Tool for teaching : advantage of breast feeding , effect of diarrhoea
- 5. GROWTH CHART USED IN INDIA âĒ India adopted the new WHO child growth standard in February 2009 âĒ Under NATIONAL RURAL HEALTH MISSION and the ICDS
- 8. âĒ The chart show Normal zone Of weight for age, undernutrition( 2SD) and severely underweight zone (below 3SD) âĒ It is the direction of growth more important than the position of dots on the line. âĒ flattening or falling of the childâs weight curve signal growth failure which is the earliest sign of PEM and may precede clinical signs
- 9. The objective is to keep the child in normal zone by giving special care to high risk children


