GRR Made Easy
0 likes587 views

The document discusses the analysis of Gage Repeatability and Reproducibility (GRR) focusing on simplifying the understanding of boundary conditions for test engineers. It outlines two critical boundary conditions for measurement error requirements and methods like ANOVA and Xbar&R for analysis, emphasizing the importance of sample selection and placement. Additionally, it highlights the necessity of managing instrument errors to ensure that GRR objectives for testing devices are met.


GRR Made Easy
- 2. When looking at GRR and MSA all the information is ŌĆ£EXACTLY CORRECTŌĆØ There is however a LOT of detailed information to understand 2
- 3. Is there a way to make it simpler to understand and implement? Especially for Test Engineers? 3
- 4. YES!! 4
- 5. There are 2 boundary conditions that a test engineer can understand that are only ŌĆ£SometimesŌĆØ shown 5
- 6. This is the ’¼ürst!! 6
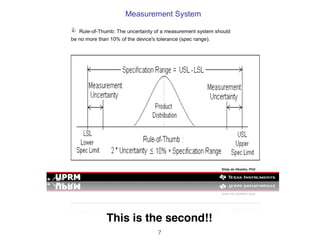
- 7. This is the second!! 7
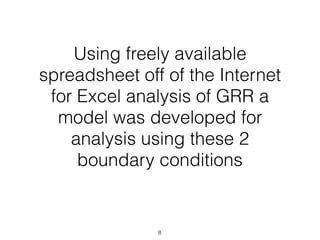
- 8. Using freely available spreadsheet off of the Internet for Excel analysis of GRR a model was developed for analysis using these 2 boundary conditions 8
- 9. Test Engineers have been told to follow 2 boundary conditions 1. The error in the measurement has to be 10 times less than the measured value. 2. The error between the USL and LSL has to be 10% of the difference between USL and LSL X Instrument Error 0 2X Instrument Error LSL USL ╬öCV ╬öCV - Boundary Condition # 2 LCV - Boundary Condition # 1 Test Engineering Boundary Conditions LCV Where USL = Upper Speci’¼üca>on Limit LSL = Lower Speci’¼üca>on Limit LCV = Lowest Capable Value ╬öCV = USL - LSL = Di’¼Ćeren>al Capability The variable, the RED ŌĆ£XŌĆØ, needs to be understood 9
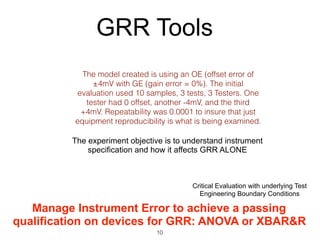
- 10. GRR Tools Critical Evaluation with underlying Test Engineering Boundary Conditions The model created is using an OE (offset error of ┬▒4mV with GE (gain error = 0%). The initial evaluation used 10 samples, 3 tests, 3 Testers. One tester had 0 offset, another -4mV, and the third +4mV. Repeatability was 0.0001 to insure that just equipment reproducibility is what is being examined. Manage Instrument Error to achieve a passing qualification on devices for GRR: ANOVA or XBAR&R The experiment objective is to understand instrument specification and how it affects GRR ALONE 10
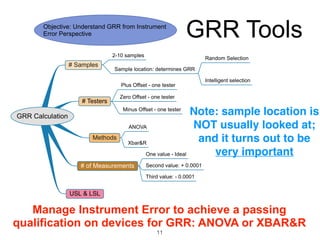
- 11. GRR Tools Manage Instrument Error to achieve a passing qualification on devices for GRR: ANOVA or XBAR&R GRR Calculation # Samples # Testers Methods # of Measurements USL & LSL Objective: Understand GRR from Instrument Error Perspective 2-10 samples Sample location: determines GRR Random Selection Intelligent selection Plus Offset - one tester Zero Offset - one tester Minus Offset - one tester ANOVA Xbar&R One value - Ideal Second value: + 0.0001 Third value: - 0.0001 Note: sample location is NOT usually looked at; and it turns out to be very important 11
- 12. How do these affect GRR Results ŌĆó There are essentially 2 methods for doing GRR ŌĆó ANOVA ŌĆó Xbar&R ŌĆó Spreadsheets for each can be found on the internet free of charge. Some with just one of the methods or the other, and at least one with both methods in the spreadsheet. ŌĆó Each method was confirmed to give the same results with identical data when comparing ANOVA to ANOVA and Xbar&R to Xbar&R 12
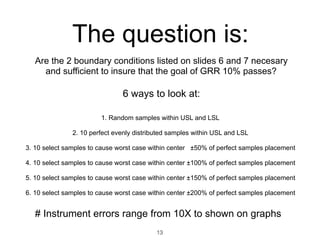
- 13. The question is: Are the 2 boundary conditions listed on slides 6 and 7 necesary and sufficient to insure that the goal of GRR 10% passes? 1. Random samples within USL and LSL 2. 10 perfect evenly distributed samples within USL and LSL 3. 10 select samples to cause worst case within center ┬▒50% of perfect samples placement 4. 10 select samples to cause worst case within center ┬▒100% of perfect samples placement 5. 10 select samples to cause worst case within center ┬▒150% of perfect samples placement 6. 10 select samples to cause worst case within center ┬▒200% of perfect samples placement 6 ways to look at: # Instrument errors range from 10X to shown on graphs 13
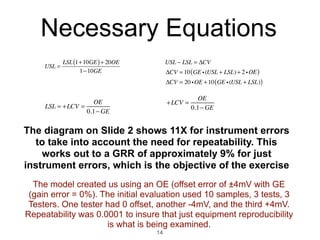
- 14. Necessary Equations The diagram on ║▌║▌▀Ż 2 shows 11X for instrument errors to take into account the need for repeatability. This works out to a GRR of approximately 9% for just instrument errors, which is the objective of the exercise USL = LSL 1+10GE( )+ 20OE 1ŌłÆ10GE USL ŌłÆ LSL = ╬öCV ╬öCV = 10 GE i(USL + LSL)+ 2 iOE( ) ╬öCV = 20 iOE +10 GE i(USL + LSL)( ) LSL = +LCV = OE 0.1ŌłÆ GE +LCV = OE 0.1ŌłÆ GE The model created us using an OE (offset error of ┬▒4mV with GE (gain error = 0%). The initial evaluation used 10 samples, 3 tests, 3 Testers. One tester had 0 offset, another -4mV, and the third +4mV. Repeatability was 0.0001 to insure that just equipment reproducibility is what is being examined. 14
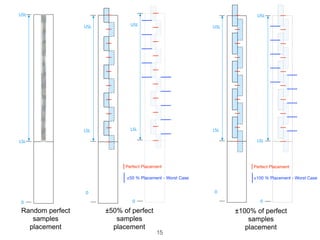
- 15. 0 LSL USL ┬▒100% of perfect samples placement ┬▒50% of perfect samples placement 0 LSL USL Random perfect samples placement 0 LSL USL Perfect Placement ┬▒100 % Placement - Worst Case 0 LSL USL 0 LSL USL Perfect Placement ┬▒50 % Placement - Worst Case 15
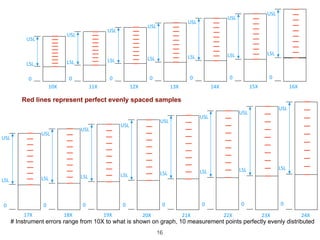
- 16. # Instrument errors range from 10X to what is shown on graph, 10 measurement points perfectly evenly distributed 0 LSL USL 10X 11X 0 LSL USL 12X 0 LSL USL 13X 0 LSL USL 14X 0 LSL USL 15X 0 LSL USL 16X 0 LSL USL 24X 0 LSL USL 23X 0 LSL USL 22X 0 LSL USL 21X 0 LSL USL 20X 0 LSL USL 19X 0 LSL USL 18X 0 LSL USL 17X 0 LSL USL Red lines represent perfect evenly spaced samples 16
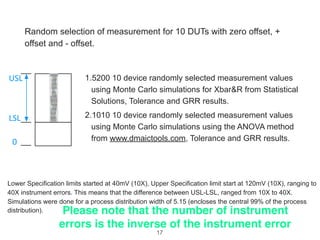
- 17. Random selection of measurement for 10 DUTs with zero offset, + offset and - offset. 1.5200 10 device randomly selected measurement values using Monte Carlo simulations for Xbar&R from Statistical Solutions, Tolerance and GRR results. 2.1010 10 device randomly selected measurement values using Monte Carlo simulations using the ANOVA method from www.dmaictools.com, Tolerance and GRR results. Lower Specification limits started at 40mV (10X), Upper Specification limit start at 120mV (10X), ranging to 40X instrument errors. This means that the difference between USL-LSL, ranged from 10X to 40X. Simulations were done for a process distribution width of 5.15 (encloses the central 99% of the process distribution). 0 LSL USL Please note that the number of instrument errors is the inverse of the instrument error 17
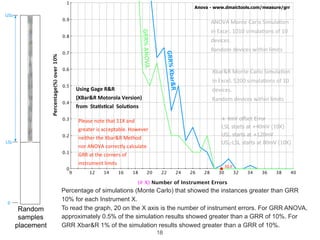
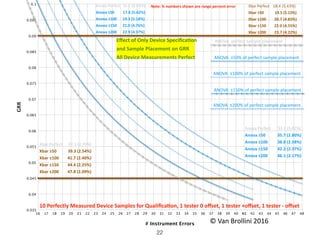
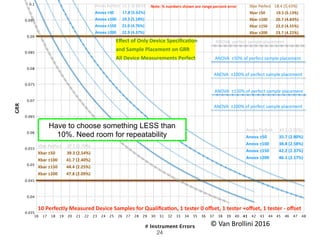
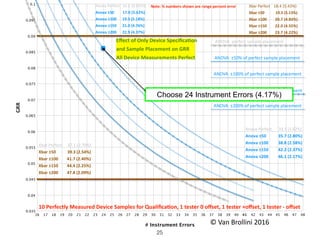
- 18. 409 12 14 16 18 20 22 24 26 28 30 32 34 36 38 1 0 0.1 0.2 0.3 0.4 0.5 0.6 0.7 0.8 0.9 (# X) Number of Instrument Errors Percentage(%)over10% GRR% Xbar&R Xbar&R Monte Carlo Simula3on in Excel. 5200 simula3ons of 10 devices. Random devices within limits Using Gage R&R (XBar&R Motorola Version) from Sta;s;cal Solu;ons Please note that 11X and greater is acceptable. However neither the Xbar&R Method nor ANOVA correctly calculate GRR at the corners of instrument limits GRR% ANOVA ANOVA Monte Carlo Simula3on in Excel. 1010 simula3ons of 10 devices. Random devices within limits ┬▒ 4mV offset Error LSL starts at +40mV (10X) USL starts at +120mV USL-LSL starts at 80mV (10X) Anova - www.dmaictools.com/measure/grr 30.0 Percentage of simulations (Monte Carlo) that showed the instances greater than GRR 10% for each Instrument X. To read the graph, 20 on the X axis is the number of instrument errors. For GRR ANOVA, approximately 0.5% of the simulation results showed greater than a GRR of 10%. For GRR Xbar&R 1% of the simulation results showed greater than a GRR of 10%. 0 LSL USL Random samples placement 18
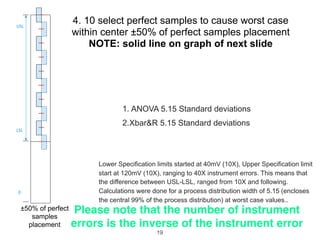
- 19. 4. 10 select perfect samples to cause worst case within center ┬▒50% of perfect samples placement NOTE: solid line on graph of next slide 1. ANOVA 5.15 Standard deviations 2.Xbar&R 5.15 Standard deviations Lower Specification limits started at 40mV (10X), Upper Specification limit start at 120mV (10X), ranging to 40X instrument errors. This means that the difference between USL-LSL, ranged from 10X and following. Calculations were done for a process distribution width of 5.15 (encloses the central 99% of the process distribution) at worst case values.. 0 LSL USL ┬▒50% of perfect samples placement Please note that the number of instrument errors is the inverse of the instrument error 19
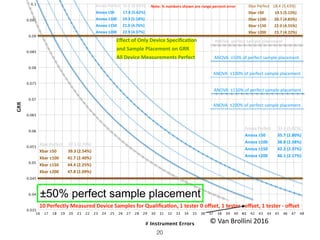
- 20. 4816 17 18 19 20 21 22 23 24 25 26 27 28 29 30 31 32 33 34 35 36 37 38 39 40 41 42 43 44 45 46 47 0.1 0.035 0.04 0.045 0.05 0.055 0.06 0.065 0.07 0.075 0.08 0.085 0.09 0.095 # Instrument Errors GRR ANOVA ┬▒50% of perfect sample placement ANOVA ┬▒100% of perfect sample placement 10 Perfectly Measured Device Samples for Quali’¼üca:on, 1 tester 0 o’¼Ćset, 1 tester +o’¼Ćset, 1 tester - o’¼Ćset ANOVA ┬▒150% of perfect sample placement ANOVA ┬▒200% of perfect sample placement Anova Perfect 16.5 (6.06%) Anova ┬▒50 17.8 (5.62%) Anova ┬▒100 19.3 (5.18%) Anova ┬▒150 21.0 (4.76%) Anova ┬▒200 22.9 (4.37%) Xbar Perfect 37.1 (2.70%) Xbar ┬▒50 39.3 (2.54%) Xbar ┬▒100 41.7 (2.40%) Xbar ┬▒150 44.4 (2.25%) Xbar ┬▒200 47.8 (2.09%) ┬® Van Brollini 2016 ┬® Van Brollini 2016┬® Van Brollini 2016┬® Van Brollini 2016 ┬® Van Brollini 2016 ┬® Van Brollini 2016 ┬® Van Brollini 2016┬® Van Brollini 2016 ┬® Van Brollini 2016 ┬® Van Brollini 2016 ANOVA perfect sample placement Anova Perfect 33.1 (3.02%) Anova ┬▒50 35.7 (2.80%) Anova ┬▒100 38.8 (2.58%) Anova ┬▒150 42.2 (2.37%) Anova ┬▒200 46.1 (2.17%) Xbar Perfect 18.4 (5.43%) Xbar ┬▒50 19.5 (5.13%) Xbar ┬▒100 20.7 (4.83%) Xbar ┬▒150 22.0 (4.55%) Xbar ┬▒200 23.7 (4.22%) Note: % numbers shown are range percent error E’¼Ćect of Only Device Speci’¼üca:on and Sample Placement on GRR All Device Measurements Perfect ┬▒50% perfect sample placement 20
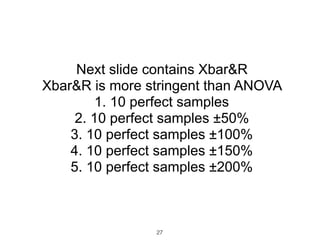
- 21. Next slide contains ANOVA 1. 10 perfect samples 2. 10 perfect samples ┬▒50% 3. 10 perfect samples ┬▒100% 4. 10 perfect samples ┬▒150% 5. 10 perfect samples ┬▒200% 21
- 22. 4816 17 18 19 20 21 22 23 24 25 26 27 28 29 30 31 32 33 34 35 36 37 38 39 40 41 42 43 44 45 46 47 0.1 0.035 0.04 0.045 0.05 0.055 0.06 0.065 0.07 0.075 0.08 0.085 0.09 0.095 # Instrument Errors GRR ANOVA ┬▒50% of perfect sample placement ANOVA ┬▒100% of perfect sample placement 10 Perfectly Measured Device Samples for Quali’¼üca:on, 1 tester 0 o’¼Ćset, 1 tester +o’¼Ćset, 1 tester - o’¼Ćset ANOVA ┬▒150% of perfect sample placement ANOVA ┬▒200% of perfect sample placement Anova Perfect 16.5 (6.06%) Anova ┬▒50 17.8 (5.62%) Anova ┬▒100 19.3 (5.18%) Anova ┬▒150 21.0 (4.76%) Anova ┬▒200 22.9 (4.37%) Xbar Perfect 37.1 (2.70%) Xbar ┬▒50 39.3 (2.54%) Xbar ┬▒100 41.7 (2.40%) Xbar ┬▒150 44.4 (2.25%) Xbar ┬▒200 47.8 (2.09%) ┬® Van Brollini 2016 ┬® Van Brollini 2016┬® Van Brollini 2016┬® Van Brollini 2016 ┬® Van Brollini 2016 ┬® Van Brollini 2016 ┬® Van Brollini 2016┬® Van Brollini 2016 ┬® Van Brollini 2016 ┬® Van Brollini 2016 ANOVA perfect sample placement Anova Perfect 33.1 (3.02%) Anova ┬▒50 35.7 (2.80%) Anova ┬▒100 38.8 (2.58%) Anova ┬▒150 42.2 (2.37%) Anova ┬▒200 46.1 (2.17%) Xbar Perfect 18.4 (5.43%) Xbar ┬▒50 19.5 (5.13%) Xbar ┬▒100 20.7 (4.83%) Xbar ┬▒150 22.0 (4.55%) Xbar ┬▒200 23.7 (4.22%) Note: % numbers shown are range percent error E’¼Ćect of Only Device Speci’¼üca:on and Sample Placement on GRR All Device Measurements Perfect 22
- 23. Next 4 slides using ANOVA show how to use 23
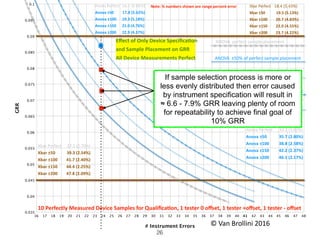
- 24. 4816 17 18 19 20 21 22 23 24 25 26 27 28 29 30 31 32 33 34 35 36 37 38 39 40 41 42 43 44 45 46 47 0.1 0.035 0.04 0.045 0.05 0.055 0.06 0.065 0.07 0.075 0.08 0.085 0.09 0.095 # Instrument Errors GRR ANOVA ┬▒50% of perfect sample placement ANOVA ┬▒100% of perfect sample placement 10 Perfectly Measured Device Samples for Quali’¼üca:on, 1 tester 0 o’¼Ćset, 1 tester +o’¼Ćset, 1 tester - o’¼Ćset ANOVA ┬▒150% of perfect sample placement ANOVA ┬▒200% of perfect sample placement Anova Perfect 16.5 (6.06%) Anova ┬▒50 17.8 (5.62%) Anova ┬▒100 19.3 (5.18%) Anova ┬▒150 21.0 (4.76%) Anova ┬▒200 22.9 (4.37%) Xbar Perfect 37.1 (2.70%) Xbar ┬▒50 39.3 (2.54%) Xbar ┬▒100 41.7 (2.40%) Xbar ┬▒150 44.4 (2.25%) Xbar ┬▒200 47.8 (2.09%) ┬® Van Brollini 2016 ┬® Van Brollini 2016┬® Van Brollini 2016┬® Van Brollini 2016 ┬® Van Brollini 2016 ┬® Van Brollini 2016 ┬® Van Brollini 2016┬® Van Brollini 2016 ┬® Van Brollini 2016 ┬® Van Brollini 2016 ANOVA perfect sample placement Anova Perfect 33.1 (3.02%) Anova ┬▒50 35.7 (2.80%) Anova ┬▒100 38.8 (2.58%) Anova ┬▒150 42.2 (2.37%) Anova ┬▒200 46.1 (2.17%) Xbar Perfect 18.4 (5.43%) Xbar ┬▒50 19.5 (5.13%) Xbar ┬▒100 20.7 (4.83%) Xbar ┬▒150 22.0 (4.55%) Xbar ┬▒200 23.7 (4.22%) Note: % numbers shown are range percent error E’¼Ćect of Only Device Speci’¼üca:on and Sample Placement on GRR All Device Measurements Perfect Have to choose something LESS than 10%. Need room for repeatability 24
- 25. 4816 17 18 19 20 21 22 23 24 25 26 27 28 29 30 31 32 33 34 35 36 37 38 39 40 41 42 43 44 45 46 47 0.1 0.035 0.04 0.045 0.05 0.055 0.06 0.065 0.07 0.075 0.08 0.085 0.09 0.095 # Instrument Errors GRR ANOVA ┬▒50% of perfect sample placement ANOVA ┬▒100% of perfect sample placement 10 Perfectly Measured Device Samples for Quali’¼üca:on, 1 tester 0 o’¼Ćset, 1 tester +o’¼Ćset, 1 tester - o’¼Ćset ANOVA ┬▒150% of perfect sample placement ANOVA ┬▒200% of perfect sample placement Anova Perfect 16.5 (6.06%) Anova ┬▒50 17.8 (5.62%) Anova ┬▒100 19.3 (5.18%) Anova ┬▒150 21.0 (4.76%) Anova ┬▒200 22.9 (4.37%) Xbar Perfect 37.1 (2.70%) Xbar ┬▒50 39.3 (2.54%) Xbar ┬▒100 41.7 (2.40%) Xbar ┬▒150 44.4 (2.25%) Xbar ┬▒200 47.8 (2.09%) ┬® Van Brollini 2016 ┬® Van Brollini 2016┬® Van Brollini 2016┬® Van Brollini 2016 ┬® Van Brollini 2016 ┬® Van Brollini 2016 ┬® Van Brollini 2016┬® Van Brollini 2016 ┬® Van Brollini 2016 ┬® Van Brollini 2016 ANOVA perfect sample placement Anova Perfect 33.1 (3.02%) Anova ┬▒50 35.7 (2.80%) Anova ┬▒100 38.8 (2.58%) Anova ┬▒150 42.2 (2.37%) Anova ┬▒200 46.1 (2.17%) Xbar Perfect 18.4 (5.43%) Xbar ┬▒50 19.5 (5.13%) Xbar ┬▒100 20.7 (4.83%) Xbar ┬▒150 22.0 (4.55%) Xbar ┬▒200 23.7 (4.22%) Note: % numbers shown are range percent error E’¼Ćect of Only Device Speci’¼üca:on and Sample Placement on GRR All Device Measurements Perfect Choose 24 Instrument Errors (4.17%) 25
- 26. 4816 17 18 19 20 21 22 23 24 25 26 27 28 29 30 31 32 33 34 35 36 37 38 39 40 41 42 43 44 45 46 47 0.1 0.035 0.04 0.045 0.05 0.055 0.06 0.065 0.07 0.075 0.08 0.085 0.09 0.095 # Instrument Errors GRR ANOVA ┬▒50% of perfect sample placement ANOVA ┬▒100% of perfect sample placement 10 Perfectly Measured Device Samples for Quali’¼üca:on, 1 tester 0 o’¼Ćset, 1 tester +o’¼Ćset, 1 tester - o’¼Ćset ANOVA ┬▒150% of perfect sample placement ANOVA ┬▒200% of perfect sample placement Anova Perfect 16.5 (6.06%) Anova ┬▒50 17.8 (5.62%) Anova ┬▒100 19.3 (5.18%) Anova ┬▒150 21.0 (4.76%) Anova ┬▒200 22.9 (4.37%) Xbar Perfect 37.1 (2.70%) Xbar ┬▒50 39.3 (2.54%) Xbar ┬▒100 41.7 (2.40%) Xbar ┬▒150 44.4 (2.25%) Xbar ┬▒200 47.8 (2.09%) ┬® Van Brollini 2016 ┬® Van Brollini 2016┬® Van Brollini 2016┬® Van Brollini 2016 ┬® Van Brollini 2016 ┬® Van Brollini 2016 ┬® Van Brollini 2016┬® Van Brollini 2016 ┬® Van Brollini 2016 ┬® Van Brollini 2016 ANOVA perfect sample placement Anova Perfect 33.1 (3.02%) Anova ┬▒50 35.7 (2.80%) Anova ┬▒100 38.8 (2.58%) Anova ┬▒150 42.2 (2.37%) Anova ┬▒200 46.1 (2.17%) Xbar Perfect 18.4 (5.43%) Xbar ┬▒50 19.5 (5.13%) Xbar ┬▒100 20.7 (4.83%) Xbar ┬▒150 22.0 (4.55%) Xbar ┬▒200 23.7 (4.22%) Note: % numbers shown are range percent error E’¼Ćect of Only Device Speci’¼üca:on and Sample Placement on GRR All Device Measurements Perfect If sample selection process is more or less evenly distributed then error caused by instrument specification will result in Ōēł 6.6 - 7.9% GRR leaving plenty of room for repeatability to achieve final goal of 10% GRR 26
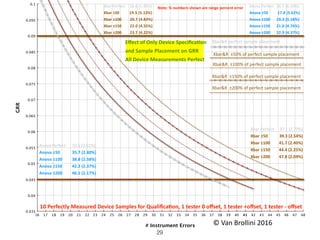
- 27. Next slide contains Xbar&R Xbar&R is more stringent than ANOVA 1. 10 perfect samples 2. 10 perfect samples ┬▒50% 3. 10 perfect samples ┬▒100% 4. 10 perfect samples ┬▒150% 5. 10 perfect samples ┬▒200% 27
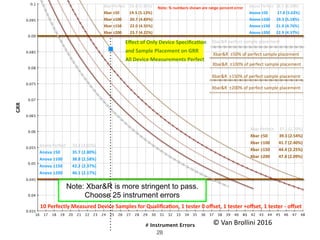
- 28. 4816 17 18 19 20 21 22 23 24 25 26 27 28 29 30 31 32 33 34 35 36 37 38 39 40 41 42 43 44 45 46 47 0.1 0.035 0.04 0.045 0.05 0.055 0.06 0.065 0.07 0.075 0.08 0.085 0.09 0.095 # Instrument Errors GRR Xbar&R ┬▒50% of perfect sample placement Xbar&R ┬▒100% of perfect sample placement 10 Perfectly Measured Device Samples for Quali’¼üca:on, 1 tester 0 o’¼Ćset, 1 tester +o’¼Ćset, 1 tester - o’¼Ćset Xbar&R ┬▒150% of perfect sample placement Xbar&R ┬▒200% of perfect sample placement Xbar Perfect 18.4 (5.43%) Xbar ┬▒50 19.5 (5.13%) Xbar ┬▒100 20.7 (4.83%) Xbar ┬▒150 22.0 (4.55%) Xbar ┬▒200 23.7 (4.22%) Xbar Perfect 37.1 (2.70%) Xbar ┬▒50 39.3 (2.54%) Xbar ┬▒100 41.7 (2.40%) Xbar ┬▒150 44.4 (2.25%) Xbar ┬▒200 47.8 (2.09%) ┬® Van Brollini 2016 ┬® Van Brollini 2016┬® Van Brollini 2016┬® Van Brollini 2016 ┬® Van Brollini 2016 ┬® Van Brollini 2016 ┬® Van Brollini 2016┬® Van Brollini 2016 ┬® Van Brollini 2016 ┬® Van Brollini 2016 Xbar&R perfect sample placement Anova Perfect 16.5 (6.06%) Anova ┬▒50 17.8 (5.62%) Anova ┬▒100 19.3 (5.18%) Anova ┬▒150 21.0 (4.76%) Anova ┬▒200 22.9 (4.37%) Anova Perfect 33.1 (3.02%) Anova ┬▒50 35.7 (2.80%) Anova ┬▒100 38.8 (2.58%) Anova ┬▒150 42.2 (2.37%) Anova ┬▒200 46.1 (2.17%) Note: % numbers shown are range percent error E’¼Ćect of Only Device Speci’¼üca:on and Sample Placement on GRR All Device Measurements Perfect Note: Xbar&R is more stringent to pass. Choose 25 instrument errors 28
- 29. 4816 17 18 19 20 21 22 23 24 25 26 27 28 29 30 31 32 33 34 35 36 37 38 39 40 41 42 43 44 45 46 47 0.1 0.035 0.04 0.045 0.05 0.055 0.06 0.065 0.07 0.075 0.08 0.085 0.09 0.095 # Instrument Errors GRR Xbar&R ┬▒50% of perfect sample placement Xbar&R ┬▒100% of perfect sample placement 10 Perfectly Measured Device Samples for Quali’¼üca:on, 1 tester 0 o’¼Ćset, 1 tester +o’¼Ćset, 1 tester - o’¼Ćset Xbar&R ┬▒150% of perfect sample placement Xbar&R ┬▒200% of perfect sample placement Xbar Perfect 18.4 (5.43%) Xbar ┬▒50 19.5 (5.13%) Xbar ┬▒100 20.7 (4.83%) Xbar ┬▒150 22.0 (4.55%) Xbar ┬▒200 23.7 (4.22%) Xbar Perfect 37.1 (2.70%) Xbar ┬▒50 39.3 (2.54%) Xbar ┬▒100 41.7 (2.40%) Xbar ┬▒150 44.4 (2.25%) Xbar ┬▒200 47.8 (2.09%) ┬® Van Brollini 2016 ┬® Van Brollini 2016┬® Van Brollini 2016┬® Van Brollini 2016 ┬® Van Brollini 2016 ┬® Van Brollini 2016 ┬® Van Brollini 2016┬® Van Brollini 2016 ┬® Van Brollini 2016 ┬® Van Brollini 2016 Xbar&R perfect sample placement Anova Perfect 16.5 (6.06%) Anova ┬▒50 17.8 (5.62%) Anova ┬▒100 19.3 (5.18%) Anova ┬▒150 21.0 (4.76%) Anova ┬▒200 22.9 (4.37%) Anova Perfect 33.1 (3.02%) Anova ┬▒50 35.7 (2.80%) Anova ┬▒100 38.8 (2.58%) Anova ┬▒150 42.2 (2.37%) Anova ┬▒200 46.1 (2.17%) Note: % numbers shown are range percent error E’¼Ćect of Only Device Speci’¼üca:on and Sample Placement on GRR All Device Measurements Perfect 29
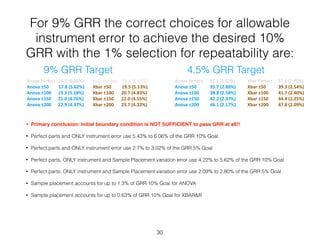
- 30. For 9% GRR the correct choices for allowable instrument error to achieve the desired 10% GRR with the 1% selection for repeatability are: ŌĆó Primary conclusion: Initial boundary condition is NOT SUFFICIENT to pass GRR at all!! ŌĆó Perfect parts and ONLY instrument error use 5.43% to 6.06% of the GRR 10% Goal ŌĆó Perfect parts and ONLY instrument error use 2.7% to 3.02% of the GRR 5% Goal ŌĆó Perfect parts, ONLY instrument and Sample Placement variation error use 4.22% to 5.62% of the GRR 10% Goal ŌĆó Perfect parts, ONLY instrument and Sample Placement variation error use 2.09% to 2.80% of the GRR 5% Goal ŌĆó Sample placement accounts for up to 1.3% of GRR 10% Goal for ANOVA ŌĆó Sample placement accounts for up to 0.63% of GRR 10% Goal for XBAR&R Anova Perfect 16.5 (6.06%) Anova ┬▒50 17.8 (5.62%) Anova ┬▒100 19.3 (5.18%) Anova ┬▒150 21.0 (4.76%) Anova ┬▒200 22.9 (4.37%) Xbar Perfect 18.4 (5.43%) Xbar ┬▒50 19.5 (5.13%) Xbar ┬▒100 20.7 (4.83%) Xbar ┬▒150 22.0 (4.55%) Xbar ┬▒200 23.7 (4.22%) Xbar Perfect 37.1 (2.70%) Xbar ┬▒50 39.3 (2.54%) Xbar ┬▒100 41.7 (2.40%) Xbar ┬▒150 44.4 (2.25%) Xbar ┬▒200 47.8 (2.09%) Anova Perfect 33.1 (3.02%) Anova ┬▒50 35.7 (2.80%) Anova ┬▒100 38.8 (2.58%) Anova ┬▒150 42.2 (2.37%) Anova ┬▒200 46.1 (2.17%) 9% GRR Target 4.5% GRR Target 30