GUI overhead
- 1. Energy Overhead of the GUI in Server Operating Systems Heather Brotherton
- 2. Introduction ï§ This study will ï§ Make a case for reducing use of the graphical user interface ï§ Avoid focus on a particular brand of operating system
- 3. OPERATING SYSTEM ï§ Nearly every server, controlling systems resources ï§ Allows us to take advantage of the Cascade Effect
- 5. Potential Savings Source: EXP Critical Facilities Inc., Intel Corp.
- 6. Example ï§ If a PCI card such as video card were removed for a savings of 41watts from 500 servers in a data center, the cumulative watts saved would be 58,220 watts per year. ï§ At an average of ten cents per kilowatt-hour this results in a savings of$51,035.65 per year.
- 7. Experiment ï§ Energy readings were collected for a minimum of one hour using the Watts Up? Meter.
- 8. Monitoring Tool ï§ Watts up? Pro universal outlet version. This meter is capable of measuring 100 to 250v within a plus or minus 1.5 percent accuracy. ï§ The meter is also capable of logging at onesecond intervals and provides a USB interface and PC software
- 9. Linux Observations ï§ Linux based server operating systems ran the top command during the observations. ï§ top -d 1 > /home/testOSName.txt
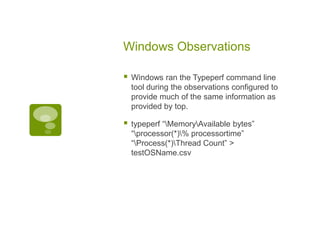
- 10. Windows Observations ï§ Windows ran the Typeperf command line tool during the observations configured to provide much of the same information as provided by top. ï§ typeperf âMemoryAvailable bytesâ âprocessor(*)% processortimeâ âProcess(*)Thread Countâ > testOSName.csv
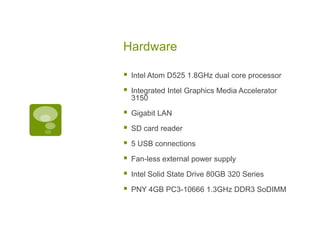
- 11. Hardware ï§ Intel Atom D525 1.8GHz dual core processor ï§ Integrated Intel Graphics Media Accelerator 3150 ï§ Gigabit LAN ï§ SD card reader ï§ 5 USB connections ï§ Fan-less external power supply ï§ Intel Solid State Drive 80GB 320 Series ï§ PNY 4GB PC3-10666 1.3GHz DDR3 SoDIMM
- 12. Server ï§ Baseline watt consumption mean energy consumed is 7.96 watts and the median is 8.70 watts. ï§ After the addition of 4GB RAM to the server during a one hour period is 15.36 watts and the median is 15 watts. ï§ After Solid State Drive (SSD) installation was a mean of 17.42 watts and a median consumption of 17.7 watts. ï§ Baseline for the server of 17.42 to17.7 watts
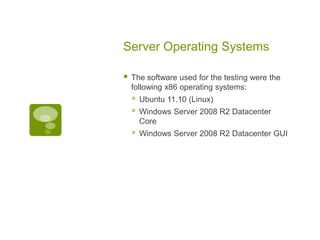
- 13. Server Operating Systems ï§ The software used for the testing were the following x86 operating systems: ï§ ï§ Ubuntu 11.10 (Linux) ï§ Windows Server 2008 R2 Datacenter GUI Windows Server 2008 R2 Datacenter Core
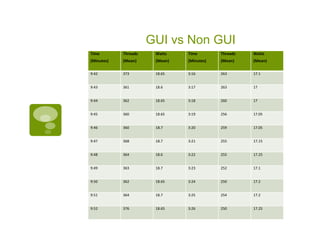
- 15. GUI vs Non GUI Time Threads Watts Time Threads Watts (Minutes) (Mean) (Mean) (Minutes) (Mean) (Mean) 9:42 373 18.65 3:16 263 17.1 9:43 361 18.6 3:17 263 17 9:44 362 18.65 3:18 260 17 9:45 360 18.65 3:19 256 17.05 9:46 360 18.7 3:20 259 17.05 9:47 368 18.7 3:21 255 17.15 9:48 364 18.6 3:22 255 17.25 9:49 363 18.7 3:23 252 17.1 9:50 362 18.65 3:24 250 17.2 9:51 364 18.7 3:25 254 17.2 9:52 376 18.65 3:26 250 17.25
- 16. Table explained ï§ The mean number of threads: ï§ ï§ GUI 365 Non-GUI 256 ï§ Difference approximately 109 threads ï§ Indicates that a reduction of the ~100-thread GUI overhead can save roughly one watt at the server level.
- 17. FINDINGS ï§ Operating systems that do not run a graphical user interface (GUI) tested use roughly 17.5 to 17.6 watts. ï§ Graphical user interface (GUI) based operating systems tested consumed 18.1 to 18.9 watts roughly. ï§ Not using a GUI would save .6 to 1.3 watts per server.
- 18. Conclusion ï§ Savings of roughly 1 watt per server ï§ Doesnât seem like a big deal? ï§ Maybe, but now you donât need that video cardâĶ
- 19. Math ï§ (1watt GUI + 41 watt video card) 2.84 Cascade Effect = 119.28 watts ï§ Hours in a year 8765.81 ï§ wattage x hours used ÷ 1000 x price per kWh = cost of electricity ï§ (119.28 x 8765.81 ÷ 1000) x .1 = 104.55858168 ï§ For 500 servers $52,279.29

