Gwinnett County Real Estate Market Report 3 09
Download as ppt, pdf0 likes329 views
The real estate market report for Gwinnett County in January and February 2009 showed: 1) Home sales were down compared to previous years, with 370 homes sold in January and an estimated 450 in February. 2) Average days on the market remained high at over 100 days. 3) Inventory levels remained well above balanced levels, indicating continued weakness in the housing market. 4) The ratio of new listings to sales remained low, under 30%, suggesting that homes were not being priced attractively for buyers. 5) Average home prices continued to decline year-over-year, dipping below $181,000. 6) The conclusion was that the housing market remained weak and a recovery was
1 of 22
Download to read offline


Ad
Recommended
Gwinnett County Real Estate Market Report 11 08
Gwinnett County Real Estate Market Report 11 08LaneBailey
Ěý
1) The real estate market report for Gwinnett County in September and October 2008 showed declines in average sales prices and increases in inventory compared to the same periods in 2007.
2) While preliminary October numbers were mixed, final sales for September were lower than expected at 674, and new listings were too high at over 2000.
3) Absorption rates increased from August to September but increased further from September to October, indicating a seasonal weakening of demand. Inventory remains high compared to the 6 months level considered balanced.Gwinnett County Real Estate Market Report 9 08
Gwinnett County Real Estate Market Report 9 08LaneBailey
Ěý
The real estate market report for Gwinnett County showed some signs of seasonal weakness in August. While July numbers were strong with days on market of 86 and new listings under 1900, preliminary August numbers showed days on market up to 95 and new listings at 1850. Absorption rates increased from 13.2 to 14 months indicating continued inventory buildup. The report concluded that overall the market remains seasonal but numbers need to improve in the fall to indicate a broader recovery rather than just seasonal trends.Real Estate Trends January 2009
Real Estate Trends January 2009gpappa
Ěý
The document analyzes real estate trends in Hillsborough and Pasco counties in Florida. It finds that 2008 marked the bottom of the housing market based on falling home sales and prices. However, December 2008 data showed improvements with higher sales, a slight rise in average price, and reduced housing inventory compared to previous months. If positive trends continue in early 2009, the analyst expects the real estate market to gradually recover throughout the year, helped by new policies from the new US administration to stimulate housing.8
8Southwest Riverside County Association of Realtors
Ěý
The document discusses differing views on the state of the US housing market recovery:
1) Some data and analysts suggest the housing market recovery is making slow but steady progress, with housing indices and sales increasing gradually over time.
2) However, others note that the slow rate of recovery remains a concern, and many local markets and homeowners are still not feeling the effects of the economic recovery.
3) Economists have become more optimistic about the housing outlook over the next two years due to an improving job market, but views still differ on how quickly the market will normalize.Greater Princeton NJ Real Estate Market Update
Greater Princeton NJ Real Estate Market UpdateAnn Harwood
Ěý
The document outlines the real estate market trends in 2013 in the U.S., highlighting significant increases in home sales and prices, particularly in New Jersey, with economic growth expected in 2014. It emphasizes the importance of understanding local markets and the absorption rate as a key measure of market strength, while providing guidelines for buyers and sellers. Additionally, it warns that mortgage rates are projected to rise, influencing buyer affordability in the coming year.Market Summary September 2015
Market Summary September 2015Stephanie Lindsey
Ěý
- The number of for sale listings was down 5.9% year-over-year and up 12.6% month-over-month in September 2015. Property sales decreased 9.2% year-over-year and increased 1.6% month-over-month. Properties under contract were up 11.3% month-over-month and down 3.7% year-over-year.
- The average sold price per square foot was down 2.7% month-over-month but up 12.8% year-over-year. The average days on market increased 22.2% year-over-year. The ratio of sold to original list price was 104%, up 3%Payroll versus win percentage in sports
Payroll versus win percentage in sportsjoeyrant
Ěý
The document analyzes whether higher payroll leads to higher win percentages in sports by looking at data from baseball in 2012 and 2015 and football from 1995 to 2016. The data, presented in scatterplots, shows no clear correlation between payroll and wins, as success varied across teams with different salary levels. While conventional wisdom associates financial spending with success, the statistics and facts from these leagues provide evidence that higher payrolls do not necessarily buy championships or determine win rates.Memo final
Memo finalKatie Brems
Ěý
The document is a request from Katie Brems to Tammy Key for an open-to-buy budget of $2,968,917 for men's dress shirts for fall/winter 2015. This would increase the department's inventory by 2.58% based on economic trends showing increased consumer demand and spending. The budget would be allocated across four classes - with the most affordable class receiving a 4% increase as last year's best seller, and the highest-priced class receiving a 1% decrease as last year's lowest seller. Projected sales are $5.7 million, with the requested budget accounting for 47.32% of sales.November 2018 Realtor Report
November 2018 Realtor ReportSouthwest Riverside County Association of Realtors
Ěý
Home sales are down in the local area and nationwide compared to last year, which was one of the best years in a decade. However, the housing market is not in recession and is expected to see modest growth of around 1% per year over the next two years. Challenges to increasing housing supply include restrictive environmental policies, high permitting costs imposed by local governments, and difficulties rebuilding after wildfires.Amárach Economic Recovery Index April 2017
Amárach Economic Recovery Index April 2017Amarach Research
Ěý
The Economic Recovery Index by Amárach Research tracks the psychological and economic recovery of Irish consumers from the recession over an eight-year period, ending in April 2017. The index remains flat despite some signs of improvement, with notable resilience shown by consumers regarding spending and savings compared to the past. Overall, consumer sentiment reflects a cautiously optimistic outlook, with variations in emotional well-being observed among different demographics.Annie Williams Market Trends July-Aug 2015
Annie Williams Market Trends July-Aug 2015Jon Weaver
Ěý
The San Francisco real estate market continues to show strength, with the median home price remaining above $1 million and overall prices increasing year-over-year. Sales momentum is recovering, with single-family home sales up 11.6% from June of the previous year, and condos/lofts experiencing a slight year-over-year decline in sales. Inventory shortages and inflows of cash from Silicon Valley and foreign buyers are expected to sustain market demand moving forward.Annie Williams Market Trends April-May 2015
Annie Williams Market Trends April-May 2015Jon Weaver
Ěý
- Home sales in San Francisco jumped 6.5% in March compared to the previous year, while condo sales were down slightly by 1.6%.
- Median home prices rose 25% and average prices increased 22.5% in March compared to the previous year, setting new all-time highs. Condo median prices rose 13.9% year-over-year.
- Mortgage rates are expected to remain low in the coming weeks as recent economic data has been mixed, though rates will likely begin rising later in the year as signaled by the Federal Reserve.Maui Stats April 2014
Maui Stats April 2014Eric West
Ěý
April 2014 real estate statistics for Maui show:
- Residential home sales rose to 84 units sold with a median price of $583,000, declining slightly from the previous month. Condominium sales increased to 136 units with a median price of $403,500. Land sales totaled 19 lots with a median price of $510,000.
- Year-to-date, residential median prices have risen 14% and condo median prices have risen 9% compared to the same period in 2013. Inventory levels have declined slightly for homes and condos.
- The author notes that well-priced properties are attracting multiple offers and selling quickly, while significantly overpriced listings remain unsold.Fall 2016 Linneman Associates Capital Markets Webinar Transcript Sample
Fall 2016 Linneman Associates Capital Markets Webinar Transcript SampleReal Estate Financial Modeling
Ěý
The fall 2016 Linneman Associates Capital Markets Webinar, presented by Dr. Peter Linneman, discusses the slow recovery of the U.S. economy post-recession, highlighting a $3 trillion gap in GDP primarily due to sluggish growth in the housing sector. The economic policy uncertainty index shows how stability in governance correlates with economic growth, while labor market indicators suggest improvements, particularly in unemployment rates. However, the overall GDP growth remains below historical norms, raising concerns regarding market regulations and low interest rates impacting economic activity.United States (U.S) Retail Sales in February Post Smallest Gain in Six Months
United States (U.S) Retail Sales in February Post Smallest Gain in Six Monthspaul young cpa, cga
Ěý
Retail sales in the United States grew 3.7% in February 2017 compared to the same period last year, higher than the forecasted 2.7% growth. While the increase was the smallest in six months, January's core retail sales were revised upward to a 1.2% gain. Most retailers reported weak February sales despite warm weather, likely due to delayed tax refunds reducing household spending. More states are targeting online retailers to collect sales tax in efforts to offset lost revenue from e-commerce sales.Charlottesville Real Estate Market Update - 1st Quater 2015
Charlottesville Real Estate Market Update - 1st Quater 2015Rob Alley
Ěý
In the first quarter of 2015, the Charlottesville region saw a 5.1% increase in median sales price to $256,750, with closed sales remaining consistent but new pending sales up 18%. The market experienced notable trends with detached homes seeing an 8.2% price increase, while attached homes fell 6.5%, primarily due to the higher share of lower-priced condo sales. Inventory levels decreased by 7.6% year-over-year as demand grew, indicated by an increase in new pending sales and a decrease in the average days on market.Market Perspective - August 2018
Market Perspective - August 2018Mark Biegel
Ěý
The 2nd quarter of 2018 saw continued strong earnings growth in the S&P 500, with sales up 10% and earnings up over 25%. All eleven sectors showed positive year-over-year growth and most companies signaled optimism for the remainder of the year. The strong earnings beat even the fairly aggressive expectations heading into the quarter. Additionally, recent economic stimulus has led to surging GDP growth and a strong job market with low unemployment, despite concerns over trade and currencies. Barring unforeseen geopolitical impacts, growth is expected to remain robust through the end of 2018.Georgia Home prices up 25.4% since last January!
Georgia Home prices up 25.4% since last January! Sandra Watkins
Ěý
- Housing market activity decreased in January 2014 compared to January 2013, with new listings down 5.7%, pending sales up 13.2%, and closed sales down 7.1%.
- Median home prices continued to rise, increasing 25.4% to $141,100. Inventory levels fell 3.8% while days on market were down 8.9% to 82 days.
- The document analyzes housing market metrics and notes that factors driving the recovery in recent years will likely continue in 2014, though perhaps at a more moderate pace, and inventory levels will be an important metric to watch.Georgia Association of Realtors Stats for December 2013
Georgia Association of Realtors Stats for December 2013Sandra Watkins
Ěý
- Housing activity in December 2013 saw increases in new listings (up 8.3%), pending sales (up 16.9%), and closed sales (up 3.7%) compared to December 2012.
- The median sales price rose 24.8% to $149,900. Inventory levels fell 4.2% to 37,803 units.
- Days on market decreased 14.7% to 81 days on average. The housing market saw strengthened demand and higher prices in December 2013 compared to the previous year.Boulder County Real Estate - December 2017 Statistics
Boulder County Real Estate - December 2017 StatisticsNeil Kearney
Ěý
Boulder County real estate sales statistics for December 2017 show a 5.45% decline in cumulative sales compared to 2016, though December sales increased by 3.5%. Inventory levels peaked in June but have since leveled out, with over 44% of active single-family home listings under contract by the end of December. A strong December indicates positive momentum entering 2018, but sufficient listings will be crucial to motivate buyers who have been waiting for more homes to appear on the market.Georgia Housing Market Snapshot For November 2018
Georgia Housing Market Snapshot For November 2018Arthur Prescott
Ěý
The November 2018 real estate activity report indicates a slight increase in new listings by 2.9% and a decline in pending sales by 2.3%, although the median sales price rose by 8.0% to $215,000. The U.S. housing market continues to be supported by a strong economy despite rising mortgage rates, and inventory levels have grown by 1.4%. However, affordability concerns are leading to a slowdown in price growth in some areas, with sellers experiencing a reduced supply of homes.Georgia Housing Market Snapshot: June 2018. Courtesy of the Georgia Associat...
Georgia Housing Market Snapshot: June 2018. Courtesy of the Georgia Associat...Arthur Prescott
Ěý
New residential real estate listings and pending sales increased in June 2018 compared to the previous year, while closed sales decreased slightly. The median and average sales prices rose 9.5% over the same period. Inventory levels declined 12.3% and the number of days homes spent on the market before being sold decreased 13.2%.Georgia Real Estate Market Trends
Georgia Real Estate Market TrendsArthur Prescott
Ěý
- New listings decreased 1.8% year-over-year in June 2017 while pending sales increased 8.4% and closed sales rose 6%. Inventory levels fell 13.3% and months' supply dropped 17.4%. Median and average sales prices increased 6.1% and 5.4% respectively.Georgia Housing Market Snapshot For September 2018
Georgia Housing Market Snapshot For September 2018Arthur Prescott
Ěý
New listings increased 11.8% year-over-year in September 2018. Pending sales were also up 11.8% and inventory levels decreased 5.0% over the same period. Median and average sales prices rose 10.6% and 7.7% respectively, while days on market declined 9.4%. Overall, the housing market in the reported regions continues to show strength with high demand, low inventory, and rising home prices.Georgia Housing Market Snapshot For July. Gar mmi 2018-07
Georgia Housing Market Snapshot For July. Gar mmi 2018-07Arthur Prescott
Ěý
In July 2018, closed sales increased by 7.2% with a median sales price rising to $225,900, marking an 8.3% year-over-year increase. Market activity showed a rise in new listings by 4.4%, while inventory levels decreased by 10.0%, leading to continued demand for homes despite affordability concerns. Economic indicators such as GDP growth at 4.1% suggest a potentially balanced market rather than a housing bubble.The Georgia Association Of Realtors Monthly Indicators For April 2014
The Georgia Association Of Realtors Monthly Indicators For April 2014Arthur Prescott
Ěý
New residential real estate listings and pending sales in April 2014 increased by 12.5% and 21.2% respectively compared to April 2013. The median sales price rose 14.5% to $158,000, while days on market declined 8.4% to 76 days. Overall, the housing market showed signs of continued recovery in April with higher sales volumes and rising home prices.Georgia Housing Market Snapshot For October 2018
Georgia Housing Market Snapshot For October 2018Arthur Prescott
Ěý
The October 2018 real estate activity report indicates a balanced market with a slight increase in closed sales (up 3.1%) and new listings (up 11.5%), while inventory levels decreased by 0.9%. The median sales price rose 7.9% to $215,850, and the days on market decreased by 10.9% to 49 days, signaling a favorable climate for sellers. Despite stock market fluctuations, strong employment rates and homeownership growth, especially among buyers under 35, continue to bolster the housing sector.Boulder County Real Estate Statistics - August 2018
Boulder County Real Estate Statistics - August 2018Neil Kearney
Ěý
In August 2018, Boulder County's cumulative real estate sales are down 2.5% compared to last year, although August sales increased by 3.6%. A declining inventory of available homes over the past five years and a lower percentage of properties under contract indicate a subdued market, despite some price appreciation. The real estate market remains strong but is expected to slow after the summer, with activity typically resuming in the fall.Boulder Real Estate Statistics May 2018
Boulder Real Estate Statistics May 2018Neil Kearney
Ěý
Real estate sales in Boulder County are down 4.1% for the year so far compared to 2017. Inventory has increased slightly in recent months but remains lower than a year ago. The percentage of properties under contract has returned to around 45%, similar to levels from 2017. New property listings and contracts are trending similarly to past years. Sales are down 4% for the first half of 2018 and multiple offers on properties now typically include two bidders rather than five. Months of inventory vary by price range from 2.6 for properties under $500k to over 25 months for those over $3 million.March 2015 New Home Sales (Grant Toch)
March 2015 New Home Sales (Grant Toch)Grant Toch
Ěý
- March 2015 new home sales were down from February but up from March 2014, while actual sales increased 15% year-over-year
- Starts and sales are accelerating compared to stagnating permits over the last 12 months
- Sales remain at very low historic levels compared to the size of the US economy, though have been increasing in recent yearsMore Related Content
What's hot (9)
November 2018 Realtor Report
November 2018 Realtor ReportSouthwest Riverside County Association of Realtors
Ěý
Home sales are down in the local area and nationwide compared to last year, which was one of the best years in a decade. However, the housing market is not in recession and is expected to see modest growth of around 1% per year over the next two years. Challenges to increasing housing supply include restrictive environmental policies, high permitting costs imposed by local governments, and difficulties rebuilding after wildfires.Amárach Economic Recovery Index April 2017
Amárach Economic Recovery Index April 2017Amarach Research
Ěý
The Economic Recovery Index by Amárach Research tracks the psychological and economic recovery of Irish consumers from the recession over an eight-year period, ending in April 2017. The index remains flat despite some signs of improvement, with notable resilience shown by consumers regarding spending and savings compared to the past. Overall, consumer sentiment reflects a cautiously optimistic outlook, with variations in emotional well-being observed among different demographics.Annie Williams Market Trends July-Aug 2015
Annie Williams Market Trends July-Aug 2015Jon Weaver
Ěý
The San Francisco real estate market continues to show strength, with the median home price remaining above $1 million and overall prices increasing year-over-year. Sales momentum is recovering, with single-family home sales up 11.6% from June of the previous year, and condos/lofts experiencing a slight year-over-year decline in sales. Inventory shortages and inflows of cash from Silicon Valley and foreign buyers are expected to sustain market demand moving forward.Annie Williams Market Trends April-May 2015
Annie Williams Market Trends April-May 2015Jon Weaver
Ěý
- Home sales in San Francisco jumped 6.5% in March compared to the previous year, while condo sales were down slightly by 1.6%.
- Median home prices rose 25% and average prices increased 22.5% in March compared to the previous year, setting new all-time highs. Condo median prices rose 13.9% year-over-year.
- Mortgage rates are expected to remain low in the coming weeks as recent economic data has been mixed, though rates will likely begin rising later in the year as signaled by the Federal Reserve.Maui Stats April 2014
Maui Stats April 2014Eric West
Ěý
April 2014 real estate statistics for Maui show:
- Residential home sales rose to 84 units sold with a median price of $583,000, declining slightly from the previous month. Condominium sales increased to 136 units with a median price of $403,500. Land sales totaled 19 lots with a median price of $510,000.
- Year-to-date, residential median prices have risen 14% and condo median prices have risen 9% compared to the same period in 2013. Inventory levels have declined slightly for homes and condos.
- The author notes that well-priced properties are attracting multiple offers and selling quickly, while significantly overpriced listings remain unsold.Fall 2016 Linneman Associates Capital Markets Webinar Transcript Sample
Fall 2016 Linneman Associates Capital Markets Webinar Transcript SampleReal Estate Financial Modeling
Ěý
The fall 2016 Linneman Associates Capital Markets Webinar, presented by Dr. Peter Linneman, discusses the slow recovery of the U.S. economy post-recession, highlighting a $3 trillion gap in GDP primarily due to sluggish growth in the housing sector. The economic policy uncertainty index shows how stability in governance correlates with economic growth, while labor market indicators suggest improvements, particularly in unemployment rates. However, the overall GDP growth remains below historical norms, raising concerns regarding market regulations and low interest rates impacting economic activity.United States (U.S) Retail Sales in February Post Smallest Gain in Six Months
United States (U.S) Retail Sales in February Post Smallest Gain in Six Monthspaul young cpa, cga
Ěý
Retail sales in the United States grew 3.7% in February 2017 compared to the same period last year, higher than the forecasted 2.7% growth. While the increase was the smallest in six months, January's core retail sales were revised upward to a 1.2% gain. Most retailers reported weak February sales despite warm weather, likely due to delayed tax refunds reducing household spending. More states are targeting online retailers to collect sales tax in efforts to offset lost revenue from e-commerce sales.Charlottesville Real Estate Market Update - 1st Quater 2015
Charlottesville Real Estate Market Update - 1st Quater 2015Rob Alley
Ěý
In the first quarter of 2015, the Charlottesville region saw a 5.1% increase in median sales price to $256,750, with closed sales remaining consistent but new pending sales up 18%. The market experienced notable trends with detached homes seeing an 8.2% price increase, while attached homes fell 6.5%, primarily due to the higher share of lower-priced condo sales. Inventory levels decreased by 7.6% year-over-year as demand grew, indicated by an increase in new pending sales and a decrease in the average days on market.Market Perspective - August 2018
Market Perspective - August 2018Mark Biegel
Ěý
The 2nd quarter of 2018 saw continued strong earnings growth in the S&P 500, with sales up 10% and earnings up over 25%. All eleven sectors showed positive year-over-year growth and most companies signaled optimism for the remainder of the year. The strong earnings beat even the fairly aggressive expectations heading into the quarter. Additionally, recent economic stimulus has led to surging GDP growth and a strong job market with low unemployment, despite concerns over trade and currencies. Barring unforeseen geopolitical impacts, growth is expected to remain robust through the end of 2018.Fall 2016 Linneman Associates Capital Markets Webinar Transcript Sample
Fall 2016 Linneman Associates Capital Markets Webinar Transcript SampleReal Estate Financial Modeling
Ěý
Similar to Gwinnett County Real Estate Market Report 3 09 (20)
Georgia Home prices up 25.4% since last January!
Georgia Home prices up 25.4% since last January! Sandra Watkins
Ěý
- Housing market activity decreased in January 2014 compared to January 2013, with new listings down 5.7%, pending sales up 13.2%, and closed sales down 7.1%.
- Median home prices continued to rise, increasing 25.4% to $141,100. Inventory levels fell 3.8% while days on market were down 8.9% to 82 days.
- The document analyzes housing market metrics and notes that factors driving the recovery in recent years will likely continue in 2014, though perhaps at a more moderate pace, and inventory levels will be an important metric to watch.Georgia Association of Realtors Stats for December 2013
Georgia Association of Realtors Stats for December 2013Sandra Watkins
Ěý
- Housing activity in December 2013 saw increases in new listings (up 8.3%), pending sales (up 16.9%), and closed sales (up 3.7%) compared to December 2012.
- The median sales price rose 24.8% to $149,900. Inventory levels fell 4.2% to 37,803 units.
- Days on market decreased 14.7% to 81 days on average. The housing market saw strengthened demand and higher prices in December 2013 compared to the previous year.Boulder County Real Estate - December 2017 Statistics
Boulder County Real Estate - December 2017 StatisticsNeil Kearney
Ěý
Boulder County real estate sales statistics for December 2017 show a 5.45% decline in cumulative sales compared to 2016, though December sales increased by 3.5%. Inventory levels peaked in June but have since leveled out, with over 44% of active single-family home listings under contract by the end of December. A strong December indicates positive momentum entering 2018, but sufficient listings will be crucial to motivate buyers who have been waiting for more homes to appear on the market.Georgia Housing Market Snapshot For November 2018
Georgia Housing Market Snapshot For November 2018Arthur Prescott
Ěý
The November 2018 real estate activity report indicates a slight increase in new listings by 2.9% and a decline in pending sales by 2.3%, although the median sales price rose by 8.0% to $215,000. The U.S. housing market continues to be supported by a strong economy despite rising mortgage rates, and inventory levels have grown by 1.4%. However, affordability concerns are leading to a slowdown in price growth in some areas, with sellers experiencing a reduced supply of homes.Georgia Housing Market Snapshot: June 2018. Courtesy of the Georgia Associat...
Georgia Housing Market Snapshot: June 2018. Courtesy of the Georgia Associat...Arthur Prescott
Ěý
New residential real estate listings and pending sales increased in June 2018 compared to the previous year, while closed sales decreased slightly. The median and average sales prices rose 9.5% over the same period. Inventory levels declined 12.3% and the number of days homes spent on the market before being sold decreased 13.2%.Georgia Real Estate Market Trends
Georgia Real Estate Market TrendsArthur Prescott
Ěý
- New listings decreased 1.8% year-over-year in June 2017 while pending sales increased 8.4% and closed sales rose 6%. Inventory levels fell 13.3% and months' supply dropped 17.4%. Median and average sales prices increased 6.1% and 5.4% respectively.Georgia Housing Market Snapshot For September 2018
Georgia Housing Market Snapshot For September 2018Arthur Prescott
Ěý
New listings increased 11.8% year-over-year in September 2018. Pending sales were also up 11.8% and inventory levels decreased 5.0% over the same period. Median and average sales prices rose 10.6% and 7.7% respectively, while days on market declined 9.4%. Overall, the housing market in the reported regions continues to show strength with high demand, low inventory, and rising home prices.Georgia Housing Market Snapshot For July. Gar mmi 2018-07
Georgia Housing Market Snapshot For July. Gar mmi 2018-07Arthur Prescott
Ěý
In July 2018, closed sales increased by 7.2% with a median sales price rising to $225,900, marking an 8.3% year-over-year increase. Market activity showed a rise in new listings by 4.4%, while inventory levels decreased by 10.0%, leading to continued demand for homes despite affordability concerns. Economic indicators such as GDP growth at 4.1% suggest a potentially balanced market rather than a housing bubble.The Georgia Association Of Realtors Monthly Indicators For April 2014
The Georgia Association Of Realtors Monthly Indicators For April 2014Arthur Prescott
Ěý
New residential real estate listings and pending sales in April 2014 increased by 12.5% and 21.2% respectively compared to April 2013. The median sales price rose 14.5% to $158,000, while days on market declined 8.4% to 76 days. Overall, the housing market showed signs of continued recovery in April with higher sales volumes and rising home prices.Georgia Housing Market Snapshot For October 2018
Georgia Housing Market Snapshot For October 2018Arthur Prescott
Ěý
The October 2018 real estate activity report indicates a balanced market with a slight increase in closed sales (up 3.1%) and new listings (up 11.5%), while inventory levels decreased by 0.9%. The median sales price rose 7.9% to $215,850, and the days on market decreased by 10.9% to 49 days, signaling a favorable climate for sellers. Despite stock market fluctuations, strong employment rates and homeownership growth, especially among buyers under 35, continue to bolster the housing sector.Boulder County Real Estate Statistics - August 2018
Boulder County Real Estate Statistics - August 2018Neil Kearney
Ěý
In August 2018, Boulder County's cumulative real estate sales are down 2.5% compared to last year, although August sales increased by 3.6%. A declining inventory of available homes over the past five years and a lower percentage of properties under contract indicate a subdued market, despite some price appreciation. The real estate market remains strong but is expected to slow after the summer, with activity typically resuming in the fall.Boulder Real Estate Statistics May 2018
Boulder Real Estate Statistics May 2018Neil Kearney
Ěý
Real estate sales in Boulder County are down 4.1% for the year so far compared to 2017. Inventory has increased slightly in recent months but remains lower than a year ago. The percentage of properties under contract has returned to around 45%, similar to levels from 2017. New property listings and contracts are trending similarly to past years. Sales are down 4% for the first half of 2018 and multiple offers on properties now typically include two bidders rather than five. Months of inventory vary by price range from 2.6 for properties under $500k to over 25 months for those over $3 million.March 2015 New Home Sales (Grant Toch)
March 2015 New Home Sales (Grant Toch)Grant Toch
Ěý
- March 2015 new home sales were down from February but up from March 2014, while actual sales increased 15% year-over-year
- Starts and sales are accelerating compared to stagnating permits over the last 12 months
- Sales remain at very low historic levels compared to the size of the US economy, though have been increasing in recent yearsBoulder County Real Estate Statistics - January 2019
Boulder County Real Estate Statistics - January 2019Neil Kearney
Ěý
Boulder County real estate sales in January 2019 decreased by 17% compared to the previous year, continuing a trend from the fourth quarter. Inventory levels have risen but remain below normal ranges, indicating that houses are staying on the market longer, which gives buyers more negotiation power. The overall market activity is lower than in past years, though expectations for increased activity in February and spring are suggested due to stabilized interest rates and recovering stock market conditions.Georgia Housing Market Snapshot For February 2019
Georgia Housing Market Snapshot For February 2019Arthur Prescott
Ěý
In February 2019, residential real estate activity in Georgia showed a mixed performance, with new listings down by 0.9% and pending sales up by 7.4% compared to the previous year. The median sales price increased by 4.3% to $210,000, and days on market decreased by 5.6% to 68 days, indicating resilience in the market despite weather-related challenges. Overall, economic fundamentals remained positive, suggesting a potential improvement in housing trends as the year progresses.January 2018 Florida Real Estate Statistics
January 2018 Florida Real Estate Statistics Matias Escobar
Ěý
- Closed home sales in Florida decreased 1.3% in January 2018 compared to January 2017, while the statewide median home sale price increased 9.1% to $240,000.
- The number of cash sales decreased 4.7% year-over-year, and cash sales represented 30.4% of all closed sales, down 3.5% from a year ago.
- The average home sale price in Florida rose 12.3% to $334,350 compared to January 2017.Atlanta Real Estate Market Trends For August 2013
Atlanta Real Estate Market Trends For August 2013Arthur Prescott
Ěý
The Greater Metro Atlanta housing market experienced a significant decline in home sales from 125,000 in 2006 to 60,000 in 2010, with 2013 showing a further decrease due to low inventory and investor activity. Inventory levels have decreased, leading to a seller's market for homes priced below $500,000, and the average sales price has increased by 41% in 2013 compared to earlier years. Additionally, Georgia's economy shows positive job growth post-recession, indicating pent-up demand in the housing market.Boulder County March 2019 Real Estate Statistics
Boulder County March 2019 Real Estate StatisticsNeil Kearney
Ěý
Sales in March 2019 were the same as the previous year, ending a period of declining sales. However, year-to-date sales were still down 5.9%. Inventory was increasing as more homes stayed on the market longer, giving buyers more choices. At the end of March, 43% of listed properties were already under contract, but the number of active listings not under contract was higher than the past five years. Sellers were having to lower prices to compete as homes took longer to sell.Boulder County February 2019 Real Estate Statistics
Boulder County February 2019 Real Estate StatisticsNeil Kearney
Ěý
In February 2019, Boulder County's real estate sales decreased by 4.3% compared to the previous year, reflecting a stabilization from recent declines. Inventory levels have risen to rates similar to those in February 2015 and 2017, while 44% of listings were under contract, indicating longer market times and increased buyer negotiation power. Despite these challenges, there are signs of improvement with a notable rise in new listings and a consistent weekly activity level.December 2012 MLS Statistics
December 2012 MLS StatisticsSold on Shawnee Real Estate
Ěý
This document summarizes real estate market data for single-family properties in Oklahoma for December 2012. It shows that closed sales increased 5.14% compared to the previous year, pending listings increased 18.28%, and new listings decreased 1.81%. The average sales price increased 7.66% to $159,793, while average days on market decreased 9.68% to 81.96 days. Active inventory at the end of December 2012 was 20,044 homes, a 14.03% decrease from the previous year.Ad
Recently uploaded (20)
Applying Service Design to the Workplace
Applying Service Design to the WorkplaceJeremy Johnson
Ěý
Employee experience is shaped by digital tools, processes, and physical spaces. This session explores how service design principles can transform work environments into user-centric spaces, enhancing productivity and well-being in the age of hybrid work and technological innovation.Affordable Luxury Apartments | Nakshatra Veda Vasai.
Affordable Luxury Apartments | Nakshatra Veda Vasai.jsbhomemakers6
Ěý
Invest in Nakshatra Veda and secure your family’s future. Offering modern apartments in
Vasai a peaceful Vasai location with premium facilities.Randy Bocook - Passionate About Real Estate
Randy Bocook - Passionate About Real EstateRandy Bocook
Ěý
Randy Bocook was born to a modest life and grew up consuming books—particularly on real estate. After high school, he sought new life experiences including Marine training at Parris Island before beginning his real estate career at the age of 28. Liberty Vista Luxury Villas Sile IStanbul
Liberty Vista Luxury Villas Sile IStanbulListing Turkey
Ěý
If you’re searching for villas for sale in Istanbul that offer not only comfort and style but also long-term value and natural beauty, Liberty Vista Villas is the perfect choice. Located in the charming district of Şile, on the Asian side of Istanbul, this boutique villa project is designed for families, nature lovers, and investors who appreciate tranquility, safety, and high returns.
A Unique Coastal Escape within Istanbul
Ĺžile is a hidden gem along the Black Sea coast, known for its clean air, lush forests, beautiful sandy beaches, and calm, temperate climate. Unlike many urbanized districts of Istanbul, Ĺžile has preserved its natural charm and ecological balance, making it one of the most peaceful and refreshing locations in the city.
What truly sets Şile apart is its location outside of the active earthquake zone. While much of Istanbul is within seismic risk areas, Şile enjoys geological stability—an increasingly important factor for homebuyers and investors. As a result, real estate values in the district have seen significant growth, making Şile one of the most promising areas for long-term property investment in Istanbul.
Project Details:
Liberty Vista Villas spans a total area of 2,815 m², featuring:
10 luxury villas designed for privacy and spacious living
5 modern blocks, with two villas per block
An estimated completion period of 24 months
A project concept that integrates modern architecture with natural surroundings
Each villa is thoughtfully designed to provide maximum comfort, with open-plan interiors, high ceilings, private gardens, and large windows that bring the surrounding nature inside. Whether you’re looking for a permanent residence or a peaceful holiday home, Liberty Vista Villas offers the perfect setting.
High Return on Investment
In the post-COVID real estate market, Şile ranks among the top districts for ROI (Return on Investment), second only to Sarıyer. Its growing popularity, combined with limited supply of premium properties, means early investors in Liberty Vista Villas stand to benefit from strong capital appreciation and rental potential. The project is ideal for both lifestyle buyers and forward-thinking investors seeking villas for sale in Istanbul with exceptional value and growth prospects.
Outdoor Family Living at Its Best
One of the greatest advantages of Liberty Vista Villas is its emphasis on outdoor family living. Residents can enjoy a range of activities such as hiking, beach trips, cycling, and picnics—all surrounded by the beauty of Şile’s untouched landscape. The quiet, low-density environment makes it especially attractive for families with children or individuals seeking to escape the stress of the city without being far from it.
Key Features:
Location: Ĺžile, Istanbul (Asian Side)
Total Land: 2,815 m²
Villas: 10 Villas in 5 Blocks
Completion Time: 24 Months
Earthquake-Safe Zone
High Capital Growth Area
Family-Friendly Outdoor Living
Secure Your Villa in Istanbul’s Buy Verified Cash App Accounts Orientation Guide 2025|pdf
Buy Verified Cash App Accounts Orientation Guide 2025|pdfPvabulkpro.com
Ěý
Digital payment accounts with confirmed identity offer higher transfer limits, access to investment features, and enhanced security. Identity confirmation unlocks full functionality, supports safer transactions, and ensures eligibility for customer support in both personal and professional financial activities.
Why Luxury Apartments in Indore Are Worth the Investment
Why Luxury Apartments in Indore Are Worth the Investmentssinfinitus11
Ěý
Indore, the heart of Madhya Pradesh, is a rapidly growing city known for its cultural vibrancy, excellent infrastructure, and thriving business ecosystem. As the city continues to develop, luxury apartments in Indore have emerged as a preferred choice for homeowners and investors. Whether you’re looking for the perfect blend of comfort and elegance or aiming to make a sound investment, luxury apartments in Indore offer unparalleled advantages.
In this blog, we’ll explore why investing in luxury apartments in Indore—especially in prominent areas like Nipania—can be a game-changer for your lifestyle and financial portfolio.Own Premium Property in Haridwar with ETH Infra Pvt. Ltd
Own Premium Property in Haridwar with ETH Infra Pvt. Ltdnolakhaethinfra
Ěý
Discover luxurious 1, 2 & 3 BHK flats near the Ganga by ETH Infra. Perfect blend of spiritual atmosphere and modern amenities — ideal for homebuyers and investors.Live Beyond Luxury at Ace Verde, Sector 22A
Live Beyond Luxury at Ace Verde, Sector 22Arajatyadavofficial15
Ěý
Experience a lifestyle that transcends expectations at Ace Verde, Sector 22A. Designed for those who demand more than just luxury, Ace Verde offers ultra-premium 3 & 4 BHK homes with elegant interiors, modern amenities, and unmatched privacy. Here, every detail reflects sophistication, comfort, and exclusivity—perfectly placed in one of the most prestigious addresses in the city.
Investment Trends in Naugaon Farms You Should Know (1).pdf
Investment Trends in Naugaon Farms You Should Know (1).pdfNaugaon Gurgaon
Ěý
Naugaon Farms Naugaon Farms Naugaon Farms Naugaon Farms Naugaon Farms Social Etiquette for International Students Living in Canterbury
Social Etiquette for International Students Living in Canterburystevenjohnsonst01
Ěý
International students in Canterbury can enjoy a smooth transition by understanding social etiquette in shared student housing. From polite conversation to respecting privacy, these customs make life in student apartments and student rooms more enjoyable. Early planning for the right student accommodation is essential, and StudentTenant.com offers a trusted platform with verified student apartments tailored to diverse needs. Embracing cultural differences and clear communication fosters lasting friendships in shared student rooms. With StudentTenant.com as your guide, you’ll find safe, affordable student housing that supports academic success and meaningful cultural exchange for all international students in Canterbury.A Market on Pause- Unpacking America’s Housing Pessimism Post-2008.pdf
A Market on Pause- Unpacking America’s Housing Pessimism Post-2008.pdfJasper Colin
Ěý
Our latest research explores the roots of housing pessimism post-2008—uncovering systemic issues and offering expert-driven solutions to rebuild confidence in homeownership.Sikka Group – Trusted Real Estate Builders and Developers
Sikka Group – Trusted Real Estate Builders and DevelopersSikka Group
Ěý
As one of the most established real estate builders and developers in North India, Sikka Group has been shaping the skyline of major cities like Noida, Delhi NCR, and beyond. With a customer-first approach and a commitment to ethical practices, we have earned a reputation for delivering high-quality developments on time. Whether it's luxurious residential communities or high-performance commercial spaces, Sikka Group leads the way among real estate builders and developers with a vision to build for the future.What Birla Makes Sector 150 Noida Special
What Birla Makes Sector 150 Noida Specialdubeysulabh04
Ěý
Low-Density Green Infrastructure Living
The characteristics of Sector 150 include extensive green spaces, wide roads, and minimal industry. Because more than 80 per cent of the area is set aside for green space, locals can enjoy cleaner air and reduced traffic, which is unusual in the NCR.
Communication Without Disarray
Birla Sector 150 Noida apartments, which are close to the Yamuna Expressway, the Noida-Greater Noida Expressway, and the soon-to-be Jewar Airport, provide the convenience of smooth transit without having to deal with the clamor of busy intersections.
Duramax Grow Room Wall Material Keeps Dampness and Mold at Bay
Duramax Grow Room Wall Material Keeps Dampness and Mold at BayDuramax PVC Wall Panels
Ěý
Explore Duramax’s PVC grow wall solutions, offering ASTM certification and class-1 fire-resistant. As a top manufacturer and supplier of PVC panels in the USA, Duramax stands out in the market. Our panels are perfectly suited for grow rooms due to their non-porous surface, which prevents moisture absorption and helps regulate humidity levels. They are anti-mold and FDA-compliant, featuring an antibacterial coating that creates a clean and safe environment for plant cultivation. The reflective surface of our PVC grow room walls ensures even light distribution, creating ideal conditions for vibrant plant growth. With factory-direct pricing and a limited lifetime warranty, Duramax grow room wall materials are an excellent choice. Order yours today!
Reach Us: https://www.duramaxpvcpanels.com/applications/grow-rooms/
CBRE-WTW-Malaysia-Real-Estate-Market-Outlook-Report-2024.pdf
CBRE-WTW-Malaysia-Real-Estate-Market-Outlook-Report-2024.pdfGARY LAM
Ěý
CBRE-WTW-Malaysia-Real-Estate-Market-Outlook-Report-20243 BHK Flats in Pune – How Real Estate Developers Strategically Choose Top Loc...
3 BHK Flats in Pune – How Real Estate Developers Strategically Choose Top Loc...pridepurpleweb
Ěý
Discover how Pune’s booming suburbs—Hinjawadi, Kharadi, and Wakad—are becoming prime destinations for 3 BHK flats in Pune. This infographic breaks down how leading real estate developers strategically plan projects in these high-growth corridors. Learn about key factors like metro connectivity, IT hubs, infrastructure upgrades, and shifting homebuyer preferences that make 3 BHK homes the ideal choice for modern families and investors in Pune.Property in Haridwar – Premium Flats Near Ganga by ETH Infra Pvt. Ltd
Property in Haridwar – Premium Flats Near Ganga by ETH Infra Pvt. Ltdnolakhaethinfra
Ěý
Looking to buy property in Haridwar? ETH Infra Pvt. Ltd offers premium 1, 2 & 3 BHK flats near the Ganga with modern amenities, spiritual surroundings, and high growth potential. Ideal for both peaceful living and smart real estate investment in one of India’s holiest and fastest-developing cities.
For more information visit us: https://propertyinharidwar.com/Oro Dynasty – Premium 2 BHK Apartments in Arjunganj, Lucknow
Oro Dynasty – Premium 2 BHK Apartments in Arjunganj, Lucknowdigitalstare
Ěý
Experience a new standard of urban living at Oro Dynasty, a premium residential project in the heart of Arjunganj, Lucknow. Designed for modern families, this new launch project offers spacious and thoughtfully planned 2 BHK apartments with top-class amenities and seamless connectivity to key city locations. Whether you're a first-time homebuyer or an investor, Oro Dynasty brings together luxury, location, and lifestyle at an unmatched value. Embrace elegant living in a fast-developing neighborhood with schools, hospitals, shopping centers, and entertainment hubs just minutes away.
Godrej Upper Kharadi Pune | Your Destination for Style and Sophistication
Godrej Upper Kharadi Pune | Your Destination for Style and Sophisticationvaishaliruhela701
Ěý
Godrej Upper Kharadi at Pune, designed to deliver modern comforts and superior urban living, this enclave blends architectural elegance with sustainable design. Thoughtfully crafted homes feature spacious interiors, ample natural light, and panoramic views of the surrounding green pockets. Residents enjoy access to a wide array of world-class amenities, including a clubhouse, swimming pool, gymnasium, landscaped gardens, and children's play zones. The integrated retail zone adds convenience by bringing daily needs and lifestyle options closer to home. With seamless connectivity to IT hubs, educational institutions, hospitals, and entertainment centers, the project caters to professionals and families seeking comfort and connectivity in one address.
Ad
Gwinnett County Real Estate Market Report 3 09
- 1. Gwinnett County Real Estate Market Report March January – February 09
- 2. January Numbers - Updated 1953 New Listings 370 Sold Listings 588 Listings Pending Average 106 Days on Market for Sold Listings
- 3. January Numbers - Final *Listings Pending may have closed in January, may have closed in February, may close in some other month, or may fail to close. But, there IS overlap with Sold Listings.
- 4. February Numbers - Preliminary 1491 New Listings 290 Sold Listings 566 Listings Pending Average 100 Days on Market for Sold Listings
- 5. February Numbers - Preliminary *While all of these numbers are subject to revision next month, the Sold Listings tend to have the most radical revision. I am estimating 450 closed sales for February. I was quite off, predicting 475 for January and only having 370 successfully close.
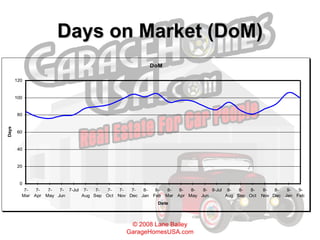
- 6. Days on Market (DoM)
- 7. Conclusions Final for January is 106. I was looking for the under 100… preliminary was 101 days. For February, preliminary is 100. I would really like to see numbers get under 90 in February. I don’t expect it.
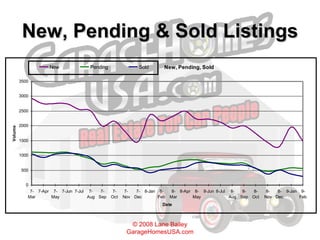
- 8. New, Pending & Sold Listings
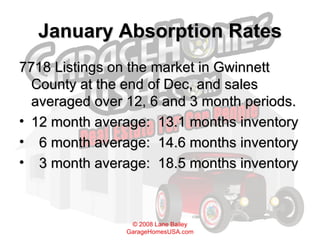
- 9. January Absorption Rates 7718 Listings on the market in Gwinnett County at the end of Dec, and sales averaged over 12, 6 and 3 month periods. 12 month average: 13.1 months inventory 6 month average: 14.6 months inventory 3 month average: 18.5 months inventory
- 10. February Absorption Rates 7718 Listings on the market in Gwinnett County at the end of Jan., and sales averaged over 12, 6 and 3 month periods. 12 month average: 13.5 months inventory 6 month average: 16.6 months inventory 3 month average: 20.0 months inventory
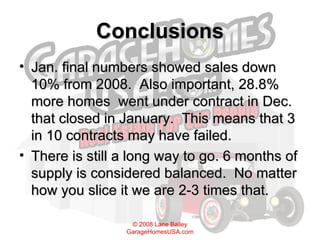
- 11. Conclusions Jan. final numbers showed sales down 10% from 2008. Also important, 28.8% more homes went under contract in Dec. that closed in January. This means that 3 in 10 contracts may have failed. There is still a long way to go. 6 months of supply is considered balanced. No matter how you slice it we are 2-3 times that.
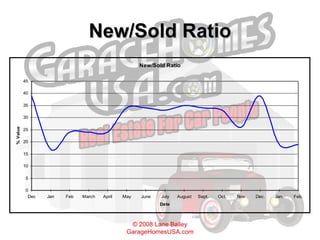
- 12. New/Sold Ratio This ratio compares new listings and sold listings for a given month. It is useful to sellers in determining a pricing strategy.
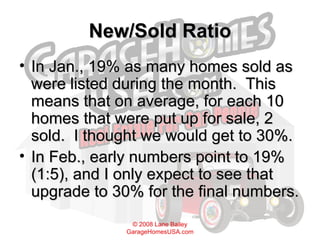
- 13. New/Sold Ratio In Jan., 19% as many homes sold as were listed during the month. This means that on average, for each 10 homes that were put up for sale, 2 sold. I thought we would get to 30%. In Feb., early numbers point to 19% (1:5), and I only expect to see that upgrade to 30% for the final numbers.
- 14. New/Sold Ratio
- 15. Conclusion The weakness of the N/S% shows that few homes are priced attractively to Buyers. This number tops around 67% Anything under 33% is very weak. I expect there to be a seasonal “pop” for Dec. and a fizzle for January.
- 16. Average Sales Price Jan. - $181,501 Down 18.9% from January 2008 Feb. - $181,937 Down 25.5% from February 2008 The Sept. numbers showed an average under $200k for the first time since I started keeping track in January 2005, but it has bounced back… until January. We’ll have to see the finals.
- 17. Average Sales Price Average prices may be volatile, affected by strong or weak sales of homes priced in particular ranges. This number doesn’t really give an indication of market direction except in the broadest sense.
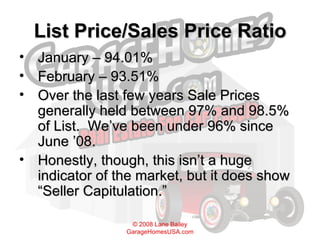
- 18. List Price/Sales Price Ratio January – 94.01% February – 93.51% Over the last few years Sale Prices generally held between 97% and 98.5% of List. We’ve been under 96% since June ’08. Honestly, though, this isn’t a huge indicator of the market, but it does show “Seller Capitulation.”
- 19. Conclusion List/Sale Price % gives an indication of Buyer strength. It also shows whether Sellers are being realistic with pricing. The indications are also very general.
- 20. Overall Conclusion Right now my big concern is “Pendings Failures”. They have been running 3-4 times what it was just a few months ago (except December). Last year I was calling for a 2 nd Quarter recovery in Gwinnett, but I think we might just skip along the bottom for a few months.
- 21. Overall Conclusions September being up in sales was important, but not conclusive. It was against a weak month last year. I don’t think we are seeing the recovery yet. We might be on the bottom, but can’t really know that until later in the spring. There are some great deals, and there are some dogs. The key is finding the right deals. Keeping perspective, sales are cyclical. This is a good time for investment… not a great time to sell without a strategy.
- 22. Overall Conclusions I think that we will see some weakness in the numbers over the next couple of months, possibly due to the Credit Crisis. I really want to see more of the Pending Sales make it to the closing table. March-May will be pivotal in the Atlanta area market. Spring is the strong season. I still think that if we aren’t AT the bottom, we can see it from here.