際際滷

際際滷Share a Scribd company logo
TOPIC: COST OF CAPITAL
Submitted towards the partial fulfillment of the requirement for the
degree of
MASTERS OF BUSINESS ADMINISTRATION
MBA Batch 2012  2014
Submitted to: Submitted by:
Dr. DHEERAJ SHARMA Harkirat Brar(120425709)
MBA 1st
Year Section F
SCHOOL OF MANAGEMENT
STUDIES
PUNJABI UNIVERSITY, PATIALA
Tata Motors pvt. ltd
Balance Sheet of Tata Motors ------------------- in Rs. Cr. -------------------
Mar '12 Mar '11
12 mths 12 mths
Sources Of Funds
Total Share Capital 39.94 39.94
Equity Share Capital 39.94 39.94
Share Application Money 0.00 0.00
Preference Share Capital 0.00 0.00
Reserves 4,249.89 2,916.12
Revaluation Reserves 0.00 0.00
Networth 4,289.83 2,956.06
Secured Loans 994.85 1,458.45
Unsecured Loans 0.00 32.71
Total Debt 994.85 1,491.16
Total Liabilities 5,284.68 4,447.22
Mar '12 Mar '11
12 mths 12 mths
Application Of Funds
-------------
-- in Rs.
Cr. --------
-----------
Gross Block 6,308.26 5,538.46
Less: Accum. Depreciation 2,522.75 1,458.18
Net Block 3,785.51 4,080.28
Capital Work in Progress 193.95 125.14
Investments 3,964.26 5,128.75
Inventories 675.57 524.93
Sundry Debtors 272.31 130.59
Cash and Bank Balance 56.10 47.75
Total Current Assets 1,003.98 703.27
Loans and Advances 926.99 783.48
Fixed Deposits 20.72 23.77
Total CA, Loans & Advances 1,951.69 1,510.52
Deffered Credit 0.00 0.00
Current Liabilities 3,520.66 5,316.40
Provisions 1,090.07 1,081.07
Total CL & Provisions 4,610.73 6,397.47
Net Current Assets
-
2,659.04
-4,886.95
Miscellaneous Expenses 0.00 0.00
Total Assets 5,284.68 4,447.22
Contingent Liabilities 252.62 131.90
Book Value (Rs) 214.83 148.03
Profit & Loss account of Tata Motors
Mar '12 Mar '11
12 mths 12 mths
Income
Sales Turnover 25,252.98 20,787.27
Excise Duty 1,666.18 1,420.30
Net Sales 23,586.80 19,366.97
Other Income 347.46 238.27
Stock Adjustments 94.03 27.00
Total Income 24,028.29 19,632.24
Expenditure
Raw Materials 17,485.65 14,236.45
Power & Fuel Cost 112.66 100.47
Employee Cost 735.52 618.95
Other Manufacturing Expenses 51.62 409.89
Selling and Admin Expenses 1,257.84 1,090.72
Miscellaneous Expenses 389.52 340.42
Preoperative Exp Capitalised 0.00 0.00
Total Expenses 20,032.81 16,796.90
Mar '12 Mar '11
12 mths 12 mths
Operating Profit 3,648.02 2,597.07
PBDIT 3,995.48 2,835.34
Interest 33.43 28.20
Depreciation 1,097.34 402.38
Other Written Off 0.00 0.00
Profit Before Tax 2,864.71 2,404.76
Extra-ordinary items 0.00 0.00
PBT (Post Extra-ord Items) 2,864.71 2,404.76
Tax 486.58 476.86
Reported Net Profit 2,378.13 1,927.90
Total Value Addition 2,547.16 2,560.45
Preference Dividend 0.00 0.00
Equity Dividend 898.59 2,096.72
Corporate Dividend Tax 145.77 340.14
Per share data (annualised)
Shares in issue (lakhs) 1,996.88 1,996.88
Earnings Per Share (Rs) 119.09 96.55
Equity Dividend (%) 2,250.00 5,250.00
Book Value (Rs) 214.83 148.03
a) Cost of Debt(2012)
= interest/secured +unsecured loans
= 33.43 cr/994 cr *100
=3.36%
Cost of Debt(2011)
=28.28/1491.16*100
=1.9%
b) (1) Cost of equity capital:
Ke(2012)=D/N.P
=39.94/898.59*100
=4.44%
Ke(2011)=39.94/2096.72*100
=1.90%
(2)Earning yield method:
Ke(2012)=EPS/MPS
=119.09/1200*100
=9.9%
Ke(2011)=96.55/1200*100
=8.04%
Interpretation:
Cost of debt of Tata Motors in 2012 is more than as compared in 2011.
Cost of equity of this company in 2012 is more than in 2011.
Balance Sheet of General
motors
------------------- in Rs. Cr. -------------------
Mar '12 Mar '11
12 mths 12 mths
Sources Of Funds
Total Share Capital 289.37 289.37
Equity Share Capital 289.37 289.37
Share Application Money 0.00 0.00
Preference Share Capital 0.00 0.00
Reserves 5,751.70 4,620.85
Revaluation Reserves 0.00 0.00
Networth 6,041.07 4,910.22
Secured Loans 0.00 23.53
Unsecured Loans 97.48 301.62
Total Debt 97.48 325.15
Total Liabilities 6,138.55 5,235.37
Mar '12 Mar '11
12 mths 12 mths
Application Of Funds
Gross Block 3,425.94 3,395.16
Less: Accum. Depreciation 1,914.33 1,912.45
Net Block 1,511.61 1,482.71
Capital Work in Progress 343.15 149.34
Investments 4,882.81 4,795.20
Inventories 678.53 547.28
Sundry Debtors 423.20 362.76
Cash and Bank Balance 446.49 155.45
Total Current Assets 1,548.22 1,065.49
Loans and Advances 1,744.82 3,891.66
Fixed Deposits 1,208.36 401.04
Total CA, Loans & Advances 4,501.40 5,358.19
Deffered Credit 0.00 0.00
Current Liabilities 2,925.53 2,624.35
Provisions 2,174.89 3,925.72
Total CL & Provisions 5,100.42 6,550.07
Net Current Assets -599.02
-
1,191.88
Miscellaneous Expenses 0.00 0.00
Total Assets 6,138.55 5,235.37
Contingent Liabilities 1,445.67 959.66
Book Value (Rs) 208.77 169.69
Profit
and
loss
account
Mar'12 Mar'11 Mar'10
12
Months
12
Months
12
Months
Sales Turnover 20,475.74 17,386.51 12,420.95
Excise Duty 959.09 934.71 607.70
NET SALES 19,516.65 16,451.80 11,813.25
Other Income 0.00 0.00 0.00
TOTAL INCOME 19,872.38 16,859.96 11,964.37
Manufacturing
Expenses
175.61 148.38 127.89
Material Consumed 14,486.09 11,882.51 8,139.51
Personal Expenses 541.04 494.33 411.76
Selling Expenses 270.53 445.98 381.59
Administrative
Expenses
356.90 242.61 264.88
Expenses Capitalised -49.43 -16.66 -15.67
Provisions Made 0.00 0.00 0.00
TOTAL
EXPENDITURE
15,780.74 13,197.15 9,309.96
Operating Profit 3,735.91 3,254.65 2,503.29
EBITDA 4,091.64 3,662.81 2,654.41
Depreciation 145.62 122.84 136.45
Other Write-offs 2.14 2.14 0.00
EBIT 3,943.88 3,537.83 2,517.96
Interest 22.24 1.69 5.98
EBT 3,921.64 3,536.14 2,511.98
Taxes 1,022.12 1,011.02 710.12
Profit and Loss for
the Year
2,899.52 2,525.12 1,801.86
Non Recurring Items 57.93 767.84 -128.62
Other Non Cash
Adjustments
46.60 46.77 26.87
Other Adjustments 0.00 0.00 2.62
REPORTED PAT 3,004.05 3,339.73 1,702.73
Preference Dividend 0.00 0.00 0.00
Equity Dividend 1,302.15 1,157.47 578.73
Equity Dividend (%) 449.99 399.99 400.00
Shares in Issue
(Lakhs)
2,893.67 2,893.67 1,446.84
EPS - Annualised
(Rs)
103.81 115.42 117.69
Period Instrument Issued
Capital
From To (Rs. cr) Shares (nos) Face Value
2011 2012
Equity
Share
289.37 289367020 10
2010 2011
Equity
Share
289.37 289367020 10
Calculation of Cost of Capital
a)Cost of Debt(2012)
= interest/secured +unsecured loans
= 22.24/97.48*100
=22.81%
Cost of Debt(2011)
=1.69/325.15*100
=0.52%
b)(1) Cost of equity capital:
Ke(2012)=D/N.P
=1302.15/289.37*100
=4.5%
Ke(2011)=3339.73/289.37*100
=11.54%
(2)Earning yield method:
Ke(2012)=EPS/MPS
=103.81/1700*100
=6.1%
Ke(2011)=115.42/1700*100
=6.7%
Interpretation:
Cost of debt of General motors in 2012 is more than i.e.
22.81% than 0.52% in 2011.
It is clear from above figures that the Cost of equity
capital of this company is less in 2012 than in 2011
Conclusion :
By the calculation of cost of capital of General and Tata
motors we can say that in 2012
Cost of debt of both the companies is more than the
previous year i.e. 2011. But there is more gap in the cost
of debt of Tata than the General Motors.
The cost of equity of Tata is more than the General
motors.
Ad

Recommended

PPT
financial accounting
nishant bhatia
XLS
Hul p&l account
Santosh Sridharan
DOC
Findings analysis & conclusion
Ashish Aggarwal
PDF
AT&T Financial and Operational Results
finance1
PPTX
Annual report analysis of GMR infra ltd.
Mr. Arindam Bhattacharjee
PDF
Forcast Model
Syed Muhammad Ali - ACCA
PPTX
Kansai Nerolac Paints
Nikhil Agarwal
PDF
UAC annual report 2017
Michael Olafusi
PPTX
Presentation M&A Grasim Aditya Birla Nuvo
ANIRBAN BHATTACHARYA
PPTX
05. Basic Hotel's Accounting by Dino Leonandri-STP Trisakti
DINOLEONANDRI
PPTX
ppt on acc cements financial ratios, and cash flow analysis
parijatnath1990
PDF
financial statement analysis of Idea Cellular
Deepak Srivastva
DOCX
Afm
Jay Savani
DOCX
Nestle statement
WasseimQ
PPT
Avon Cycles Ltd
nehajain248
PDF
Example print out-efm-de
Excel Financial Model
PDF
credit-suisse Annual Report Part 3
QuarterlyEarningsReports2
PPT
Maruti suzuki ppt
Wipro
DOC
Finance final
Iftasiam Aqib Alam
PDF
11. merger of qualcomm and atheros (deb sahoo)
Deb Sahoo, MBA(Finance), MS(EE), BTech(EE),
PDF
Financial Statement Analysis Assignment Help
Online
PPTX
Audited fs hospital 2015 , ga 2016 summary
Medical Mission Group
DOC
Capital and money market
mithilsingh
PPT
Krispy Kreme Doughnuts
Jack Szczepaniuk
PDF
02. lbo of micron technologies (deb sahoo)
Deb Sahoo, MBA(Finance), MS(EE), BTech(EE),
PDF
2010 informe final_vacunaciones
Layarme Ticliahuanca Lizana
PPSX
Happy birth day2
Sao Gi畉y
PPT
Phillip dare presentation
Lisa Curran
PDF
Time table
kaanpakpum
DOCX
Iii unidad jos辿 alberto rodriguez padilla
Alberto Rodriguez

More Related Content

What's hot (17)

PPTX
Presentation M&A Grasim Aditya Birla Nuvo
ANIRBAN BHATTACHARYA
PPTX
05. Basic Hotel's Accounting by Dino Leonandri-STP Trisakti
DINOLEONANDRI
PPTX
ppt on acc cements financial ratios, and cash flow analysis
parijatnath1990
PDF
financial statement analysis of Idea Cellular
Deepak Srivastva
DOCX
Afm
Jay Savani
DOCX
Nestle statement
WasseimQ
PPT
Avon Cycles Ltd
nehajain248
PDF
Example print out-efm-de
Excel Financial Model
PDF
credit-suisse Annual Report Part 3
QuarterlyEarningsReports2
PPT
Maruti suzuki ppt
Wipro
DOC
Finance final
Iftasiam Aqib Alam
PDF
11. merger of qualcomm and atheros (deb sahoo)
Deb Sahoo, MBA(Finance), MS(EE), BTech(EE),
PDF
Financial Statement Analysis Assignment Help
Online
PPTX
Audited fs hospital 2015 , ga 2016 summary
Medical Mission Group
DOC
Capital and money market
mithilsingh
PPT
Krispy Kreme Doughnuts
Jack Szczepaniuk
PDF
02. lbo of micron technologies (deb sahoo)
Deb Sahoo, MBA(Finance), MS(EE), BTech(EE),
Presentation M&A Grasim Aditya Birla Nuvo
ANIRBAN BHATTACHARYA
05. Basic Hotel's Accounting by Dino Leonandri-STP Trisakti
DINOLEONANDRI
ppt on acc cements financial ratios, and cash flow analysis
parijatnath1990
financial statement analysis of Idea Cellular
Deepak Srivastva
Afm
Jay Savani
Nestle statement
WasseimQ
Avon Cycles Ltd
nehajain248
Example print out-efm-de
Excel Financial Model
credit-suisse Annual Report Part 3
QuarterlyEarningsReports2
Maruti suzuki ppt
Wipro
Finance final
Iftasiam Aqib Alam
11. merger of qualcomm and atheros (deb sahoo)
Deb Sahoo, MBA(Finance), MS(EE), BTech(EE),
Financial Statement Analysis Assignment Help
Online
Audited fs hospital 2015 , ga 2016 summary
Medical Mission Group
Capital and money market
mithilsingh
Krispy Kreme Doughnuts
Jack Szczepaniuk
02. lbo of micron technologies (deb sahoo)
Deb Sahoo, MBA(Finance), MS(EE), BTech(EE),

Viewers also liked (6)

PDF
2010 informe final_vacunaciones
Layarme Ticliahuanca Lizana
PPSX
Happy birth day2
Sao Gi畉y
PPT
Phillip dare presentation
Lisa Curran
PDF
Time table
kaanpakpum
DOCX
Iii unidad jos辿 alberto rodriguez padilla
Alberto Rodriguez
PPTX
Ii unidad jos辿 alberto rodriguez padilla
Alberto Rodriguez
2010 informe final_vacunaciones
Layarme Ticliahuanca Lizana
Happy birth day2
Sao Gi畉y
Phillip dare presentation
Lisa Curran
Time table
kaanpakpum
Iii unidad jos辿 alberto rodriguez padilla
Alberto Rodriguez
Ii unidad jos辿 alberto rodriguez padilla
Alberto Rodriguez
Ad

Similar to Harkirat fm assignment (20)

PDF
Cfr project tata motors iimc
Ashish Anand
PPT
Tata Motors Ratio Analysis
Jitendra
PPT
Tata Motors Capital Structure
itsvineeth209
PDF
A STUDY ON FINANCIAL ANALYSIS OF TATA MOTORS
Sara Alvarez
PPTX
Ppt tata motors
Arik Raj Anthony
PDF
Balance sheet projection
PRACHI NAVGHARE
PPTX
Automobile sector security analysis
Rahul Hedau
DOCX
NTPC Financial Modelling
SHAHID HASSAN
DOCX
NTPC Financial Modelling
Shreya Banerjee
PPTX
Maruthi Suzuki business performance after and before Covid
Litty Sylus
DOC
Balance sheet of Bajaj auto limited
Nirmal Shanmugam
PPTX
Maruti suzuki ind ltd
Pardeep Kohli
PPTX
Financial analysis of TATA TELESERVICES LTD
KHALIL AHMAD
PPTX
FINANCIAL ANALYSIS
Parul_sharma
PDF
Profit and loss projection
PRACHI NAVGHARE
PPTX
Group_5_22581_Kushagra_Singh.pptx
KushagraSingh272372
PPTX
Maruti suzuki pvt ltd
satish singh
PPT
Marutisuzuki 111210122426-phpapp02
JYOTI KAYARKAR
PPTX
BHARTI AIRTEL PPT
jyotisinghhrm
PPTX
Capital Structure analysis of Tata Motors
Vishrut Shah
Cfr project tata motors iimc
Ashish Anand
Tata Motors Ratio Analysis
Jitendra
Tata Motors Capital Structure
itsvineeth209
A STUDY ON FINANCIAL ANALYSIS OF TATA MOTORS
Sara Alvarez
Ppt tata motors
Arik Raj Anthony
Balance sheet projection
PRACHI NAVGHARE
Automobile sector security analysis
Rahul Hedau
NTPC Financial Modelling
SHAHID HASSAN
NTPC Financial Modelling
Shreya Banerjee
Maruthi Suzuki business performance after and before Covid
Litty Sylus
Balance sheet of Bajaj auto limited
Nirmal Shanmugam
Maruti suzuki ind ltd
Pardeep Kohli
Financial analysis of TATA TELESERVICES LTD
KHALIL AHMAD
FINANCIAL ANALYSIS
Parul_sharma
Profit and loss projection
PRACHI NAVGHARE
Group_5_22581_Kushagra_Singh.pptx
KushagraSingh272372
Maruti suzuki pvt ltd
satish singh
Marutisuzuki 111210122426-phpapp02
JYOTI KAYARKAR
BHARTI AIRTEL PPT
jyotisinghhrm
Capital Structure analysis of Tata Motors
Vishrut Shah
Ad

Harkirat fm assignment

  • 1. TOPIC: COST OF CAPITAL Submitted towards the partial fulfillment of the requirement for the degree of MASTERS OF BUSINESS ADMINISTRATION MBA Batch 2012 2014 Submitted to: Submitted by: Dr. DHEERAJ SHARMA Harkirat Brar(120425709) MBA 1st Year Section F SCHOOL OF MANAGEMENT STUDIES PUNJABI UNIVERSITY, PATIALA
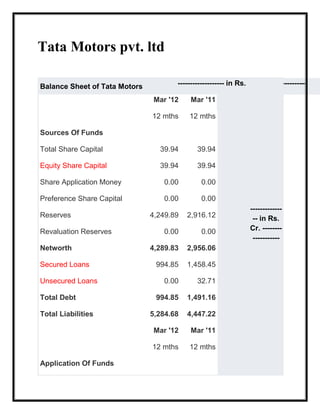
  • 2. Tata Motors pvt. ltd Balance Sheet of Tata Motors ------------------- in Rs. Cr. ------------------- Mar '12 Mar '11 12 mths 12 mths Sources Of Funds Total Share Capital 39.94 39.94 Equity Share Capital 39.94 39.94 Share Application Money 0.00 0.00 Preference Share Capital 0.00 0.00 Reserves 4,249.89 2,916.12 Revaluation Reserves 0.00 0.00 Networth 4,289.83 2,956.06 Secured Loans 994.85 1,458.45 Unsecured Loans 0.00 32.71 Total Debt 994.85 1,491.16 Total Liabilities 5,284.68 4,447.22 Mar '12 Mar '11 12 mths 12 mths Application Of Funds ------------- -- in Rs. Cr. -------- -----------
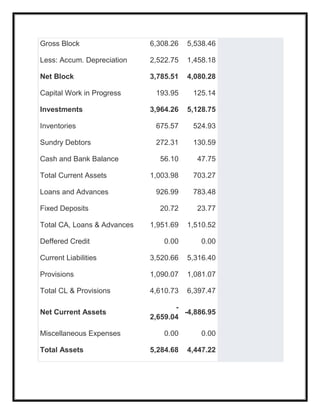
  • 3. Gross Block 6,308.26 5,538.46 Less: Accum. Depreciation 2,522.75 1,458.18 Net Block 3,785.51 4,080.28 Capital Work in Progress 193.95 125.14 Investments 3,964.26 5,128.75 Inventories 675.57 524.93 Sundry Debtors 272.31 130.59 Cash and Bank Balance 56.10 47.75 Total Current Assets 1,003.98 703.27 Loans and Advances 926.99 783.48 Fixed Deposits 20.72 23.77 Total CA, Loans & Advances 1,951.69 1,510.52 Deffered Credit 0.00 0.00 Current Liabilities 3,520.66 5,316.40 Provisions 1,090.07 1,081.07 Total CL & Provisions 4,610.73 6,397.47 Net Current Assets - 2,659.04 -4,886.95 Miscellaneous Expenses 0.00 0.00 Total Assets 5,284.68 4,447.22
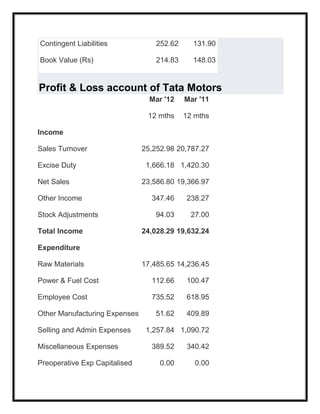
  • 4. Contingent Liabilities 252.62 131.90 Book Value (Rs) 214.83 148.03 Profit & Loss account of Tata Motors Mar '12 Mar '11 12 mths 12 mths Income Sales Turnover 25,252.98 20,787.27 Excise Duty 1,666.18 1,420.30 Net Sales 23,586.80 19,366.97 Other Income 347.46 238.27 Stock Adjustments 94.03 27.00 Total Income 24,028.29 19,632.24 Expenditure Raw Materials 17,485.65 14,236.45 Power & Fuel Cost 112.66 100.47 Employee Cost 735.52 618.95 Other Manufacturing Expenses 51.62 409.89 Selling and Admin Expenses 1,257.84 1,090.72 Miscellaneous Expenses 389.52 340.42 Preoperative Exp Capitalised 0.00 0.00
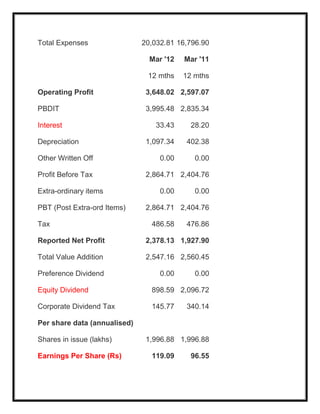
  • 5. Total Expenses 20,032.81 16,796.90 Mar '12 Mar '11 12 mths 12 mths Operating Profit 3,648.02 2,597.07 PBDIT 3,995.48 2,835.34 Interest 33.43 28.20 Depreciation 1,097.34 402.38 Other Written Off 0.00 0.00 Profit Before Tax 2,864.71 2,404.76 Extra-ordinary items 0.00 0.00 PBT (Post Extra-ord Items) 2,864.71 2,404.76 Tax 486.58 476.86 Reported Net Profit 2,378.13 1,927.90 Total Value Addition 2,547.16 2,560.45 Preference Dividend 0.00 0.00 Equity Dividend 898.59 2,096.72 Corporate Dividend Tax 145.77 340.14 Per share data (annualised) Shares in issue (lakhs) 1,996.88 1,996.88 Earnings Per Share (Rs) 119.09 96.55
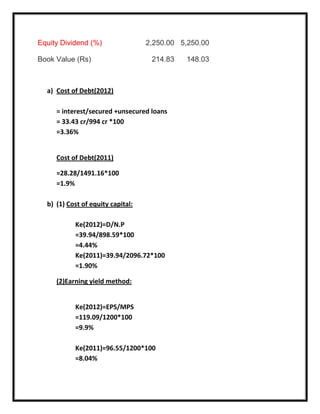
  • 6. Equity Dividend (%) 2,250.00 5,250.00 Book Value (Rs) 214.83 148.03 a) Cost of Debt(2012) = interest/secured +unsecured loans = 33.43 cr/994 cr *100 =3.36% Cost of Debt(2011) =28.28/1491.16*100 =1.9% b) (1) Cost of equity capital: Ke(2012)=D/N.P =39.94/898.59*100 =4.44% Ke(2011)=39.94/2096.72*100 =1.90% (2)Earning yield method: Ke(2012)=EPS/MPS =119.09/1200*100 =9.9% Ke(2011)=96.55/1200*100 =8.04%
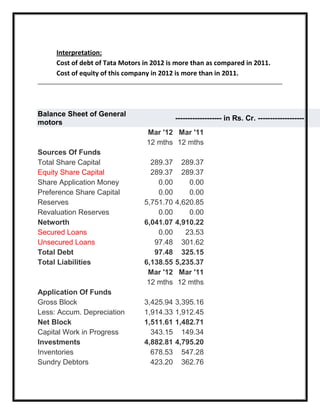
  • 7. Interpretation: Cost of debt of Tata Motors in 2012 is more than as compared in 2011. Cost of equity of this company in 2012 is more than in 2011. Balance Sheet of General motors ------------------- in Rs. Cr. ------------------- Mar '12 Mar '11 12 mths 12 mths Sources Of Funds Total Share Capital 289.37 289.37 Equity Share Capital 289.37 289.37 Share Application Money 0.00 0.00 Preference Share Capital 0.00 0.00 Reserves 5,751.70 4,620.85 Revaluation Reserves 0.00 0.00 Networth 6,041.07 4,910.22 Secured Loans 0.00 23.53 Unsecured Loans 97.48 301.62 Total Debt 97.48 325.15 Total Liabilities 6,138.55 5,235.37 Mar '12 Mar '11 12 mths 12 mths Application Of Funds Gross Block 3,425.94 3,395.16 Less: Accum. Depreciation 1,914.33 1,912.45 Net Block 1,511.61 1,482.71 Capital Work in Progress 343.15 149.34 Investments 4,882.81 4,795.20 Inventories 678.53 547.28 Sundry Debtors 423.20 362.76
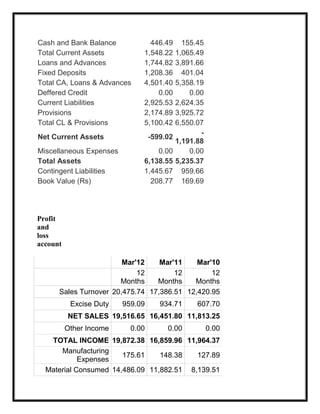
  • 8. Cash and Bank Balance 446.49 155.45 Total Current Assets 1,548.22 1,065.49 Loans and Advances 1,744.82 3,891.66 Fixed Deposits 1,208.36 401.04 Total CA, Loans & Advances 4,501.40 5,358.19 Deffered Credit 0.00 0.00 Current Liabilities 2,925.53 2,624.35 Provisions 2,174.89 3,925.72 Total CL & Provisions 5,100.42 6,550.07 Net Current Assets -599.02 - 1,191.88 Miscellaneous Expenses 0.00 0.00 Total Assets 6,138.55 5,235.37 Contingent Liabilities 1,445.67 959.66 Book Value (Rs) 208.77 169.69 Profit and loss account Mar'12 Mar'11 Mar'10 12 Months 12 Months 12 Months Sales Turnover 20,475.74 17,386.51 12,420.95 Excise Duty 959.09 934.71 607.70 NET SALES 19,516.65 16,451.80 11,813.25 Other Income 0.00 0.00 0.00 TOTAL INCOME 19,872.38 16,859.96 11,964.37 Manufacturing Expenses 175.61 148.38 127.89 Material Consumed 14,486.09 11,882.51 8,139.51
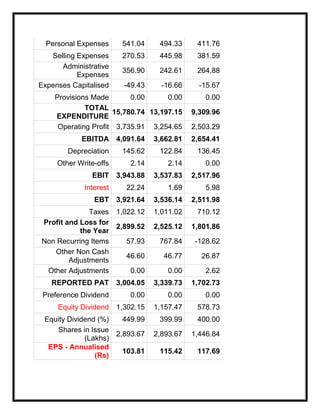
  • 9. Personal Expenses 541.04 494.33 411.76 Selling Expenses 270.53 445.98 381.59 Administrative Expenses 356.90 242.61 264.88 Expenses Capitalised -49.43 -16.66 -15.67 Provisions Made 0.00 0.00 0.00 TOTAL EXPENDITURE 15,780.74 13,197.15 9,309.96 Operating Profit 3,735.91 3,254.65 2,503.29 EBITDA 4,091.64 3,662.81 2,654.41 Depreciation 145.62 122.84 136.45 Other Write-offs 2.14 2.14 0.00 EBIT 3,943.88 3,537.83 2,517.96 Interest 22.24 1.69 5.98 EBT 3,921.64 3,536.14 2,511.98 Taxes 1,022.12 1,011.02 710.12 Profit and Loss for the Year 2,899.52 2,525.12 1,801.86 Non Recurring Items 57.93 767.84 -128.62 Other Non Cash Adjustments 46.60 46.77 26.87 Other Adjustments 0.00 0.00 2.62 REPORTED PAT 3,004.05 3,339.73 1,702.73 Preference Dividend 0.00 0.00 0.00 Equity Dividend 1,302.15 1,157.47 578.73 Equity Dividend (%) 449.99 399.99 400.00 Shares in Issue (Lakhs) 2,893.67 2,893.67 1,446.84 EPS - Annualised (Rs) 103.81 115.42 117.69
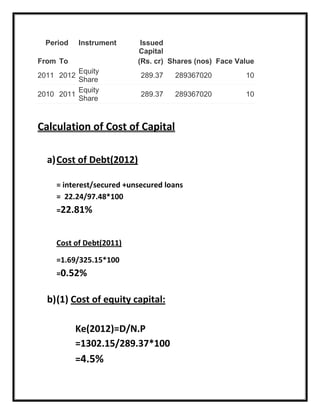
  • 10. Period Instrument Issued Capital From To (Rs. cr) Shares (nos) Face Value 2011 2012 Equity Share 289.37 289367020 10 2010 2011 Equity Share 289.37 289367020 10 Calculation of Cost of Capital a)Cost of Debt(2012) = interest/secured +unsecured loans = 22.24/97.48*100 =22.81% Cost of Debt(2011) =1.69/325.15*100 =0.52% b)(1) Cost of equity capital: Ke(2012)=D/N.P =1302.15/289.37*100 =4.5%
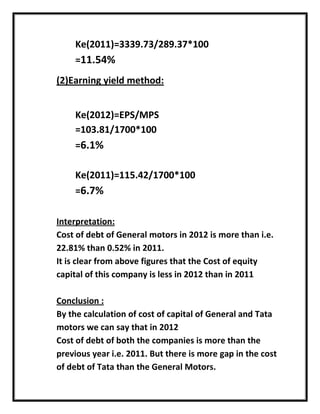
  • 11. Ke(2011)=3339.73/289.37*100 =11.54% (2)Earning yield method: Ke(2012)=EPS/MPS =103.81/1700*100 =6.1% Ke(2011)=115.42/1700*100 =6.7% Interpretation: Cost of debt of General motors in 2012 is more than i.e. 22.81% than 0.52% in 2011. It is clear from above figures that the Cost of equity capital of this company is less in 2012 than in 2011 Conclusion : By the calculation of cost of capital of General and Tata motors we can say that in 2012 Cost of debt of both the companies is more than the previous year i.e. 2011. But there is more gap in the cost of debt of Tata than the General Motors.
  • 12. The cost of equity of Tata is more than the General motors.