Hotel Performance | the world and China
- 1. CHAT - ? 2014 STR Global www.strglobal.comCHAT - ? 2014 STR Global www.strglobal.com Hotel Performance | the world and China CHAT Beijing 2014 Jesper Palmqvist, Area Director Asia Paci?c Fiona He, Country Manager China ľĆµę±íĎÖ¸ĹŔŔ ĘŔ˝çÓëÖĐąú
- 2. CHAT - ? 2014 STR Global www.strglobal.com The worldˇŻs leading Hospitality Benchmark company Aggregating key hotel metrics into valuable performance data ! Global client base ~50,000 hotels submitting performance data ! Industry standard used by all major hotel groups APAC: +5,300 hotels! +1,000,000 rooms Č«Çň·¶Î§ÄÚÓµÓĐł¬ąý5ÍňĽŇşĎ×÷ľĆµęŁ¬Ę÷?Á˘±ę¸ËĘýľÝąÜŔí?ĐĐҵ ±ę׼˛˘Î޸÷?´óľĆµęĽŻÍĹ??ąă·ş˛É?ÓĂ Č«ÇňÁěĎȵľƵęĘýľÝ·ţÎńĚáą©»úąą
- 3. CHAT - ? 2014 STR Global www.strglobal.com 5 5 things to know ÄăĐčŇŞÖŞµŔµÄ5ĽţĘ In 2013 SEA achieved highest KPI levels after AU/Paci?c 2013Ä궫ÄĎŃǵŘÇřąŘĽüÖ¸±ęÖµ±íĎÖ˝ö´ÎÓÚĚ«Ć˝ŃóµŘÇř China growth in supply outpaced demand in 2013 for the ?rst time since 2009 2013ÄęÖĐąúľĆµęą©¸řÁżŐÇ·ů5ÄęĽä?Ę×´Îł¬ąýĐčÇóÁżŐÇ·ů Large RevPAR variations by city in China Upscale hotels ÖĐąú¸÷łÇĘĐ?¸ß¶ËľĆµęĂżĽäżÉĘŰ·żĘŐ?ČëÓĐşÜ?´ó˛îŇě Indonesia pipeline growth - future supply gap decreasing vs China and India ÓˇÄáδŔ´ĐÂÔöą©¸řŁÎ´Ŕ´ą©¸řÓëÖĐąúşÍÓˇ¶Č˛îľŕÖđ˝ĄËő?С Beijing, Hong Kong, Singapore, Tokyo and Sydney - all expected to grow RevPAR in 2014 ±±ľ©Ł¬?Ďă¸ŰŁ¬ĐÂĽÓĆÂŁ¬¶«ľ©şÍϤÄá2014ÄęĂżĽäżÉĘŰ·żĘŐ?ČëÔ¤ĆÚʵĎÖŐýÖµÔö?ł¤
- 4. CHAT - ? 2014 STR Global www.strglobal.com Global performance RevPAR Ł Č«Çň±íĎÖ¸ĹŔŔ YE 2013, % Chg in USD, Europe in Euro Ł 2013ÄęĂżĽäżÉĘŰ·żĘŐ?Čë + 5.4% + 1.4% + 4.6% APAC only continent declining YoY USD offsets countries like Japan, Thailand and Australia - 4.3% South Korea! China! ! India! Singapore ŃÇĚ«ÇřĘÇΨ?Ň»łöĎÖͬ?±ČĎ½µµÄÇřÓň ?ČŐ±ľŁ¬Ě©ąúşÍ°Ä?´óŔűŃǵıíĎÖĘܵ˝Ŕ´?×ÔĂŔÔŞµÄÓ°Ďě
- 5. CHAT - ? 2014 STR Global www.strglobal.com Global performance RevPAR Ł Č«ÇňľĆµę±íĎÖ¸ĹŔŔ YTD 2014 Feb, % Chg in USD, Europe in Euro 2014Äę1-2?ÔÂĂżĽäżÉĘŰ·żĘŐ?Čë + 6.1% + 5.5% + 6.0% A brighter picture on macro level USD offset aside - India and Thailand main reasons - 2.0% şęąŰ˛ă?ĂćÉĎÇéżö¸üÎŞŔÖąŰ µ«ŃÇĚ«ÇřŁ¬łýÁËĂŔÔŞµÄÓ°Ď죬Ö÷ŇŞĎ½µłöĎÖÔÚÓˇ¶ČşÍĚ©ąú
- 6. CHAT - ? 2014 STR Global www.strglobal.com Spotlight Asia Paci?c Ł ŃÇĚ«Çř±íĎÖ¸ĹŔŔ 2013 YE, RevPAR $, % Chg (USD) Ł 2013ÄęĂżĽäżÉĘŰ·żĘŐ?Čë Central & South Asia! RevPAR $75 | -7.4%! Driven by ADR NorthEast Asia! RevPAR $71 | -5.9%! Driven by ADR SouthEast Asia! RevPAR $100 | +3.5%! Both Occ and ADR Paci?c! RevPAR $124 | -3.4%! Driven by ADR? (NB! USD-AUD)
- 7. CHAT - ? 2014 STR Global www.strglobal.com APAC Classes Occ and ADR Ł ŃÇĚ«Çř¸÷Ľ¶±đľĆµęĘĐłˇ±íĎÖ YE 2012 & 2013 (USD) and % change YoY Ł ·żĽŰşÍ?ČëסÂĘͬ?±Č±ä»ŻÂĘ 2013¶Ô?±Č2012 US$0 US$60 US$120 US$180 US$240 60% 62% 64% 66% 68% 70% 72% 74% Luxury Upper Upscale Upscale Upper Midscale Midscale & Economy Occ 12 Occ 13 ADR 13 -0.9 -4.4 -4.4 -5.0 -7.5 -0.9 +1.0 -0.4 -1.6 +0.7
- 8. CHAT - ? 2014 STR Global www.strglobal.com APAC Room Supply/Demand % Change Ł ŃÇĚ«Çř±íĎÖ¸ĹŔŔ 12 months moving avg YE 2009 to Feb 2014 Ł ąö¶Ż12¸ö?ÔÂą©¸řÁżşÍĐčÇóÁż±ä»ŻÂĘ -2% 0% 2% 4% 6% 8% 10% 12% 14% 16% 2010 2011 2012 2013 2014 Supply % Chg Demand % Chg Demand growth on the rise again ĐčÇóÁżłĘÉĎÉýÇ÷ĘĆ
- 9. CHAT - ? 2014 STR Global www.strglobal.com APAC Countries - Occ, ADR % Chg ŃÇĚ«Ö÷ŇŞąúĽŇ YE 2013, in local currency 2013Äę·żĽŰşÍ?ČëסÂʱ仯ÂĘ -6% -4% -2% 0% 2% 4% 6% 8% 10% 12% India China South Korea Singapore Australia Philippines Thailand Japan Taiwan Indonesia Occupancy ADR whoˇŻs driving rate? ËÔÚ´ř¶Ż·żĽŰÔö?ł¤Łż
- 10. CHAT - ? 2014 STR Global www.strglobal.com YTD Feb 2014, in local currency Ł 2014Äę1-2?Ô·żĽŰşÍ?ČëסÂʱ仯ÂĘ -18% -15% -12% -9% -6% -3% 0% 3% 6% 9% 12% 15% 18% India China South Korea Singapore Australia Philippines Thailand Japan Taiwan Indonesia Occupancy ADR signi?cant shifts ĎÔÖř±ä»Ż APAC Countries - Occ, ADR % Chg ŃÇĚ«Ö÷ŇŞąúĽŇ
- 11. CHAT - ? 2014 STR Global www.strglobal.com ÖĐąú China
- 12. CHAT - ? 2014 STR Global www.strglobal.com China - ÖĐąú CAGR 2007 - 2013 YE (CNY) -7% -6% -5% -4% -3% -2% -1% 0% 1% 2% 3% 4% 5% 6% 7% Occupancy ADR RevPAR Supply Demand
- 13. CHAT - ? 2014 STR Global www.strglobal.com China Room Supply/Demand % Change Ł ÖĐąú±íĎÖ¸ĹŔŔ 12 months moving avg YE 2010 to Feb 2014 Ł ąö¶Ż12¸ö?ÔÂą©¸řÁżşÍĐčÇóÁż±ä»ŻÂĘ 0% 5% 10% 15% 20% 25% 30% 2010 2011 2012 2013 2014 Supply % Chg Demand % Chg Demand on the rise? ĐčÇóÁżÔö?ł¤»áłÖĐř±ŁłÖÔö?ł¤Łż
- 14. CHAT - ? 2014 STR Global www.strglobal.com China Ł ÖĐąú By class: YE 2012 and 2013, Occ, ADR with % Chg ¸÷Ľ¶±đĘĐłˇ2013Äę·żĽŰşÍ?ČëסÂʱ仯ÂĘ Luxury Upper Upscale Upscale Upper Midscale Midscale & Economy Occ 12 Occ 13 ADR 13 -2.3 -4.0 -0.3 -2.5 -3.2 -0.3 -2.5 -3.2 -0.5 -1.6
- 15. CHAT - ? 2014 STR Global www.strglobal.com China Ł ÖĐąú Main Cities RevPAR % growth YE 2012 and 2013 - Ö÷ŇŞłÇĘĐżÉĘŰ·żĘŐ?Čëͬ?±Č±ä»ŻÂĘ Chengdu! Ningbo! Wuxi! Shenyang! Beijing! Suzhou! Sanya! Xian! Wuhan! Tianjin! Nanjing! Chongqing! Guangzhou! Shanghai! Hangzhou! Xiamen! Shenzhen! -10% to -20% -4% to -10% 0% to -3% +1% to +10%
- 16. CHAT - ? 2014 STR Global www.strglobal.com China Ł ÖĐąú RevPAR (Luxury-Upscale) growth and actual Ö÷ŇŞłÇĘĐ?¸ß¶ËľĆµęĘĐłˇĂżĽäżÉĘŰ·żĽ°±ä»ŻÂĘ -30% -20% -10% 0% 10% Wuxi Shenyang Tianjin Chongqing Ningbo Xian Suzhou Nanjing Wuhan Chengdu Hangzhou Xiamen Beijing Shanghai Guangzhou Shenzhen Sanya RevPAR Growth RevPAR
- 17. CHAT - ? 2014 STR Global www.strglobal.com -18% -15% -12% -9% -6% -3% 0% 3% 2011 2012 2013 Transient Group Segmentation Ł ϸ·ÖĘĐłˇ RevPAR growth YoY - Beijing, Shanghai, Guangzhou, Shenzhen ĂżĽäżÉĘŰ·żĘŐ?Čë±ä»ŻÂĘŁ±±ľ©Ł¬ÉĎşŁŁ¬??ąăÖÝŁ¬ÉîŰÚ
- 18. CHAT - ? 2014 STR Global www.strglobal.com Revenue Generator Index (RGI) on YE 2008 0.7 0.8 0.9 1 1.1 2008 2009 2010 2011 2012 2013 USA Europe China ĘŐ?ČëÖ¸Ęý±ä»ŻÇ÷ĘĆ
- 19. CHAT - ? 2014 STR Global www.strglobal.com Outlook Ç°ľ°ŐąÍű
- 20. CHAT - ? 2014 STR Global www.strglobal.com Branded vs. Unbranded Mega Brand Awesome Family Europe & South America North America 65% - 35% 57% - 43% 47% - 53% 40% - 60% 36% - 64% Middle East Asia Paci?c Africa Ć·ĹƾƵę vs. ?·ÇĆ·ĹƾƵę Ĺ·ÖŢşÍÄĎĂŔ ±±ĂŔ Öж« ŃÇĚ« ?·ÇÖŢ (Batman)(Mr Brand)
- 21. CHAT - ? 2014 STR Global www.strglobal.com Global Pipeline Ł Č«Çňłď˝¨Ďî??Äż¸ĹŔŔ Pipeline % increase # of rooms ·żĽäĘýÔö?ł¤ÂĘ +7% +22% +3% +37% +7% +14%
- 22. CHAT - ? 2014 STR Global www.strglobal.com Pipeline by Class - ¸÷Ľ¶±đľĆµęłď˝¨Ďî??Äż¸ĹŔŔ China India Indonesia Malaysia Thailand 14% 51% 33% 10% 8% 8% 12% 19% 12% 2% 49% 22% 34% 43% 40% 29% 16% 14% 35% 50% Luxury & Upper Upscale Upscale & Upper Midscale Midscale & Economy Unaf?liated Chain Scale Active Pipeline 15% ! 25% ! 33% ! 22% ! 9% Top 5 Pipeline countries, Supply increase % of existing Jan 2014 δŔ´ĐÂÔöą©¸ř×î¶ŕµÄÇ°Îĺ?´óąúĽŇ ÓĐЧĐÂÔöą©¸ř
- 23. CHAT - ? 2014 STR Global www.strglobal.com Pipeline - Growth status łď˝¨Ďî??Äż¸ĹŔŔ China | India | Indonesia - Supply growth ÖĐąú Óˇ¶ČşÍÓˇÄá δŔ´ą©¸řÔö?ł¤Ç÷ĘĆ 2000 2001 2002 2003 2004 2005 2006 2007 2008 2009 2010 2011 2012 2013 2014 2015 2016 Indonesia India Ratio China 17% 16% 13% 12% 12% 13% 14% CAGR 3.8% CAGR 11.9% CAGR 10.3%
- 24. CHAT - ? 2014 STR Global www.strglobal.com Occupancy % Change ADR%Change Occupancy & ADR % Change 2013 YE - ·żĽŰşÍ?ČëסÂʱ仯ÂĘ Occupancy - ?ČëסÂĘ Market Forecast - ĘĐłˇÔ¤˛â
- 25. . CHAT - ? 2014 STR Global www.strglobal.com everything is awesome in 2014..? 2014Äę?Ň»ÇжĽşÜĂŔşĂ..?
- 26. CHAT - ? 2014 STR Global www.strglobal.com Market Forecast ŁĘĐłˇÔ¤˛â Occupancy & ADR % Change 2014 forecast 2014Äę·żĽŰşÍ?ČëסÂʱ仯ÂĘ ADR%Change Occupancy % Change Rates to drive RevPAR - ·żĽŰĘÇÇý¶Ż ĂżĽäżÉĘŰ·żĘŐ?ČëÔö?ł¤µÄ¶ŻŇň
- 27. CHAT - ? 2014 STR Global www.strglobal.com 0% 5% 10% 15% 20% 25% 30% YE2009 YE2010 YE2011 YE2012 YE2013 YE2014f YE2015f YE2016f Demand GDP China Demand vs GDP - ÖĐąúĐčÇóÁżÓëGDP·˘ŐąÇ÷ĘĆ
- 28. CHAT - ? 2014 STR Global www.strglobal.com One more thingˇ »ąÓĐ?Ň»ĽţĘ¡
- 29. CHAT - ? 2014 STR Global www.strglobal.com Global P&L 2012 - Č«Çň¸÷¸öÇřÓň Regional performance 2012 % Change -9 -6 -3 0 3 6 9 12 Asia Paci?c ($) Americas ($) Europe (€) Middle East & Africa ($) Occupancy ADR RevPAR GOPPAR
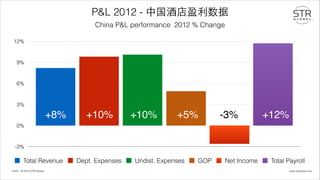
- 30. CHAT - ? 2014 STR Global www.strglobal.com P&L 2012 - ÖĐąúľĆµęÓŻŔűĘýľÝ China P&L performance 2012 % Change -3% 0% 3% 6% 9% 12% Total Revenue Dept. Expenses Undist. Expenses GOP Net Income Total Payroll +8% +10% +10% +5% +12%-3%
- 31. CHAT - ? 2014 STR Global www.strglobal.com 5 5 things to know ÄăĐčŇŞÖŞµŔµÄ5ĽţĘ In 2013 SEA achieved highest KPI levels after AU/Paci?c 2013Ä궫ÄĎŃǵŘÇřąŘĽüÖ¸±ęÖµ±íĎÖ˝ö´ÎÓÚĚ«Ć˝ŃóµŘÇř China growth in supply outpaced demand in 2013 for the ?rst time since 2009 2013ÄęÖĐąúľĆµęą©¸řÁżŐÇ·ů5ÄęĽä?Ę×´Îł¬ąýĐčÇóÁżŐÇ·ů Large RevPAR variations by city in China Upscale hotels ÖĐąú¸÷łÇĘĐ?¸ß¶ËľĆµęĂżĽäżÉĘŰ·żĘŐ?ČëÓĐşÜ?´ó˛îŇě Indonesia pipeline growth - future supply gap decreasing vs China and India ÓˇÄáδŔ´ĐÂÔöą©¸řŁÎ´Ŕ´ą©¸řÓëÖĐąúşÍÓˇ¶Č˛îľŕÖđ˝ĄËő?С Beijing, Hong Kong, Singapore, Tokyo and Sydney - all expected to grow RevPAR in 2014 ±±ľ©Ł¬?Ďă¸ŰŁ¬ĐÂĽÓĆÂŁ¬¶«ľ©şÍϤÄá2014ÄęĂżĽäżÉĘŰ·żĘŐ?ČëÔ¤ĆÚʵĎÖŐýÖµÔö?ł¤
- 32. CHAT - ? 2014 STR Global www.strglobal.com Thank You лл Jesper Palmqvist | Fiona He STR Global +86 10 8518 2438 www.strglobal.com STR Global, Ltd is the exclusive owner of all rights in this presentation and its content. Reproduction of all or a portion of this presentation for any purpose without prior approval of STR Global is strictly prohibited. ! This presentation is based on information compiled by STR Global Ltd. No strategic or marketing recommendations or advice are intended or implied. Email us for a copy of this deck ČôĐčÍęŐűŃÝ˝˛×ĘÁĎ,ÇëÁŞĎµÎŇĂÇ apinfo@strglobal.com STR Global ¶Ô´Ë·Ý×ĘÁĎĎíÓжŔĽŇ°ćȨˇŁŃϸń˝ű?ÖąÔÚδľÔĘĐíµÄÇéżö϶Ô×ĘÁĎÄÚµÄÄÚČÝ»ň˛ż·ÖÄÚČÝ˝ř?Đи´ÖĆÔٰ档! ! ´Ë·Ý×ĘÁĎÄÚČÝ»ůÓÚSTR Global Ltd.µÄĘýľÝĐĹϢŁ¬˛»´řÓĐČκζÔÓÚ˛ßÂÔ»ňĘĐłˇÇăĎňĐÔ?ŃÔÂŰşÍŇâÍĽˇŁ!


