House Price Prediction An AI Approach.
- 1. House Price Prediction Group Name: Bug Free 9/6/2019 1 Group members: 1.Nahian Ahmed 2.Sajibul Hasan 3.Tariqul Islam 4.Monsur Ahmed 5.Hazera Akter
- 2. Sajibul Hasan ID : 151-15-4986
- 3. Introduction Suppose you have a house. And you want to sell it. Through House Price Prediction project you can predict the price from previous sell history. And we make this prediction using Machine Learning.
- 4. Machine Learning Machine learning is a subset of AI. Which is more data oriented and use statistics methods on the data to discover information. ML categories: 1.Supervised learning(which we used) 2. Unsupervised learning 3. Reinforcement Learning
- 5. Supervised learning In supervised learning, each example is a pair consisting of an input object (typically a vector) and a desired output value (also called the supervisory signal) *that means we know about the data and its feature
- 7. Monsur Ahmed ID : 151-15-5439
- 8. Linear Regression In statistics, linear regression is a linear approach for modeling the relationship between a dependent variable y and a more explanatory (Independent) variables X. Formula: Y=b0 +b1X Y=Dependent Variable b0=Intercept, b1 =Slope, X=Independent Variable
- 16. Tariqul Islam ID : 151-15-5144
- 23. Nahian Ahmed ID : 151-15-5137
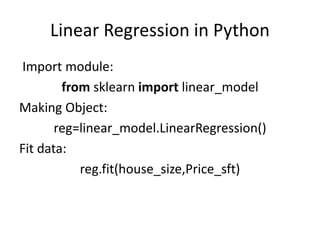
- 24. Linear Regression in Python Import module: from sklearn import linear_model Making Object: reg=linear_model.LinearRegression() Fit data: reg.fit(house_size,Price_sft)
- 25. Linear Regression in Python Slope: b1 =reg.coef_[0] Intercept: b0=reg.intercept_
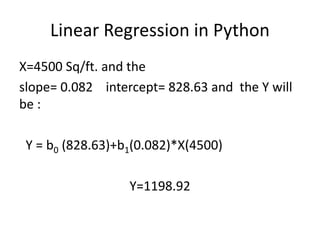
- 26. Linear Regression in Python X=4500 Sq/ft. and the slope= 0.082 intercept= 828.63 and the Y will be : Y = b0 (828.63)+b1(0.082)*X(4500) Y=1198.92
- 27. Hazera Akter ID : 151-15-4819
- 28. DATA VISUALIZATION For Data Visualization we used matplotlib: pyplot.plot(house_size,Price_sft,'ro')
- 29. DATA VISUALIZATION Data point after prediction pyplot.plot(X,ans,'bs')
- 30. Limitation ŌĆó Less data ŌĆó Less feature in data ŌĆó Linear Regression( not PCA Dimensionality Reduction )
- 31. Project Video
- 32. Thank You


![Linear Regression in Python
Slope:
b1 =reg.coef_[0]
Intercept:
b0=reg.intercept_](https://image.slidesharecdn.com/housepricepredection-1-190906172716/85/House-Price-Prediction-An-AI-Approach-25-320.jpg)


